Scolaris Content Display Scolaris Content Display

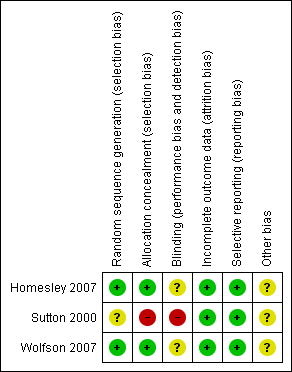
Methodological quality summary: review authors' judgements about each methodological quality item for each included study.
Figuras y tablas -
Figure 1

Methodological quality summary: review authors' judgements about each methodological quality item for each included study.

Methodological quality graph: review authors' judgements about each methodological quality item presented as percentages across all included studies.
Figuras y tablas -
Figure 2

Methodological quality graph: review authors' judgements about each methodological quality item presented as percentages across all included studies.

Comparison 1 Combination therapy versus Ifosfamide, Outcome 1 Overall survival.
Figuras y tablas -
Analysis 1.1

Comparison 1 Combination therapy versus Ifosfamide, Outcome 1 Overall survival.

Comparison 1 Combination therapy versus Ifosfamide, Outcome 2 Progression‐free survival.
Figuras y tablas -
Analysis 1.2

Comparison 1 Combination therapy versus Ifosfamide, Outcome 2 Progression‐free survival.

Comparison 1 Combination therapy versus Ifosfamide, Outcome 3 G3‐4 Nausea/vomiting.
Figuras y tablas -
Analysis 1.3

Comparison 1 Combination therapy versus Ifosfamide, Outcome 3 G3‐4 Nausea/vomiting.

Comparison 1 Combination therapy versus Ifosfamide, Outcome 4 Diarrhoea and other GI.
Figuras y tablas -
Analysis 1.4

Comparison 1 Combination therapy versus Ifosfamide, Outcome 4 Diarrhoea and other GI.

Comparison 1 Combination therapy versus Ifosfamide, Outcome 5 Haematological.
Figuras y tablas -
Analysis 1.5

Comparison 1 Combination therapy versus Ifosfamide, Outcome 5 Haematological.

Comparison 1 Combination therapy versus Ifosfamide, Outcome 6 Genitourinary.
Figuras y tablas -
Analysis 1.6

Comparison 1 Combination therapy versus Ifosfamide, Outcome 6 Genitourinary.

Comparison 1 Combination therapy versus Ifosfamide, Outcome 7 Cardiovascular.
Figuras y tablas -
Analysis 1.7

Comparison 1 Combination therapy versus Ifosfamide, Outcome 7 Cardiovascular.

Comparison 1 Combination therapy versus Ifosfamide, Outcome 8 Hepatic.
Figuras y tablas -
Analysis 1.8

Comparison 1 Combination therapy versus Ifosfamide, Outcome 8 Hepatic.

Comparison 1 Combination therapy versus Ifosfamide, Outcome 9 Neuropathy.
Figuras y tablas -
Analysis 1.9

Comparison 1 Combination therapy versus Ifosfamide, Outcome 9 Neuropathy.

Comparison 2 Whole body irradiation versus chemotherapy, Outcome 1 Overall survival.
Figuras y tablas -
Analysis 2.1

Comparison 2 Whole body irradiation versus chemotherapy, Outcome 1 Overall survival.

Comparison 2 Whole body irradiation versus chemotherapy, Outcome 2 Progression‐free survival.
Figuras y tablas -
Analysis 2.2

Comparison 2 Whole body irradiation versus chemotherapy, Outcome 2 Progression‐free survival.

Comparison 2 Whole body irradiation versus chemotherapy, Outcome 3 G3‐4 Gastrointestinal.
Figuras y tablas -
Analysis 2.3

Comparison 2 Whole body irradiation versus chemotherapy, Outcome 3 G3‐4 Gastrointestinal.

Comparison 2 Whole body irradiation versus chemotherapy, Outcome 4 Haematological.
Figuras y tablas -
Analysis 2.4

Comparison 2 Whole body irradiation versus chemotherapy, Outcome 4 Haematological.

Comparison 2 Whole body irradiation versus chemotherapy, Outcome 5 Genitourinary.
Figuras y tablas -
Analysis 2.5

Comparison 2 Whole body irradiation versus chemotherapy, Outcome 5 Genitourinary.

Comparison 2 Whole body irradiation versus chemotherapy, Outcome 6 Cardiovascular.
Figuras y tablas -
Analysis 2.6

Comparison 2 Whole body irradiation versus chemotherapy, Outcome 6 Cardiovascular.

Comparison 2 Whole body irradiation versus chemotherapy, Outcome 7 Hepatic.
Figuras y tablas -
Analysis 2.7

Comparison 2 Whole body irradiation versus chemotherapy, Outcome 7 Hepatic.

Comparison 2 Whole body irradiation versus chemotherapy, Outcome 8 Neuropathy.
Figuras y tablas -
Analysis 2.8

Comparison 2 Whole body irradiation versus chemotherapy, Outcome 8 Neuropathy.

Comparison 1. Combination therapy versus Ifosfamide

Outcome or subgroup title

No. of studies

No. of participants

Statistical method

Effect size

1 Overall survival Show forest plot

2

373

Hazard Ratio (Random, 95% CI)

0.75 [0.60, 0.94]

2 Progression‐free survival Show forest plot

2

373

Hazard Ratio (Random, 95% CI)

0.72 [0.58, 0.90]

3 G3‐4 Nausea/vomiting Show forest plot

2

365

Risk Ratio (IV, Random, 95% CI)

3.53 [1.33, 9.37]

4 Diarrhoea and other GI Show forest plot

2

365

Risk Ratio (IV, Random, 95% CI)

1.51 [0.31, 7.52]

5 Haematological Show forest plot

2

365

Risk Ratio (IV, Random, 95% CI)

1.56 [0.84, 2.90]

6 Genitourinary Show forest plot

2

365

Risk Ratio (IV, Random, 95% CI)

1.68 [0.54, 5.18]

7 Cardiovascular Show forest plot

2

365

Risk Ratio (IV, Random, 95% CI)

0.63 [0.13, 3.11]

8 Hepatic Show forest plot

1

174

Risk Ratio (IV, Random, 95% CI)

2.05 [0.73, 5.74]

9 Neuropathy Show forest plot

2

365

Risk Ratio (IV, Random, 95% CI)

1.59 [0.99, 2.55]

Figuras y tablas -
Comparison 1. Combination therapy versus Ifosfamide
Comparison 2. Whole body irradiation versus chemotherapy

Outcome or subgroup title

No. of studies

No. of participants

Statistical method

Effect size

1 Overall survival Show forest plot

1

Hazard Ratio (Random, 95% CI)

Subtotals only

2 Progression‐free survival Show forest plot

1

Hazard Ratio (Random, 95% CI)

Subtotals only

3 G3‐4 Gastrointestinal Show forest plot

1

Risk Ratio (IV, Random, 95% CI)

Subtotals only

4 Haematological Show forest plot

1

Risk Ratio (IV, Random, 95% CI)

Subtotals only

5 Genitourinary Show forest plot

1

Risk Ratio (IV, Random, 95% CI)

Subtotals only

6 Cardiovascular Show forest plot

1

Risk Ratio (IV, Random, 95% CI)

Subtotals only

7 Hepatic Show forest plot

1

Risk Ratio (IV, Random, 95% CI)

Subtotals only

8 Neuropathy Show forest plot

1

Risk Ratio (IV, Random, 95% CI)

Subtotals only

Figuras y tablas -
Comparison 2. Whole body irradiation versus chemotherapy