Musicoterapia para la lesión cerebral adquirida
Información
- DOI:
- https://doi.org/10.1002/14651858.CD006787.pub3Copiar DOI

- Base de datos:
-
- Cochrane Database of Systematic Reviews
- Versión publicada:
-
- 20 enero 2017see what's new
- Tipo:
-
- Intervention
- Etapa:
-
- Review
- Grupo Editorial Cochrane:
-
Grupo Cochrane de Accidentes cerebrovasculares
- Copyright:
-
- Copyright © 2017 The Cochrane Collaboration. Published by John Wiley & Sons, Ltd.
Cifras del artículo
Altmetric:
Citado por:
Autores
Contributions of authors
Wendy Magee (WM), Imogen Clark (IC), Jeanette Tamplin (JT), Joke Bradt (JB)
-
Co‐ordinating the review: WM
-
Revision of the background, objectives, criteria for considering studies for this update: WM, IC, JT, JB
-
Search strategies, methods: JB
-
Undertaking manual searches: WM, IC, JT, and graduate assistants
-
Searches: WM
-
Screening search results: WM and graduate assistant
-
Retrieval of papers: WM
-
Screening retrieved papers against inclusion criteria: IC, JT
-
Appraising the quality of the papers: IC, JT (in cases of disagreement, WM, JB)
-
Abstracting data from papers: WM, JB
-
Writing to authors of all trials (published and unpublished) for additional information: WM
-
Providing and screening additional data on all studies (published and unpublished): WM
-
Data management for the review: WM
-
Entering data into Review Manager 5: JB
-
Review Manager 5 statistical data and all other statistical data: JB
-
Double entry of data: JB, WM
-
Interpretation of data: JB, WM
-
Statistical inferences: JB
-
Writing the review: WM, IC, JT, JB
-
Obtaining funding for the review: WM for the update
-
Person responsible for reading and checking the review before submission: WM
Sources of support
Internal sources
-
Temple University, USA.
Partial support for this update provided by a Boyer College Vice Provost for the Arts Grant
External sources
-
State of Pennsylvania Formula Fund, USA.
Partial support for the original review (Bradt 2010)
Declarations of interest
All four of the review authors (WM, IC, JT, JB) are music therapists. WM was involved in the design, conduct, and publication of two of the studies included in this review (O'Kelly 2014; Pool 2012).
Acknowledgements
We acknowledge the Cochrane Stroke Group Editorial Team for advice and support, and Brenda Thomas for her assistance in the design of the search strategy for the original review and updated search strategies for this update. We also acknowledge the following individuals for their help in screening the titles and abstracts and the retrieval of articles as graduate assistants: Patricia Gonzalez and Mike Viega in the original review, and Vern Miller for this update. Lastly, we acknowledge the authors of the original review who were not involved with this update: Cheryl Dileo, Emer McGilloway and Barbara Wheeler.
Version history
| Published | Title | Stage | Authors | Version |
| 2017 Jan 20 | Music interventions for acquired brain injury | Review | Wendy L Magee, Imogen Clark, Jeanette Tamplin, Joke Bradt | |
| 2010 Jul 07 | Music therapy for acquired brain injury | Review | Joke Bradt, Wendy L Magee, Cheryl Dileo, Barbara L Wheeler, Emer McGilloway | |
| 2007 Oct 17 | Music therapy for acquired brain injury | Protocol | Joke Bradt, Wendy L Magee, Cheryl Dileo, Barbara L Wheeler, Emer McGilloway | |
Differences between protocol and review
We planned to update our search of the Science Citation Index electronic database. However, this database was omitted in the initial search by our search specialist. Although we attempted to correct this omission when we updated our searches in January 2016, a change in search specialist personnel resulted in no specialist who was available to undertake this search at that time. Although Science Citation Index is a major database, we believe that research relating to the topic under investigation (health and music) is most likely to have been published on primarily healthcare databases, for which searches were performed.
Keywords
MeSH
Medical Subject Headings (MeSH) Keywords
- Acoustic Stimulation [methods];
- Aphasia [rehabilitation];
- Brain Damage, Chronic [*rehabilitation];
- Brain Injuries [complications, *rehabilitation];
- Gait Disorders, Neurologic [etiology, *rehabilitation];
- Music Therapy [*methods];
- Randomized Controlled Trials as Topic;
- Stroke [complications];
- Walk Test;
Medical Subject Headings Check Words
Adult; Female; Humans; Male;
PICO
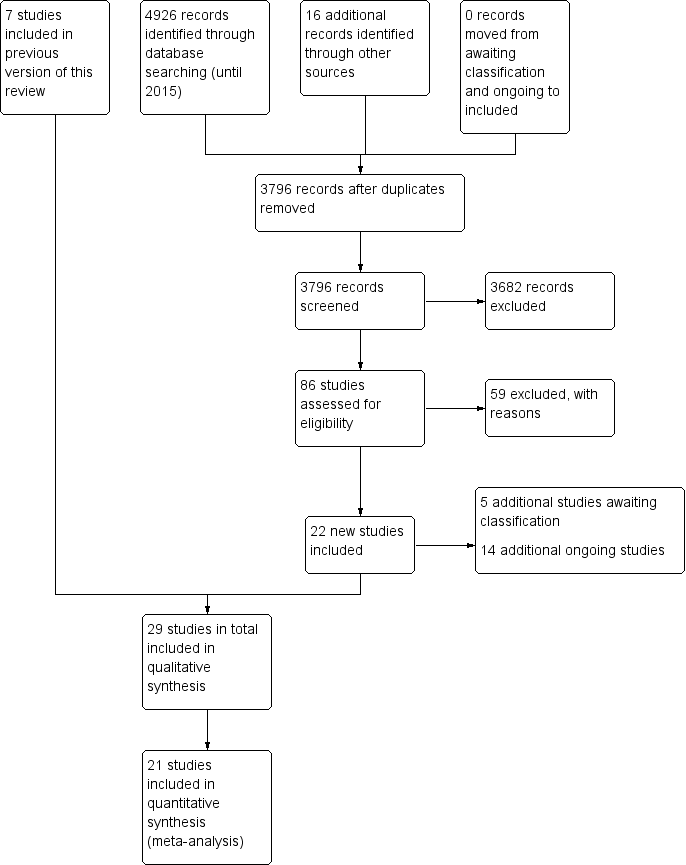
Study flow diagram for the updated review.

Risk of bias graph: review authors' judgements about each risk of bias item presented as percentages across all included studies.
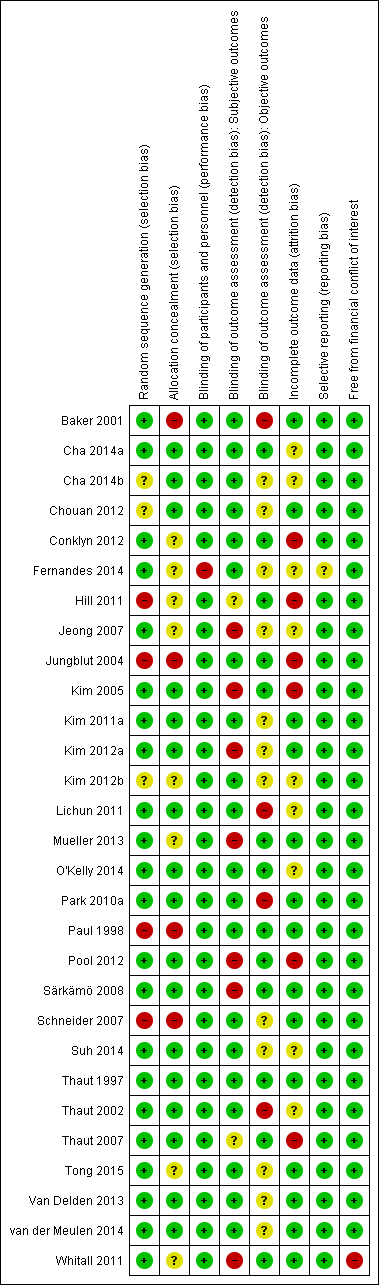
Risk of bias summary: review authors' judgements about each risk of bias item for each included study.
![Funnel plot of comparison: 1 Music therapy versus control, outcome: 1.1 Gait velocity [metres/min].](/es/cdsr/doi/10.1002/14651858.CD006787.pub3/media/CDSR/CD006787/image_n/nCD006787-AFig-FIG04.png)
Funnel plot of comparison: 1 Music therapy versus control, outcome: 1.1 Gait velocity [metres/min].

Comparison 1 Music therapy versus control, Outcome 1 Gait velocity.

Comparison 1 Music therapy versus control, Outcome 2 Gait velocity ‐ interventionist.

Comparison 1 Music therapy versus control, Outcome 3 Gait velocity ‐ music type.

Comparison 1 Music therapy versus control, Outcome 4 Stride length (affected side).

Comparison 1 Music therapy versus control, Outcome 5 Stride length (affected side) ‐ music type.
![Comparison 1 Music therapy versus control, Outcome 6 Stride length (unaffected side) [metres].](/es/cdsr/doi/10.1002/14651858.CD006787.pub3/media/CDSR/CD006787/image_n/nCD006787-CMP-001-06.png)
Comparison 1 Music therapy versus control, Outcome 6 Stride length (unaffected side) [metres].
![Comparison 1 Music therapy versus control, Outcome 7 Stride length (unspecified) [metres].](/es/cdsr/doi/10.1002/14651858.CD006787.pub3/media/CDSR/CD006787/image_n/nCD006787-CMP-001-07.png)
Comparison 1 Music therapy versus control, Outcome 7 Stride length (unspecified) [metres].
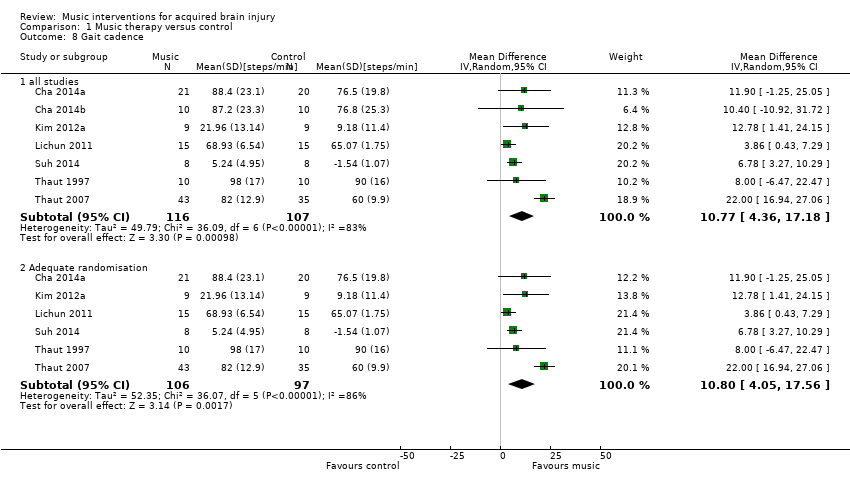
Comparison 1 Music therapy versus control, Outcome 8 Gait cadence.

Comparison 1 Music therapy versus control, Outcome 9 Gait cadence ‐ interventionist.

Comparison 1 Music therapy versus control, Outcome 10 Gait cadence ‐ music type.
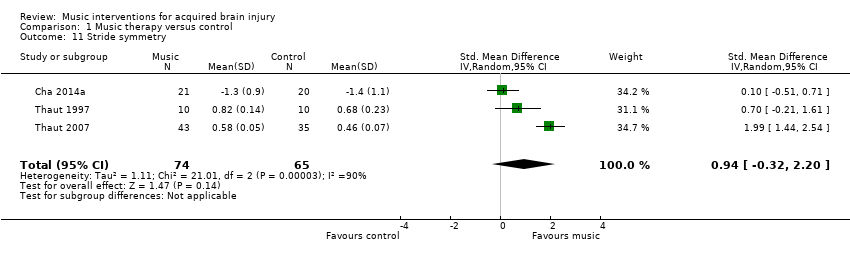
Comparison 1 Music therapy versus control, Outcome 11 Stride symmetry.
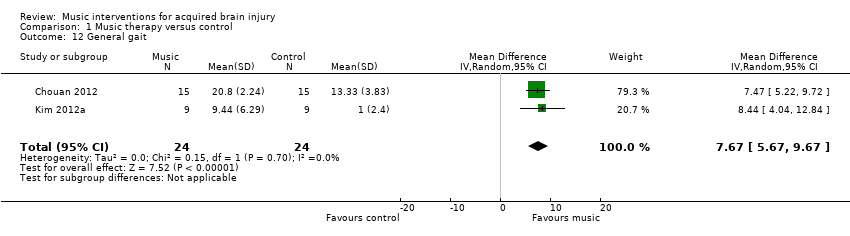
Comparison 1 Music therapy versus control, Outcome 12 General gait.

Comparison 1 Music therapy versus control, Outcome 13 Balance.

Comparison 1 Music therapy versus control, Outcome 14 Upper extremity functioning (general).
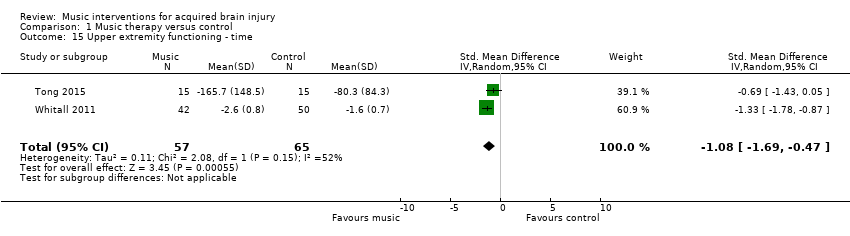
Comparison 1 Music therapy versus control, Outcome 15 Upper extremity functioning ‐ time.
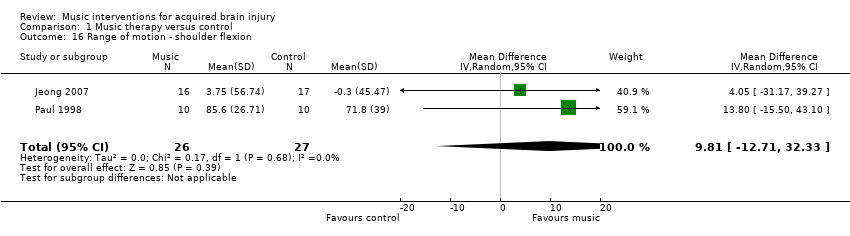
Comparison 1 Music therapy versus control, Outcome 16 Range of motion ‐ shoulder flexion.
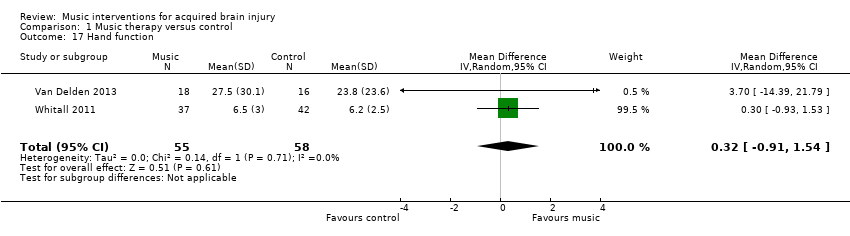
Comparison 1 Music therapy versus control, Outcome 17 Hand function.
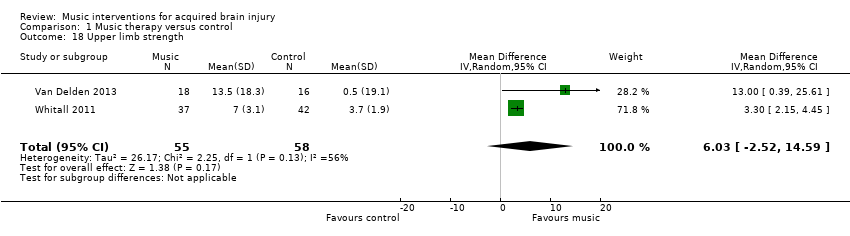
Comparison 1 Music therapy versus control, Outcome 18 Upper limb strength.
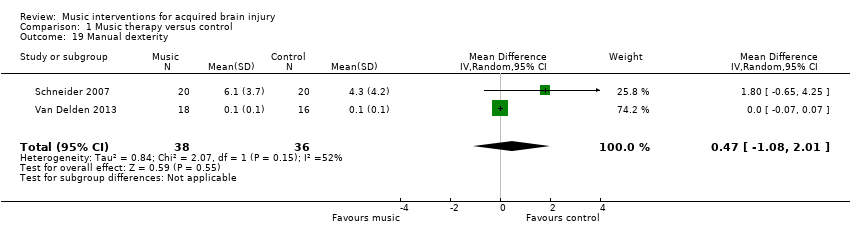
Comparison 1 Music therapy versus control, Outcome 19 Manual dexterity.
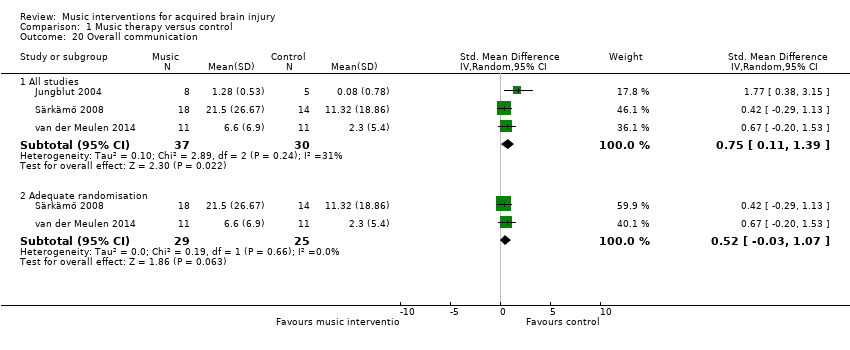
Comparison 1 Music therapy versus control, Outcome 20 Overall communication.
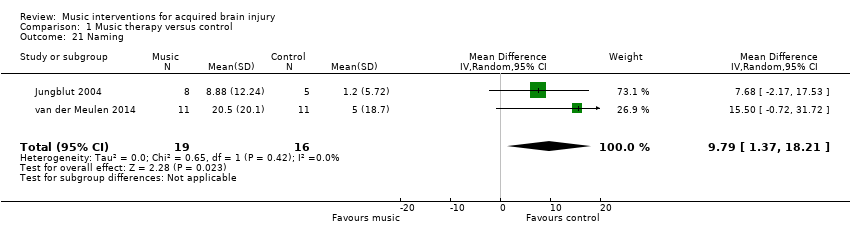
Comparison 1 Music therapy versus control, Outcome 21 Naming.
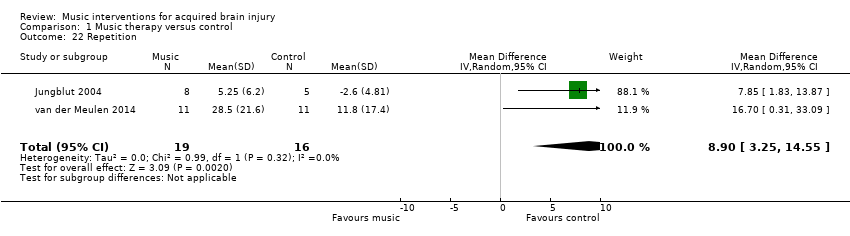
Comparison 1 Music therapy versus control, Outcome 22 Repetition.

Comparison 1 Music therapy versus control, Outcome 23 Memory.

Comparison 1 Music therapy versus control, Outcome 24 Attention.
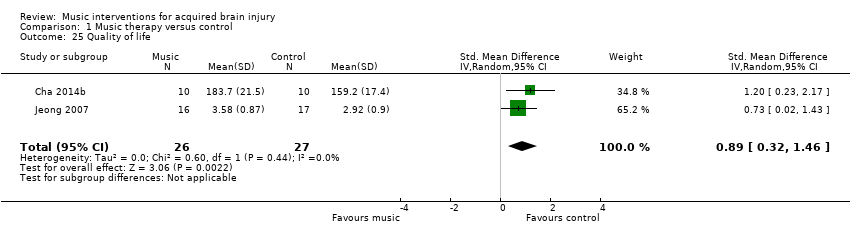
Comparison 1 Music therapy versus control, Outcome 25 Quality of life.
| Music compared with standard care for acquired brain injury | |||
| Patient or population: acquired brain injury | |||
| Outcomes | Relative effect | No of participants | Quality of the evidence |
| Gait velocity | The mean gait velocity in the intervention group was 11.34 metres more (8.4 more to 14.28 more). | 268 | ⊕⊕⊕⊝ |
| Stride length (affected side) | The mean stride length (affected side) in the intervention group was 0.12 metres more (0.04 more to 0.2 more). | 129 | ⊕⊕⊕⊝ |
| Gait cadence | The mean gait cadence in the intervention group was 10.77 steps/minute more (4.36 more to 17.18 more). | 223 | ⊕⊕⊝⊝ |
| Stride symmetry | The mean stride symmetry in the intervention group was 0.94 standard deviations more (0.32 fewer to 2.2 more). | 139 | ⊕⊕⊝⊝ |
| General upper extremity functioning assessed with: Fugl‐Meyer Assessment | The mean general upper extremity functioning in the intervention group was 3.56 units higher (0.88 lower to 8 higher). | 194 | ⊕⊝⊝⊝ |
| Overall communication | The mean overall communication in the intervention group was 0.75 standard deviations more (0.11 more to 1.39 more). | 67 | ⊕⊝⊝⊝ |
| Quality of life assessed with: Stroke Specific Quality of Life Scale | The mean quality of life in the intervention group was 0.89 standard deviations more (0.32 more to 1.46 more). | 53 | ⊕⊕⊝⊝ |
| CI: confidence interval; RCT: randomised controlled trial | |||
| GRADE Working Group grades of evidence | |||
| 1Most studies were rated as at unclear or high risk of bias | |||
| Outcome or subgroup title | No. of studies | No. of participants | Statistical method | Effect size |
| 1 Gait velocity Show forest plot | 9 | Mean Difference (IV, Random, 95% CI) | Subtotals only | |
| 1.1 All studies | 9 | 268 | Mean Difference (IV, Random, 95% CI) | 11.34 [8.40, 14.28] |
| 1.2 Adequate randomisation | 7 | 228 | Mean Difference (IV, Random, 95% CI) | 10.79 [7.23, 14.35] |
| 2 Gait velocity ‐ interventionist Show forest plot | 9 | 268 | Mean Difference (IV, Random, 95% CI) | 11.34 [8.40, 14.28] |
| 2.1 Music therapist | 3 | 128 | Mean Difference (IV, Random, 95% CI) | 14.76 [13.84, 15.69] |
| 2.2 Non‐music therapist | 6 | 140 | Mean Difference (IV, Random, 95% CI) | 8.48 [5.16, 11.80] |
| 3 Gait velocity ‐ music type Show forest plot | 9 | 268 | Mean Difference (IV, Random, 95% CI) | 11.34 [8.40, 14.28] |
| 3.1 Music | 5 | 173 | Mean Difference (IV, Random, 95% CI) | 14.69 [13.77, 15.61] |
| 3.2 Auditory stimulation (no music) | 4 | 95 | Mean Difference (IV, Random, 95% CI) | 7.70 [3.03, 12.38] |
| 4 Stride length (affected side) Show forest plot | 5 | Mean Difference (IV, Random, 95% CI) | Subtotals only | |
| 4.1 All studies | 5 | 129 | Mean Difference (IV, Random, 95% CI) | 0.12 [0.04, 0.20] |
| 4.2 Adequate randomisation | 3 | 89 | Mean Difference (IV, Random, 95% CI) | 0.08 [0.05, 0.11] |
| 5 Stride length (affected side) ‐ music type Show forest plot | 5 | 129 | Mean Difference (IV, Random, 95% CI) | 0.12 [0.04, 0.20] |
| 5.1 Music | 2 | 50 | Mean Difference (IV, Random, 95% CI) | 0.08 [0.05, 0.12] |
| 5.2 Auditory stimulation (no music) | 3 | 79 | Mean Difference (IV, Random, 95% CI) | 0.14 [0.02, 0.25] |
| 6 Stride length (unaffected side) [metres] Show forest plot | 4 | Mean Difference (IV, Random, 95% CI) | Subtotals only | |
| 6.1 All studies | 4 | 99 | Mean Difference (IV, Random, 95% CI) | 0.11 [0.01, 0.22] |
| 6.2 Adequate randomisation | 2 | 59 | Mean Difference (IV, Random, 95% CI) | 0.06 [0.01, 0.12] |
| 7 Stride length (unspecified) [metres] Show forest plot | 3 | 186 | Mean Difference (IV, Random, 95% CI) | 0.16 [‐0.01, 0.33] |
| 8 Gait cadence Show forest plot | 7 | Mean Difference (IV, Random, 95% CI) | Subtotals only | |
| 8.1 all studies | 7 | 223 | Mean Difference (IV, Random, 95% CI) | 10.77 [4.36, 17.18] |
| 8.2 Adequate randomisation | 6 | 203 | Mean Difference (IV, Random, 95% CI) | 10.80 [4.05, 17.56] |
| 9 Gait cadence ‐ interventionist Show forest plot | 7 | 223 | Mean Difference (IV, Random, 95% CI) | 10.77 [4.36, 17.18] |
| 9.1 Music therapist | 3 | 128 | Mean Difference (IV, Random, 95% CI) | 11.51 [‐2.57, 25.60] |
| 9.2 Non‐music therapist | 4 | 95 | Mean Difference (IV, Random, 95% CI) | 7.65 [4.43, 10.86] |
| 10 Gait cadence ‐ music type Show forest plot | 7 | 223 | Mean Difference (IV, Random, 95% CI) | 10.77 [4.36, 17.18] |
| 10.1 Music | 4 | 148 | Mean Difference (IV, Random, 95% CI) | 11.34 [‐1.05, 23.74] |
| 10.2 Auditory stimulus (no music) | 3 | 75 | Mean Difference (IV, Random, 95% CI) | 7.58 [4.33, 10.83] |
| 11 Stride symmetry Show forest plot | 3 | 139 | Std. Mean Difference (IV, Random, 95% CI) | 0.94 [‐0.32, 2.20] |
| 12 General gait Show forest plot | 2 | 48 | Mean Difference (IV, Random, 95% CI) | 7.67 [5.67, 9.67] |
| 13 Balance Show forest plot | 3 | Std. Mean Difference (IV, Random, 95% CI) | Subtotals only | |
| 13.1 All studies | 3 | 54 | Std. Mean Difference (IV, Random, 95% CI) | 0.31 [‐0.48, 1.09] |
| 13.2 Adequate randomisation | 2 | 34 | Std. Mean Difference (IV, Random, 95% CI) | 0.13 [‐1.10, 1.37] |
| 14 Upper extremity functioning (general) Show forest plot | 5 | Mean Difference (IV, Random, 95% CI) | Subtotals only | |
| 14.1 All studies | 5 | 194 | Mean Difference (IV, Random, 95% CI) | 3.56 [‐0.88, 8.00] |
| 14.2 Adequate randomisation | 3 | 156 | Mean Difference (IV, Random, 95% CI) | 0.89 [‐2.33, 4.12] |
| 15 Upper extremity functioning ‐ time Show forest plot | 2 | 122 | Std. Mean Difference (IV, Random, 95% CI) | ‐1.08 [‐1.69, ‐0.47] |
| 16 Range of motion ‐ shoulder flexion Show forest plot | 2 | 53 | Mean Difference (IV, Random, 95% CI) | 9.81 [‐12.71, 32.33] |
| 17 Hand function Show forest plot | 2 | 113 | Mean Difference (IV, Random, 95% CI) | 0.32 [‐0.91, 1.54] |
| 18 Upper limb strength Show forest plot | 2 | 113 | Mean Difference (IV, Random, 95% CI) | 6.03 [‐2.52, 14.59] |
| 19 Manual dexterity Show forest plot | 2 | 74 | Mean Difference (IV, Random, 95% CI) | 0.47 [‐1.08, 2.01] |
| 20 Overall communication Show forest plot | 3 | Std. Mean Difference (IV, Random, 95% CI) | Subtotals only | |
| 20.1 All studies | 3 | 67 | Std. Mean Difference (IV, Random, 95% CI) | 0.75 [0.11, 1.39] |
| 20.2 Adequate randomisation | 2 | 54 | Std. Mean Difference (IV, Random, 95% CI) | 0.52 [‐0.03, 1.07] |
| 21 Naming Show forest plot | 2 | 35 | Mean Difference (IV, Random, 95% CI) | 9.79 [1.37, 18.21] |
| 22 Repetition Show forest plot | 2 | 35 | Mean Difference (IV, Random, 95% CI) | 8.90 [3.25, 14.55] |
| 23 Memory Show forest plot | 2 | 42 | Std. Mean Difference (IV, Random, 95% CI) | 0.33 [‐0.29, 0.95] |
| 24 Attention Show forest plot | 2 | 39 | Std. Mean Difference (IV, Random, 95% CI) | 0.30 [‐0.34, 0.94] |
| 25 Quality of life Show forest plot | 2 | 53 | Std. Mean Difference (IV, Random, 95% CI) | 0.89 [0.32, 1.46] |