| 1 Gait velocity Show forest plot | 9 | | Mean Difference (IV, Random, 95% CI) | Subtotals only |
|
| 1.1 All studies | 9 | 268 | Mean Difference (IV, Random, 95% CI) | 11.34 [8.40, 14.28] |
| 1.2 Adequate randomisation | 7 | 228 | Mean Difference (IV, Random, 95% CI) | 10.79 [7.23, 14.35] |
| 2 Gait velocity ‐ interventionist Show forest plot | 9 | 268 | Mean Difference (IV, Random, 95% CI) | 11.34 [8.40, 14.28] |
|
| 2.1 Music therapist | 3 | 128 | Mean Difference (IV, Random, 95% CI) | 14.76 [13.84, 15.69] |
| 2.2 Non‐music therapist | 6 | 140 | Mean Difference (IV, Random, 95% CI) | 8.48 [5.16, 11.80] |
| 3 Gait velocity ‐ music type Show forest plot | 9 | 268 | Mean Difference (IV, Random, 95% CI) | 11.34 [8.40, 14.28] |
|
| 3.1 Music | 5 | 173 | Mean Difference (IV, Random, 95% CI) | 14.69 [13.77, 15.61] |
| 3.2 Auditory stimulation (no music) | 4 | 95 | Mean Difference (IV, Random, 95% CI) | 7.70 [3.03, 12.38] |
| 4 Stride length (affected side) Show forest plot | 5 | | Mean Difference (IV, Random, 95% CI) | Subtotals only |
|
| 4.1 All studies | 5 | 129 | Mean Difference (IV, Random, 95% CI) | 0.12 [0.04, 0.20] |
| 4.2 Adequate randomisation | 3 | 89 | Mean Difference (IV, Random, 95% CI) | 0.08 [0.05, 0.11] |
| 5 Stride length (affected side) ‐ music type Show forest plot | 5 | 129 | Mean Difference (IV, Random, 95% CI) | 0.12 [0.04, 0.20] |
|
| 5.1 Music | 2 | 50 | Mean Difference (IV, Random, 95% CI) | 0.08 [0.05, 0.12] |
| 5.2 Auditory stimulation (no music) | 3 | 79 | Mean Difference (IV, Random, 95% CI) | 0.14 [0.02, 0.25] |
| 6 Stride length (unaffected side) [metres] Show forest plot | 4 | | Mean Difference (IV, Random, 95% CI) | Subtotals only |
|
| 6.1 All studies | 4 | 99 | Mean Difference (IV, Random, 95% CI) | 0.11 [0.01, 0.22] |
| 6.2 Adequate randomisation | 2 | 59 | Mean Difference (IV, Random, 95% CI) | 0.06 [0.01, 0.12] |
| 7 Stride length (unspecified) [metres] Show forest plot | 3 | 186 | Mean Difference (IV, Random, 95% CI) | 0.16 [‐0.01, 0.33] |
|
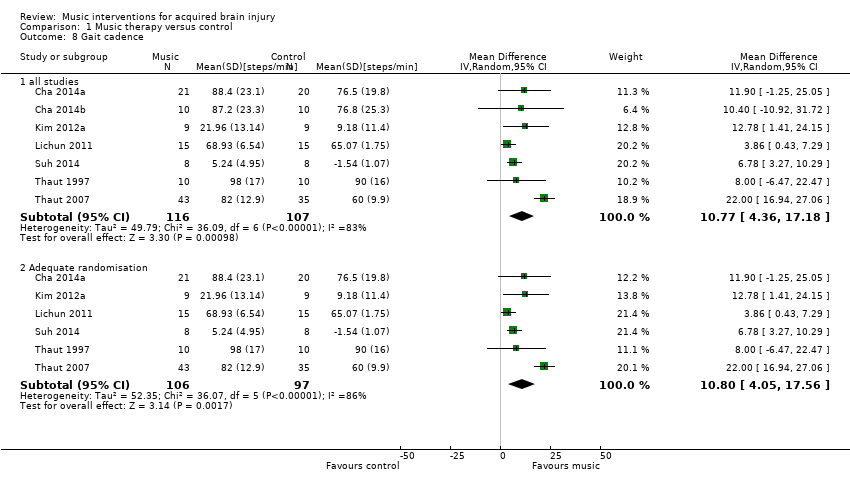
| 8 Gait cadence Show forest plot | 7 | | Mean Difference (IV, Random, 95% CI) | Subtotals only |
|
| 8.1 all studies | 7 | 223 | Mean Difference (IV, Random, 95% CI) | 10.77 [4.36, 17.18] |
| 8.2 Adequate randomisation | 6 | 203 | Mean Difference (IV, Random, 95% CI) | 10.80 [4.05, 17.56] |
| 9 Gait cadence ‐ interventionist Show forest plot | 7 | 223 | Mean Difference (IV, Random, 95% CI) | 10.77 [4.36, 17.18] |
|
| 9.1 Music therapist | 3 | 128 | Mean Difference (IV, Random, 95% CI) | 11.51 [‐2.57, 25.60] |
| 9.2 Non‐music therapist | 4 | 95 | Mean Difference (IV, Random, 95% CI) | 7.65 [4.43, 10.86] |
| 10 Gait cadence ‐ music type Show forest plot | 7 | 223 | Mean Difference (IV, Random, 95% CI) | 10.77 [4.36, 17.18] |
|
| 10.1 Music | 4 | 148 | Mean Difference (IV, Random, 95% CI) | 11.34 [‐1.05, 23.74] |
| 10.2 Auditory stimulus (no music) | 3 | 75 | Mean Difference (IV, Random, 95% CI) | 7.58 [4.33, 10.83] |
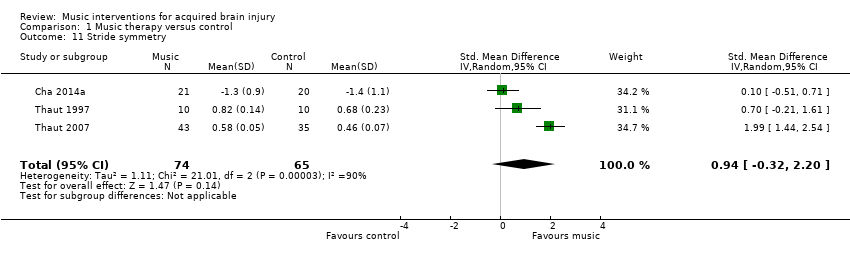
| 11 Stride symmetry Show forest plot | 3 | 139 | Std. Mean Difference (IV, Random, 95% CI) | 0.94 [‐0.32, 2.20] |
|
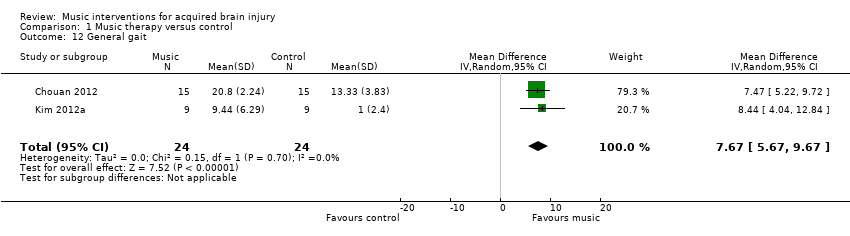
| 12 General gait Show forest plot | 2 | 48 | Mean Difference (IV, Random, 95% CI) | 7.67 [5.67, 9.67] |
|
| 13 Balance Show forest plot | 3 | | Std. Mean Difference (IV, Random, 95% CI) | Subtotals only |
|
| 13.1 All studies | 3 | 54 | Std. Mean Difference (IV, Random, 95% CI) | 0.31 [‐0.48, 1.09] |
| 13.2 Adequate randomisation | 2 | 34 | Std. Mean Difference (IV, Random, 95% CI) | 0.13 [‐1.10, 1.37] |
| 14 Upper extremity functioning (general) Show forest plot | 5 | | Mean Difference (IV, Random, 95% CI) | Subtotals only |
|
| 14.1 All studies | 5 | 194 | Mean Difference (IV, Random, 95% CI) | 3.56 [‐0.88, 8.00] |
| 14.2 Adequate randomisation | 3 | 156 | Mean Difference (IV, Random, 95% CI) | 0.89 [‐2.33, 4.12] |
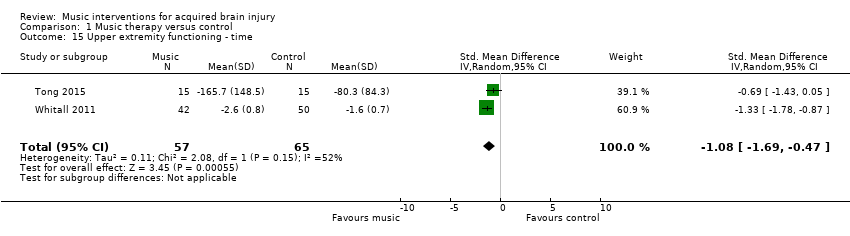
| 15 Upper extremity functioning ‐ time Show forest plot | 2 | 122 | Std. Mean Difference (IV, Random, 95% CI) | ‐1.08 [‐1.69, ‐0.47] |
|
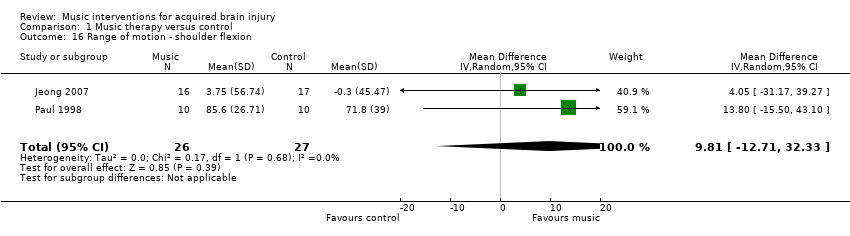
| 16 Range of motion ‐ shoulder flexion Show forest plot | 2 | 53 | Mean Difference (IV, Random, 95% CI) | 9.81 [‐12.71, 32.33] |
|
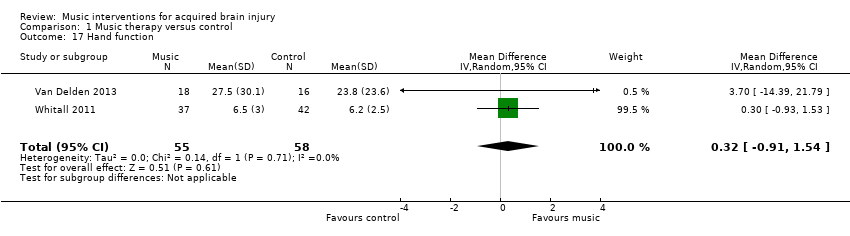
| 17 Hand function Show forest plot | 2 | 113 | Mean Difference (IV, Random, 95% CI) | 0.32 [‐0.91, 1.54] |
|
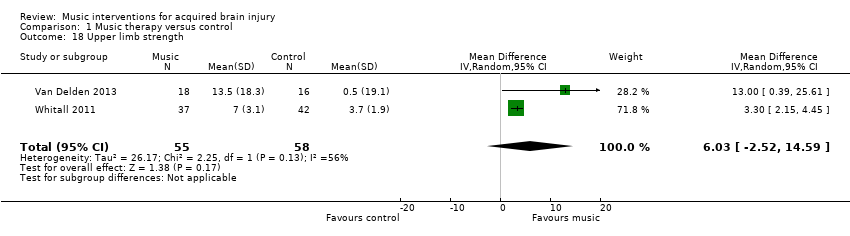
| 18 Upper limb strength Show forest plot | 2 | 113 | Mean Difference (IV, Random, 95% CI) | 6.03 [‐2.52, 14.59] |
|
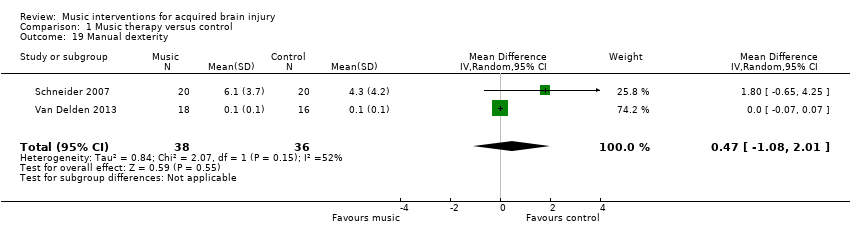
| 19 Manual dexterity Show forest plot | 2 | 74 | Mean Difference (IV, Random, 95% CI) | 0.47 [‐1.08, 2.01] |
|
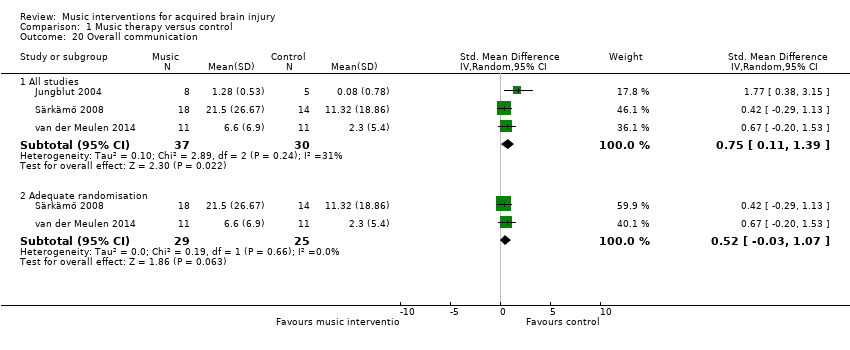
| 20 Overall communication Show forest plot | 3 | | Std. Mean Difference (IV, Random, 95% CI) | Subtotals only |
|
| 20.1 All studies | 3 | 67 | Std. Mean Difference (IV, Random, 95% CI) | 0.75 [0.11, 1.39] |
| 20.2 Adequate randomisation | 2 | 54 | Std. Mean Difference (IV, Random, 95% CI) | 0.52 [‐0.03, 1.07] |
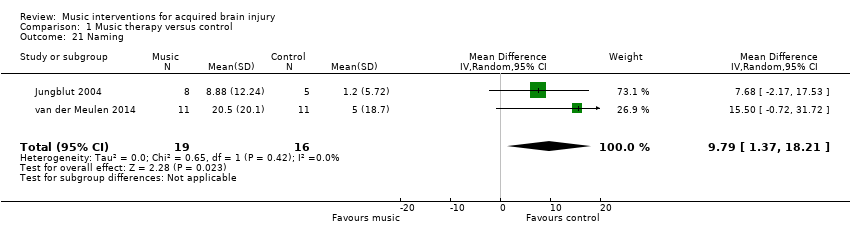
| 21 Naming Show forest plot | 2 | 35 | Mean Difference (IV, Random, 95% CI) | 9.79 [1.37, 18.21] |
|
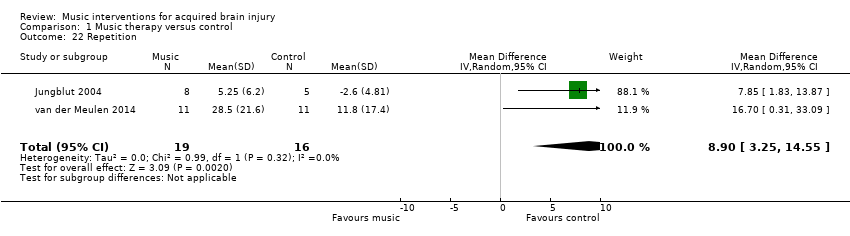
| 22 Repetition Show forest plot | 2 | 35 | Mean Difference (IV, Random, 95% CI) | 8.90 [3.25, 14.55] |
|
| 23 Memory Show forest plot | 2 | 42 | Std. Mean Difference (IV, Random, 95% CI) | 0.33 [‐0.29, 0.95] |
|
| 24 Attention Show forest plot | 2 | 39 | Std. Mean Difference (IV, Random, 95% CI) | 0.30 [‐0.34, 0.94] |
|
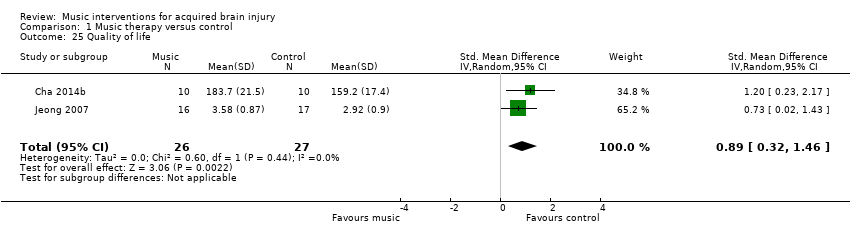
| 25 Quality of life Show forest plot | 2 | 53 | Std. Mean Difference (IV, Random, 95% CI) | 0.89 [0.32, 1.46] |
|

![Funnel plot of comparison: 1 Music therapy versus control, outcome: 1.1 Gait velocity [metres/min].](/es/cdsr/doi/10.1002/14651858.CD006787.pub3/media/CDSR/CD006787/image_n/nCD006787-AFig-FIG04.png)


![Comparison 1 Music therapy versus control, Outcome 6 Stride length (unaffected side) [metres].](/es/cdsr/doi/10.1002/14651858.CD006787.pub3/media/CDSR/CD006787/image_n/nCD006787-CMP-001-06.png)
![Comparison 1 Music therapy versus control, Outcome 7 Stride length (unspecified) [metres].](/es/cdsr/doi/10.1002/14651858.CD006787.pub3/media/CDSR/CD006787/image_n/nCD006787-CMP-001-07.png)