Heparina no fraccionada subcutánea para el tratamiento inicial de la tromboembolia venosa
Información
- DOI:
- https://doi.org/10.1002/14651858.CD006771.pub3Copiar DOI

- Base de datos:
-
- Cochrane Database of Systematic Reviews
- Versión publicada:
-
- 14 febrero 2017see what's new
- Tipo:
-
- Intervention
- Etapa:
-
- Review
- Grupo Editorial Cochrane:
-
Grupo Cochrane de Vascular
- Copyright:
-
- Copyright © 2018 The Cochrane Collaboration. Published by John Wiley & Sons, Ltd.
Cifras del artículo
Altmetric:
Citado por:
Autores
Contributions of authors
JS: selected and assessed the quality of trials for inclusion in this update, extracted and entered data for analyses, and wrote the text of the review.
LR: selected and assessed the quality of trials for inclusion in this update, extracted and entered data for analyses, and wrote the text of the review.
Sources of support
Internal sources
-
No sources of support supplied
External sources
-
Chief Scientist Office, Scottish Government Health Directorates, The Scottish Government, UK.
The Cochrane Vascular editorial base is supported by the Chief Scientist Office.
-
National Institute for Health Research (NIHR), UK.
This project was supported by the NIHR, via Cochrane Programme Grant funding Cochrane Vascular (13/89/23). The views and opinions expressed therein are those of the authors and do not necessarily reflect those of the Systematic Reviews Programme, NIHR, NHS or the Department of Health.
Declarations of interest
JS: none known.
LR: none known.
Acknowledgements
We would like to thank Dr M Vardi, Dr E Zittan, and Dr H Bitterman for their contributions to previous versions of this review.
We would like to thank Dr K Welch for searching the Cochrane Vascular Specialised Register and the Cochrane Central Register of Controlled Trials (CENTRAL) in the Cochrane Library (www.thecochranelibrary.com). We would also like to thank Dr M Stewart, Managing Editor of Cochrane Vascular for her assistance and advice in completing this review.
Version history
| Published | Title | Stage | Authors | Version |
| 2017 Feb 14 | Subcutaneous unfractionated heparin for the initial treatment of venous thromboembolism | Review | Lindsay Robertson, James Strachan | |
| 2009 Oct 07 | Subcutaneous unfractionated heparin for the initial treatment of venous thromboembolism | Review | Moshe Vardi, Eran Zittan, Haim Bitterman | |
| 2009 Jul 08 | Subcutaneous unfractionated heparin for the treatment of venous thromboembolism | Protocol | Moshe Vardi, Haim Bitterman | |
Differences between protocol and review
For this update, we amended the outcomes of the review to reflect current terminology and practice. We redefined the outcome 'treatment‐related serious adverse effects, i.e. major bleeding; overall mortality' as two events, namely 'all‐cause mortality' and 'major bleeding'. In addition, we used a more comprehensive definition of bleeding.
Notes
This Cochrane review has been marked stable and will only be updated if new studies are identified as people are moving towards LMWH and newer drugs in favour of UFH.
Keywords
MeSH
Medical Subject Headings (MeSH) Keywords
- Acute Disease;
- Anticoagulants [*administration & dosage, adverse effects];
- Heparin [*administration & dosage, adverse effects];
- Heparin, Low‐Molecular‐Weight [administration & dosage, adverse effects];
- Infusions, Intravenous;
- Injections, Subcutaneous;
- Randomized Controlled Trials as Topic;
- Recurrence;
- Venous Thromboembolism [*drug therapy];
- Venous Thrombosis [drug therapy];
Medical Subject Headings Check Words
Humans;
PICO

Study flow diagram.

Methodological quality graph: review authors' judgements about each methodological quality item presented as percentages across all included studies.
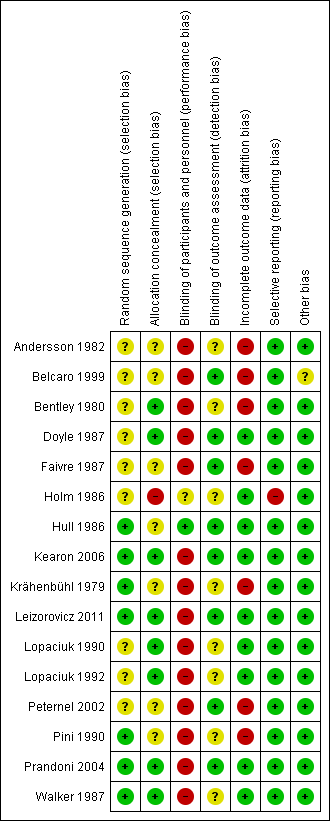
Methodological quality summary: review authors' judgements about each methodological quality item for each included study.

Comparison 1 Subcutaneous unfractionated heparin versus intravenous unfractionated heparin, Outcome 1 Symptomatic recurrent VTE at 3 months.

Comparison 1 Subcutaneous unfractionated heparin versus intravenous unfractionated heparin, Outcome 2 Symptomatic recurrent DVT at 3 months.
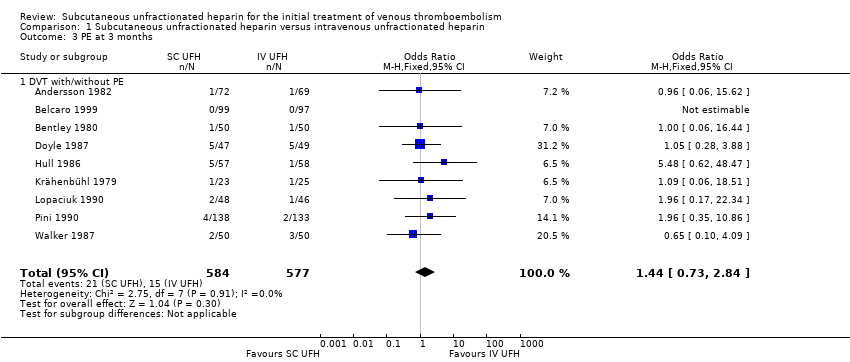
Comparison 1 Subcutaneous unfractionated heparin versus intravenous unfractionated heparin, Outcome 3 PE at 3 months.

Comparison 1 Subcutaneous unfractionated heparin versus intravenous unfractionated heparin, Outcome 4 VTE‐related mortality at 3 months.

Comparison 1 Subcutaneous unfractionated heparin versus intravenous unfractionated heparin, Outcome 5 Major bleeding.

Comparison 1 Subcutaneous unfractionated heparin versus intravenous unfractionated heparin, Outcome 6 All‐cause mortality.
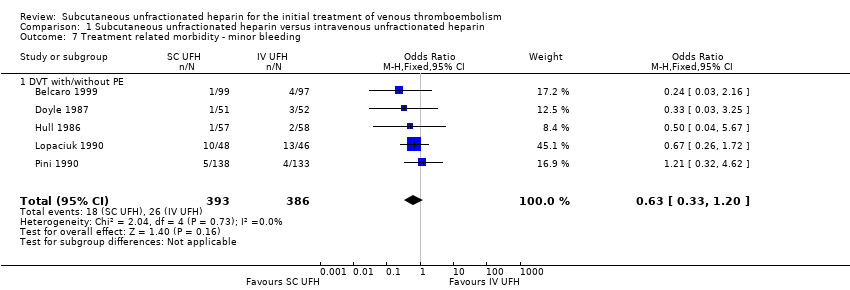
Comparison 1 Subcutaneous unfractionated heparin versus intravenous unfractionated heparin, Outcome 7 Treatment related morbidity ‐ minor bleeding.

Comparison 2 Subcutaneous unfractionated heparin versus low molecular weight heparin, Outcome 1 Symptomatic recurrent VTE at 3 months.

Comparison 2 Subcutaneous unfractionated heparin versus low molecular weight heparin, Outcome 2 Symptomatic recurrent DVT at 3 months.
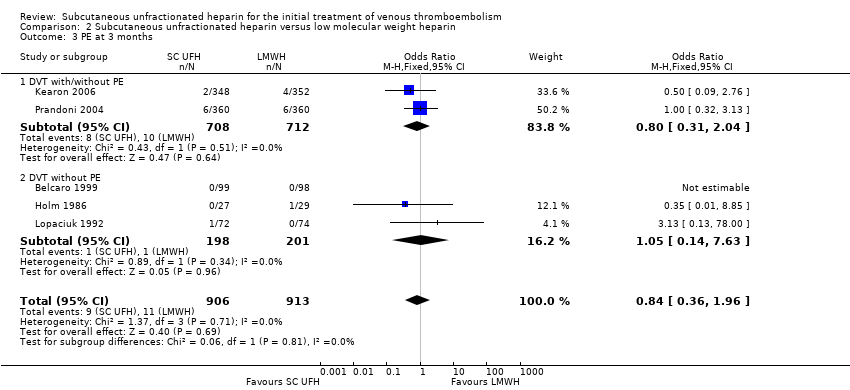
Comparison 2 Subcutaneous unfractionated heparin versus low molecular weight heparin, Outcome 3 PE at 3 months.

Comparison 2 Subcutaneous unfractionated heparin versus low molecular weight heparin, Outcome 4 VTE‐related mortality at 3 months.

Comparison 2 Subcutaneous unfractionated heparin versus low molecular weight heparin, Outcome 5 Major bleeding.
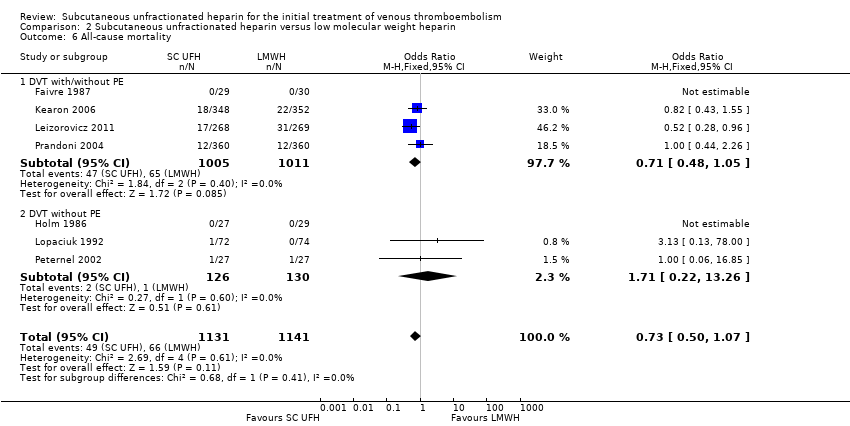
Comparison 2 Subcutaneous unfractionated heparin versus low molecular weight heparin, Outcome 6 All‐cause mortality.

Comparison 2 Subcutaneous unfractionated heparin versus low molecular weight heparin, Outcome 7 Treatment related morbidity ‐ minor bleeding.
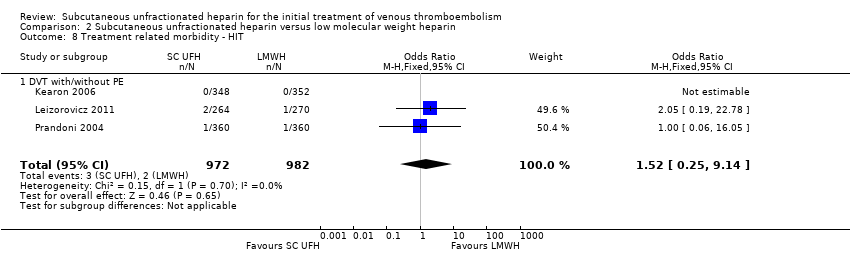
Comparison 2 Subcutaneous unfractionated heparin versus low molecular weight heparin, Outcome 8 Treatment related morbidity ‐ HIT.
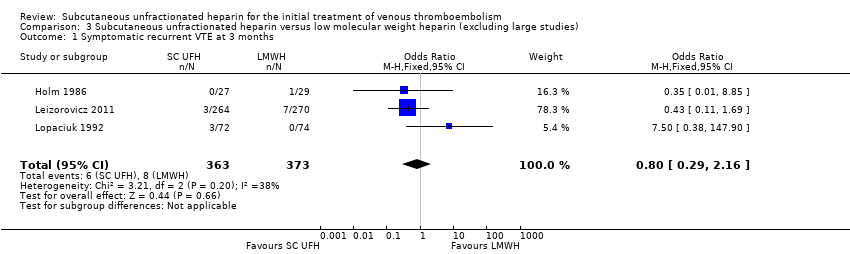
Comparison 3 Subcutaneous unfractionated heparin versus low molecular weight heparin (excluding large studies), Outcome 1 Symptomatic recurrent VTE at 3 months.

Comparison 3 Subcutaneous unfractionated heparin versus low molecular weight heparin (excluding large studies), Outcome 2 Symptomatic recurrent DVT at 3 months.
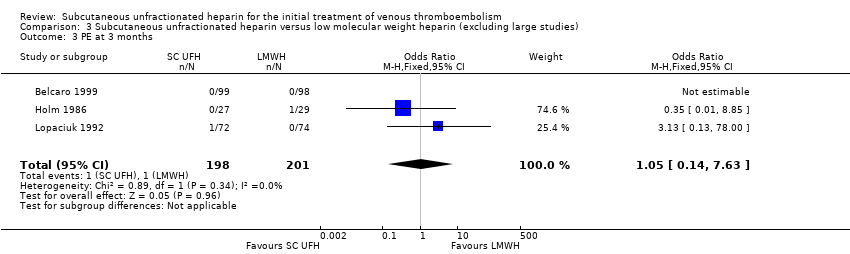
Comparison 3 Subcutaneous unfractionated heparin versus low molecular weight heparin (excluding large studies), Outcome 3 PE at 3 months.

Comparison 3 Subcutaneous unfractionated heparin versus low molecular weight heparin (excluding large studies), Outcome 4 VTE‐related mortality at 3 months.

Comparison 3 Subcutaneous unfractionated heparin versus low molecular weight heparin (excluding large studies), Outcome 5 Major bleeding.

Comparison 3 Subcutaneous unfractionated heparin versus low molecular weight heparin (excluding large studies), Outcome 6 All‐cause mortality.

Comparison 3 Subcutaneous unfractionated heparin versus low molecular weight heparin (excluding large studies), Outcome 7 Treatment‐related morbidity.
| Subcutaneous unfractionated heparin compared to intravenous unfractionated heparin for the initial treatment of venous thromboembolism | |||||
| Patient or population: people aged ≥ 18 years with a diagnosis of new or recurrent VTE | |||||
| Outcomes | Anticipated absolute effects* (95% CI) | Relative effect | Number of participants | Quality of the evidence | |
| Assumed risk | Corresponding risk | ||||
| Risk with intravenous unfractionated heparin | Risk with subcutaneous unfractionated heparin | ||||
| Symptomatic recurrent VTE at 3 months | Study population | OR 1.66 | 965 | ⊕⊕⊝⊝ | |
| 35 per 1000 | 57 per 1000 | ||||
| Symptomatic recurrent DVT at 3 months | Study population | OR 3.29 | 115 | ⊕⊕⊝⊝ | |
| 34 per 1000 | 105 per 1000 | ||||
| PE at 3 months | Study population | OR 1.44 | 1161 | ⊕⊕⊝⊝ | |
| 26 per 1000 | 37 per 1000 | ||||
| VTE‐related mortality at 3 months | Study population | OR 0.98 | 1168 | ⊕⊕⊝⊝ | |
| 3 per 1000 | 3 per 1000 | ||||
| Major bleedingd (7 days ‐ 12 months) | Study population | OR 0.91 | 583 | ⊕⊕⊝⊝ | |
| 48 per 1000 | 44 per 1000 | ||||
| All‐cause mortality (5 days to 12 months) | Study population | OR 1.74 | 972 | ⊕⊕⊝⊝ | |
| 12 per 1000 | 21 per 1000 | ||||
| Asymptomatic VTE at 3 months | No study measured this outcome | ||||
| *The basis for the assumed risk was the average risk in the intravenous unfractionated heparin group (i.e. the number of participants with events divided by total number of participants of the intravenous heparin group included in the meta‐analysis). The risk in the subcutaneous unfractionated heparin group (and its 95% confidence interval) is based on the assumed risk in the intravenous unfractionated heparin group and the relative effect of the intervention (and its 95% CI). | |||||
| GRADE Working Group grades of evidence | |||||
| aWe downgraded the quality of the evidence to low due to a high risk of performance bias in eight studies (Andersson 1982; Belcaro 1999; Bentley 1980; Doyle 1987; Krähenbühl 1979; Lopaciuk 1990; Pini 1990; Walker 1987), plus a high risk of attrition bias in five studies (Andersson 1982; Belcaro 1999; Bentley 1980; Krähenbühl 1979; Pini 1990). We also downgraded for imprecision, as reflected by the wide confidence intervals. | |||||
| Subcutaneous unfractionated heparin compared to low molecular weight heparin for the initial treatment of venous thromboembolism | |||||
| Patient or population: people aged ≥ 18 years with a diagnosis of new or recurrent VTE | |||||
| Outcomes | Anticipated absolute effects* (95% CI) | Relative effect | Number of participants | Quality of the evidence | |
| Assumed risk | Corresponding risk | ||||
| Risk with low molecular weight heparin | Risk with subcutaneous unfractionated heparin | ||||
| Symptomatic recurrent VTE at 3 months | Study population | OR 1.01 | 2156 | ⊕⊕⊝⊝ | |
| 31 per 1000 | 32 per 1000 | ||||
| Symptomatic recurrent DVT at 3 months | Study population | OR 1.38 | 1566 | ⊕⊕⊝⊝ | |
| 20 per 1000 | 28 per 1000 | ||||
| PE at 3 months | Study population | OR 0.84 | 1819 | ⊕⊕⊝⊝ | |
| 12 per 1000 | 10 per 1000 | ||||
| VTE‐related mortality at 3 months | Study population | OR 0.53 | 2469 | ⊕⊕⊝⊝ | |
| 6 per 1000 | 3 per 1000 | ||||
| Major bleedingd (3 months) | Study population | OR 0.72 | 2300 | ⊕⊕⊝⊝ | |
| 31 per 1000 | 23 per 1000 | ||||
| All‐cause mortality (7 days ‐ 3 months) | Study population | OR 0.73 | 2272 | ⊕⊕⊝⊝ | |
| 58 per 1000 | 43 per 1000 | ||||
| Asymptomatic VTE at 3 months | No study measured this outcome | ||||
| *The basis for the assumed risk was the average risk in the low molecular weight heparin group (i.e. the number of participants with events divided by total number of participants of the low molecular weight heparin group included in the meta‐analysis). The risk in the subcutaneous unfractionated heparin group (and its 95% confidence interval) is based on the assumed risk in the low molecular weight heparin group and the relative effect of the intervention (and its 95% CI). | |||||
| GRADE Working Group grades of evidence | |||||
| aWe downgraded the quality of the evidence to low due to high risk of selection and reporting bias in one study (Holm 1986), plus a high risk of performance bias in four studies (Kearon 2006; Leizorovicz 2011; Lopaciuk 1992; Prandoni 2004). We also downgraded for imprecision, as reflected by the wide confidence intervals. | |||||
| Outcome or subgroup title | No. of studies | No. of participants | Statistical method | Effect size |
| 1 Symptomatic recurrent VTE at 3 months Show forest plot | 8 | 965 | Odds Ratio (M‐H, Fixed, 95% CI) | 1.66 [0.89, 3.10] |
| 1.1 DVT with/without PE | 8 | 965 | Odds Ratio (M‐H, Fixed, 95% CI) | 1.66 [0.89, 3.10] |
| 2 Symptomatic recurrent DVT at 3 months Show forest plot | 1 | 115 | Odds Ratio (M‐H, Fixed, 95% CI) | 3.29 [0.64, 17.06] |
| 2.1 DVT with/without PE | 1 | 115 | Odds Ratio (M‐H, Fixed, 95% CI) | 3.29 [0.64, 17.06] |
| 3 PE at 3 months Show forest plot | 9 | 1161 | Odds Ratio (M‐H, Fixed, 95% CI) | 1.44 [0.73, 2.84] |
| 3.1 DVT with/without PE | 9 | 1161 | Odds Ratio (M‐H, Fixed, 95% CI) | 1.44 [0.73, 2.84] |
| 4 VTE‐related mortality at 3 months Show forest plot | 9 | 1168 | Odds Ratio (M‐H, Fixed, 95% CI) | 0.98 [0.20, 4.88] |
| 4.1 DVT with/without PE | 9 | 1168 | Odds Ratio (M‐H, Fixed, 95% CI) | 0.98 [0.20, 4.88] |
| 5 Major bleeding Show forest plot | 4 | 583 | Odds Ratio (M‐H, Fixed, 95% CI) | 0.91 [0.42, 1.97] |
| 5.1 DVT with/without PE | 4 | 583 | Odds Ratio (M‐H, Fixed, 95% CI) | 0.91 [0.42, 1.97] |
| 6 All‐cause mortality Show forest plot | 8 | 972 | Odds Ratio (M‐H, Fixed, 95% CI) | 1.74 [0.67, 4.51] |
| 6.1 DVT with/without PE | 8 | 972 | Odds Ratio (M‐H, Fixed, 95% CI) | 1.74 [0.67, 4.51] |
| 7 Treatment related morbidity ‐ minor bleeding Show forest plot | 5 | 779 | Odds Ratio (M‐H, Fixed, 95% CI) | 0.63 [0.33, 1.20] |
| 7.1 DVT with/without PE | 5 | 779 | Odds Ratio (M‐H, Fixed, 95% CI) | 0.63 [0.33, 1.20] |
| Outcome or subgroup title | No. of studies | No. of participants | Statistical method | Effect size |
| 1 Symptomatic recurrent VTE at 3 months Show forest plot | 5 | 2156 | Odds Ratio (M‐H, Fixed, 95% CI) | 1.01 [0.63, 1.63] |
| 1.1 DVT with/without PE | 3 | 1954 | Odds Ratio (M‐H, Fixed, 95% CI) | 0.95 [0.57, 1.56] |
| 1.2 DVT without PE | 2 | 202 | Odds Ratio (M‐H, Fixed, 95% CI) | 2.12 [0.38, 11.84] |
| 2 Symptomatic recurrent DVT at 3 months Show forest plot | 3 | 1566 | Odds Ratio (M‐H, Fixed, 95% CI) | 1.38 [0.73, 2.63] |
| 2.1 DVT with/without PE | 2 | 1420 | Odds Ratio (M‐H, Fixed, 95% CI) | 1.27 [0.65, 2.46] |
| 2.2 DVT without PE | 1 | 146 | Odds Ratio (M‐H, Fixed, 95% CI) | 5.28 [0.25, 111.99] |
| 3 PE at 3 months Show forest plot | 5 | 1819 | Odds Ratio (M‐H, Fixed, 95% CI) | 0.84 [0.36, 1.96] |
| 3.1 DVT with/without PE | 2 | 1420 | Odds Ratio (M‐H, Fixed, 95% CI) | 0.80 [0.31, 2.04] |
| 3.2 DVT without PE | 3 | 399 | Odds Ratio (M‐H, Fixed, 95% CI) | 1.05 [0.14, 7.63] |
| 4 VTE‐related mortality at 3 months Show forest plot | 8 | 2469 | Odds Ratio (M‐H, Fixed, 95% CI) | 0.53 [0.17, 1.67] |
| 4.1 DVT with/without PE | 4 | 2016 | Odds Ratio (M‐H, Fixed, 95% CI) | 0.53 [0.17, 1.67] |
| 4.2 DVT without PE | 4 | 453 | Odds Ratio (M‐H, Fixed, 95% CI) | 0.0 [0.0, 0.0] |
| 5 Major bleeding Show forest plot | 5 | 2300 | Odds Ratio (M‐H, Fixed, 95% CI) | 0.72 [0.43, 1.20] |
| 5.1 DVT with/without PE | 3 | 1957 | Odds Ratio (M‐H, Fixed, 95% CI) | 0.69 [0.41, 1.16] |
| 5.2 DVT without PE | 2 | 343 | Odds Ratio (M‐H, Fixed, 95% CI) | 3.13 [0.13, 78.00] |
| 6 All‐cause mortality Show forest plot | 7 | 2272 | Odds Ratio (M‐H, Fixed, 95% CI) | 0.73 [0.50, 1.07] |
| 6.1 DVT with/without PE | 4 | 2016 | Odds Ratio (M‐H, Fixed, 95% CI) | 0.71 [0.48, 1.05] |
| 6.2 DVT without PE | 3 | 256 | Odds Ratio (M‐H, Fixed, 95% CI) | 1.71 [0.22, 13.26] |
| 7 Treatment related morbidity ‐ minor bleeding Show forest plot | 5 | 2300 | Odds Ratio (M‐H, Fixed, 95% CI) | 0.98 [0.71, 1.37] |
| 7.1 DVT with/without PE | 3 | 1957 | Odds Ratio (M‐H, Fixed, 95% CI) | 0.99 [0.69, 1.43] |
| 7.2 DVT without PE | 2 | 343 | Odds Ratio (M‐H, Fixed, 95% CI) | 0.95 [0.44, 2.05] |
| 8 Treatment related morbidity ‐ HIT Show forest plot | 3 | 1954 | Odds Ratio (M‐H, Fixed, 95% CI) | 1.52 [0.25, 9.14] |
| 8.1 DVT with/without PE | 3 | 1954 | Odds Ratio (M‐H, Fixed, 95% CI) | 1.52 [0.25, 9.14] |
| Outcome or subgroup title | No. of studies | No. of participants | Statistical method | Effect size |
| 1 Symptomatic recurrent VTE at 3 months Show forest plot | 3 | 736 | Odds Ratio (M‐H, Fixed, 95% CI) | 0.80 [0.29, 2.16] |
| 2 Symptomatic recurrent DVT at 3 months Show forest plot | 1 | Odds Ratio (M‐H, Fixed, 95% CI) | Totals not selected | |
| 3 PE at 3 months Show forest plot | 3 | 399 | Odds Ratio (M‐H, Fixed, 95% CI) | 1.05 [0.14, 7.63] |
| 4 VTE‐related mortality at 3 months Show forest plot | 6 | 1049 | Odds Ratio (M‐H, Fixed, 95% CI) | 1.00 [0.06, 16.13] |
| 5 Major bleeding Show forest plot | 3 | 880 | Odds Ratio (M‐H, Fixed, 95% CI) | 0.92 [0.41, 2.09] |
| 6 All‐cause mortality Show forest plot | 5 | 852 | Odds Ratio (M‐H, Fixed, 95% CI) | 0.58 [0.32, 1.03] |
| 7 Treatment‐related morbidity Show forest plot | 3 | Odds Ratio (M‐H, Fixed, 95% CI) | Subtotals only | |
| 7.1 Minor bleeding | 3 | 880 | Odds Ratio (M‐H, Fixed, 95% CI) | 0.88 [0.60, 1.30] |
| 7.2 Heparin‐induced thrombocytopenia | 1 | 534 | Odds Ratio (M‐H, Fixed, 95% CI) | 2.05 [0.19, 22.78] |