Heparina no fraccionada subcutánea para el tratamiento inicial de la tromboembolia venosa
Resumen
Antecedentes
El tromboembolismo venoso (TEV) es una enfermedad prevalente y grave. Su tratamiento médico requiere anticoagulación, generalmente con heparina no fraccionada o de bajo peso molecular (HBPM). La administración de heparina no fraccionada (HNF) suele ser intravenosa (IV) pero también puede ser subcutánea. Ésta es una actualización de una revisión publicada por primera vez en 2009.
Objetivos
Evaluar los efectos de la HNF subcutánea frente a la HNF intravenosa, la HBPM subcutánea o cualquier otro fármaco anticoagulante para el tratamiento inicial del tromboembolismo venoso.
Métodos de búsqueda
Para esta actualización, el documentalista Vascular Cochrane realizó búsquedas en el Registro Especializado de Ensayos Controlados (última búsqueda el 30 de noviembre de 2016) y en el Registro Cochrane Central de Ensayos Controlados (Cochrane Central Register of Controlled Trials, CENTRAL) (2016, número 10). El documentalista Vascular Cochrane también buscó en los registros de ensayos los detalles de los estudios en curso o no publicados.
Criterios de selección
Ensayos controlados aleatorizados que comparan la HNF subcutánea con el control, como la HBPM subcutánea, la HNF intravenosa continua u otros fármacos anticoagulantes en participantes con tromboembolismo venoso agudo.
Obtención y análisis de los datos
Dos autores de la revisión (JS y LR) extrajeron los datos de forma independiente y evaluaron el riesgo de sesgo en los ensayos. Se utilizaron metanálisis cuando la heterogeneidad se consideró baja. Los resultados principales fueron el tromboembolismo venoso sintomático recurrente (trombosis venosa profunda y/o embolia pulmonar), la mortalidad relacionada con el TEV, los efectos adversos del tratamiento, incluida la hemorragia grave, y la mortalidad por todas las causas. Todos los resultados se calcularon mediante un odds ratio (OR) con un intervalo de confianza (IC) del 95%.
Resultados principales
Se incluyó un estudio adicional en esta actualización, con lo que el número total de estudios de la revisión asciende a 16 ensayos controlados aleatorizados, con un total de 3 593 participantes (1 745 participantes en el grupo de intervención y 1 848 participantes en el grupo de control). Ocho ensayos utilizaron la HNF intravenosa como tratamiento de control, siete ensayos utilizaron la HBPM, y un ensayo tenía tres brazos con ambos fármacos como controles. No se identificaron ensayos que compararan la HNF subcutánea con otros fármacos anticoagulantes. Se redujo la calidad de la evidencia a baja debido a la falta de cegamiento en los estudios, lo que llevó a un riesgo de sesgo de realización, y también a la imprecisión, como se refleja en los amplios intervalos de confianza.
Cuando se comparó la HNF subcutánea versus la HNF intravenosa, no hubo diferencias en la incidencia de TEV sintomático recurrente a los tres meses (odds‐ratio (OR) 1,66; intervalo de confianza (IC) del 95%: 0,89 a 3,10; 8 estudios; N = 965; evidencia de baja calidad), trombosis venosa profunda (TVP) sintomática recurrente a los tres meses (OR 3,29; IC del 95%: 0,64 a 17,06; 1 estudio; N = 115; evidencia de baja calidad), embolia pulmonar (EP) a los tres meses (OR 1.44, IC del 95%: 0,73 a 2,84; 9 estudios; N = 1161; evidencia de baja calidad), mortalidad relacionada con la TVP a tres meses (OR 0,98, IC del 95%: 0,20 a 4,88; 9 estudios; N = 1168; evidencia de baja calidad), hemorragia grave (OR 0,91, IC del 95%: 0,42 a 1,97; 4 estudios; N = 583; evidencia de baja calidad) o mortalidad por todas las causas (OR 1,74, IC del 95%: 0,67 a 4,51; 8 estudios; N = 972; evidencia de baja calidad). No se produjeron episodios de TEV asintomático en los tres meses siguientes al inicio del tratamiento.
Cuando se comparó la HNF subcutánea versus HBPM, no hubo diferencias en la incidencia de TEV recurrente a los tres meses (OR 1,01; IC del 95%: 0,63 a 1,63; 5 estudios; N = 2156; evidencia de baja calidad), TVP recurrente a los tres meses (OR 1,38; IC del 95%: 0,73 a 2,63; 3 estudios; N = 1566; evidencia de baja calidad), EP (OR 0,84; IC del 95%: 0,36 a 1.96; 5 estudios; N = 1819; evidencia de baja calidad), mortalidad relacionada con la TVP (OR 0,53; IC del 95%: 0,17 a 1,67; 8 estudios; N = 2469; evidencia de baja calidad), hemorragia grave (OR 0,72; IC del 95%: 0,43 a 1,20; 5 estudios; N = 2300; evidencia de baja calidad) o mortalidad por todas las causas (OR 0,73; IC del 95%: 0,50 a 1,07; 7 estudios; N = 2272; evidencia de baja calidad). No se produjeron episodios de TEV asintomático en los tres meses siguientes al inicio del tratamiento.
Conclusiones de los autores
No hay evidencia de que exista una diferencia entre la HNF subcutánea y la intravenosa para prevenir la recurrencia del TEV, la mortalidad relacionada con el TEV o la mortalidad por todas las causas y la hemorragia grave. Según los criterios de GRADE, la calidad de la evidencia era baja. Tampoco hay evidencia de que exista una diferencia entre la HNF subcutánea y la HBPM para prevenir la recurrencia del TEV, la mortalidad relacionada con el TEV o la mortalidad por todas las causas o las hemorragias graves.
PICOs
Resumen en términos sencillos
Heparina no fraccionada subcutánea para el tratamiento inicial de la tromboembolia venosa
Antecedentes
El tromboembolismo venoso (TEV) es una enfermedad en la que se forma un coágulo de sangre en las venas profundas (más comúnmente en la pierna) y puede viajar hacia arriba para bloquear las arterias de los pulmones (una condición que pone en peligro la vida conocida como embolia pulmonar). El tratamiento del TEV requiere inyecciones de un fármaco llamada heparina, que evita que se formen más coágulos. La heparina se presenta en dos formas: heparina no fraccionada (HNF) y heparina de bajo peso molecular (HBPM). La HNF puede administrarse como una infusión intravenosa continua (IV) o intermitentemente como una inyección bajo la piel (subcutánea), mientras que la HBPM se inyecta subcutáneamente. Esta revisión mide los efectos de la HNF subcutánea versus la HNF IV y la HBPM para la prevención de coágulos recurrentes, la mortalidad y las hemorragias graves. Ésta es una actualización de una revisión publicada en 2009.
Resultados clave
Después de buscar estudios relevantes hasta noviembre de 2016, se encontró un estudio para añadir a esta actualización. En total, se incluyeron 16 ensayos controlados aleatorizados en 3.593 participantes en esta revisión. Esta actualización mostró que no había evidencia de una diferencia entre la HNF subcutánea versus la HNF intravenosa o la HBPM subcutánea para la prevención de coágulos recurrentes, muerte o hemorragias graves.
Calidad de la evidencia
La calidad de la evidencia fue baja debido a la falta de cegamiento en los estudios incluidos y a la imprecisión de los resultados debido al pequeño número de eventos notificados.
Authors' conclusions
Summary of findings
| Subcutaneous unfractionated heparin compared to intravenous unfractionated heparin for the initial treatment of venous thromboembolism | |||||
| Patient or population: people aged ≥ 18 years with a diagnosis of new or recurrent VTE | |||||
| Outcomes | Anticipated absolute effects* (95% CI) | Relative effect | Number of participants | Quality of the evidence | |
| Assumed risk | Corresponding risk | ||||
| Risk with intravenous unfractionated heparin | Risk with subcutaneous unfractionated heparin | ||||
| Symptomatic recurrent VTE at 3 months | Study population | OR 1.66 | 965 | ⊕⊕⊝⊝ | |
| 35 per 1000 | 57 per 1000 | ||||
| Symptomatic recurrent DVT at 3 months | Study population | OR 3.29 | 115 | ⊕⊕⊝⊝ | |
| 34 per 1000 | 105 per 1000 | ||||
| PE at 3 months | Study population | OR 1.44 | 1161 | ⊕⊕⊝⊝ | |
| 26 per 1000 | 37 per 1000 | ||||
| VTE‐related mortality at 3 months | Study population | OR 0.98 | 1168 | ⊕⊕⊝⊝ | |
| 3 per 1000 | 3 per 1000 | ||||
| Major bleedingd (7 days ‐ 12 months) | Study population | OR 0.91 | 583 | ⊕⊕⊝⊝ | |
| 48 per 1000 | 44 per 1000 | ||||
| All‐cause mortality (5 days to 12 months) | Study population | OR 1.74 | 972 | ⊕⊕⊝⊝ | |
| 12 per 1000 | 21 per 1000 | ||||
| Asymptomatic VTE at 3 months | No study measured this outcome | ||||
| *The basis for the assumed risk was the average risk in the intravenous unfractionated heparin group (i.e. the number of participants with events divided by total number of participants of the intravenous heparin group included in the meta‐analysis). The risk in the subcutaneous unfractionated heparin group (and its 95% confidence interval) is based on the assumed risk in the intravenous unfractionated heparin group and the relative effect of the intervention (and its 95% CI). | |||||
| GRADE Working Group grades of evidence | |||||
| aWe downgraded the quality of the evidence to low due to a high risk of performance bias in eight studies (Andersson 1982; Belcaro 1999; Bentley 1980; Doyle 1987; Krähenbühl 1979; Lopaciuk 1990; Pini 1990; Walker 1987), plus a high risk of attrition bias in five studies (Andersson 1982; Belcaro 1999; Bentley 1980; Krähenbühl 1979; Pini 1990). We also downgraded for imprecision, as reflected by the wide confidence intervals. | |||||
| Subcutaneous unfractionated heparin compared to low molecular weight heparin for the initial treatment of venous thromboembolism | |||||
| Patient or population: people aged ≥ 18 years with a diagnosis of new or recurrent VTE | |||||
| Outcomes | Anticipated absolute effects* (95% CI) | Relative effect | Number of participants | Quality of the evidence | |
| Assumed risk | Corresponding risk | ||||
| Risk with low molecular weight heparin | Risk with subcutaneous unfractionated heparin | ||||
| Symptomatic recurrent VTE at 3 months | Study population | OR 1.01 | 2156 | ⊕⊕⊝⊝ | |
| 31 per 1000 | 32 per 1000 | ||||
| Symptomatic recurrent DVT at 3 months | Study population | OR 1.38 | 1566 | ⊕⊕⊝⊝ | |
| 20 per 1000 | 28 per 1000 | ||||
| PE at 3 months | Study population | OR 0.84 | 1819 | ⊕⊕⊝⊝ | |
| 12 per 1000 | 10 per 1000 | ||||
| VTE‐related mortality at 3 months | Study population | OR 0.53 | 2469 | ⊕⊕⊝⊝ | |
| 6 per 1000 | 3 per 1000 | ||||
| Major bleedingd (3 months) | Study population | OR 0.72 | 2300 | ⊕⊕⊝⊝ | |
| 31 per 1000 | 23 per 1000 | ||||
| All‐cause mortality (7 days ‐ 3 months) | Study population | OR 0.73 | 2272 | ⊕⊕⊝⊝ | |
| 58 per 1000 | 43 per 1000 | ||||
| Asymptomatic VTE at 3 months | No study measured this outcome | ||||
| *The basis for the assumed risk was the average risk in the low molecular weight heparin group (i.e. the number of participants with events divided by total number of participants of the low molecular weight heparin group included in the meta‐analysis). The risk in the subcutaneous unfractionated heparin group (and its 95% confidence interval) is based on the assumed risk in the low molecular weight heparin group and the relative effect of the intervention (and its 95% CI). | |||||
| GRADE Working Group grades of evidence | |||||
| aWe downgraded the quality of the evidence to low due to high risk of selection and reporting bias in one study (Holm 1986), plus a high risk of performance bias in four studies (Kearon 2006; Leizorovicz 2011; Lopaciuk 1992; Prandoni 2004). We also downgraded for imprecision, as reflected by the wide confidence intervals. | |||||
Background
Description of the condition
Venous thromboembolism (VTE) describes the formation of thrombus in the deep veins, most commonly in the legs (deep vein thrombosis, or DVT). VTE may also refer to the subsequent embolisation of all or part of the thrombus to the pulmonary circulation (pulmonary embolism, or PE). DVT of the lower limbs may be associated with localised pain, swelling and erythema as well as the development of pulmonary emboli and the later occurrence of post‐thrombotic syndrome (persistent swelling, erythema and ulceration). PE presents acutely with shortness of breath, pain on inspiration, tachycardia and right heart overload, and if untreated, it can lead to chronic thromboembolic pulmonary hypertension, acute circulatory collapse and death. Increasingly, in the era of more liberal central venous catheterisation, DVT may involve the upper extremities. Rarely, it may also affect other venous circulation (cerebral veins, portal and mesenteric veins, etc.).
In addition to DVT and PE, thrombus can also form in the superficial veins, where it is associated with local pain and inflammation (superficial venous thrombosis). This tends to be associated with lower mortality and morbidity rates than DVT, although some patients may be at a higher risk of DVT formation depending on the location of the clot (Chengelis 1996; Nasr 2015).
Venous thromboembolism (VTE) is comprised of DVT and PE and can occur spontaneously. However, there are many risk factors for VTE, including periods of inactivity, dehydration, hospitalisation, trauma, clotting disorders and previous thrombosis, varicose veins with phlebitis, pregnancy, oral combined hormonal contraceptives, malignancy, obesity, smoking, and age (Anderson 2003; NICE 2010).
The incidence of VTE in mostly white populations is between 100 and 200 per 100,000 person‐years (Heit 2015; White 2003). Of these, it is estimated that 45 to 117 cases per 100,000 person‐years are due to DVT (without PE), and 29 to 78 are due to PE (with or without DVT) (Heit 2015). Recurrent VTE occurs in approximately 7.4% of patients at 1 year and up to 30.4% of patients by 10 years (Cushman 2007; Heit 2015; White 2003).
Description of the intervention
Heparin is a heterogeneous mixture of branched glycosaminoglycans (GAG), discovered in 1916 (McLean 1916).
The anticoagulant action of heparin requires the binding of antithrombin (AT). Heparin binds to AT through a unique glucosamine unit that is contained within a pentasaccharide sequence present in a fraction of the GAG molecules. Currently, three therapeutic heparin preparations are available for clinical use: unfractionated heparin (UFH) with a molecular weight of approximately 15,000 daltons; its derivative low molecular weight heparin (LMWH), with an average molecular weight of 4000 to 5000 daltons; and the significantly more expensive pentasaccharide. Although LMWH has largely replaced UFH in the setting of acute VTE treatment, many people do not benefit from its use due to increased risk of complications, specifically bleeding in patients with severe renal failure.
How the intervention might work
Complications of heparin use may include bleeding; heparin‐induced thrombocytopenia (HIT); and in the long term, heparin‐induced osteoporosis. Consequently, it is important to monitor coagulation factors, specifically the activated partial thromboplastin time (aPTT), when using UFH. There are two preferred modes of administering this treatment: a continuous intravenous (IV) mode and an intermittent subcutaneous mode. Depending on the method chosen, pharmacokinetic analyses demonstrate differences in heparin bioavailability and early achievement of a therapeutic aPTT goal, favouring the intravenous route (Hull 1986).
Nevertheless, investigators have evaluated the subcutaneous route of administration for VTE due to its ease of application, early mobilisation and hospital discharge, and presumably less line‐related complications. People have received the treatment either in weight‐adjusted or aPTT‐adjusted doses, and investigators have compared results with other available treatment modalities.
Why it is important to do this review
Two meta‐analyses comparing LMWH versus intravenous UFH have shown LMWH to be non‐inferior to UFH with regards to recurrent DVT, PE, bleeding and thrombocytopenia (reduction in the number of platelets) (Dolovich 2000; Quinlan 2004). However, there were no trials utilising subcutaneous UFH for this indication in these analyses. The present review was originally completed in 2009 (Vardi 2009), and an update is necessary to incorporate evidence from any new studies completed since then. Additionally, Cochrane has developed new methodology during that time that should be incorporated in the updated review.
Objectives
To assess the effects of subcutaneous UFH versus intravenous UFH, subcutaneous LMWH or any other anticoagulant drug for the initial treatment of venous thromboembolism.
Methods
Criteria for considering studies for this review
Types of studies
Randomised controlled trials comparing the effects of subcutaneous UFH versus intravenous UFH, LMWH or any other anticoagulant drug for the initial treatment of venous thromboembolism. We included trials with more than two treatment groups and analysed them accordingly. We did not expect to find any cross‐over trials in the setting of VTE. We included trials with interventions and follow‐up periods of any duration.
We excluded randomised controlled trials without truly random allocation to the treatment or control group or without allocation concealment, in view of the fact that prior knowledge of treatment allocation may have led to biased participant allocation, treatment or reporting. After allocation, further concealment of treatment may be impossible due to the differences between preparations and routes of administration. Thus, despite recognising that this may lead to biased treatment or reporting, post‐allocation blinding was not a prerequisite, and we addressed it in a sensitivity analysis.
We acknowledge that non‐randomised studies or studies using other randomisation methods (for example cluster randomisation) may provide useful information about this problem. However, for this review, we did not consider such studies.
Types of participants
Adults (aged 18 years or older) with a diagnosis of new or recurrent VTE. Ideally, the diagnosis of DVT of the leg was made with the use of compression ultrasonography, colour‐coded duplex ultrasonography or contrast venography, and the diagnosis of PE with high probability ventilation‐perfusion scan or pulmonary arterial filling defects on computed tomography or invasive angiography.
Types of interventions
Initial treatment with subcutaneous UFH for individuals with VTE, administered at any regimen, in trials of any duration.
-
Subcutaneous UFH:
-
fixed weight‐adjusted dose;
-
aPTT‐adjusted dose.
-
-
Other treatment modalities:
-
intravenous UFH;
-
subcutaneous LMWH;
-
other.
-
We expected studies to administer supplementary treatment of VTE with an oral anticoagulant titration. We considered its use in a subgroup analysis.
Types of outcome measures
Primary outcomes
-
Incidence of symptomatic recurrent VTE at three months
-
Incidence of symptomatic recurrent DVT at three months
-
PE at three months
-
VTE‐related mortality at three months
-
Major bleeding (as defined by the International Society on Thrombosis and Haemostasis (ISTH) (Schulman 2005): fatal bleeding; symptomatic bleeding in a critical area or organ, such as intracranial, intraspinal, intraocular, retroperitoneal, intra‐articular or pericardial, or intramuscular with compartment syndrome; bleeding causing a fall in haemoglobin level of 20 g/L (1.24 mmol/L) or more, or leading to transfusion of two or more units of whole blood or red cells; any combination of the above)
-
All‐cause mortality
Secondary outcomes
-
Incidence of asymptomatic VTE at three months
-
Treatment‐related morbidity: minor bleeding (bleeding that is clinically overt but not meeting the definition of serious bleeding provided by the ISTH) and heparin‐induced thrombocytopenia
-
Length of hospital stay
-
Quality of life
Search methods for identification of studies
We did not restrict the search for eligible studies by language.
Electronic searches
For this update, the Cochrane Vascular Information Specialist (CIS) searched the following databases for relevant trials.
-
Cochrane Vascular Specialised Register (30 November 2016).
-
Cochrane Central Register of Controlled Trials (CENTRAL; 2016, Issue 10) via the Cochrane Register of Studies Online.
See Appendix 1 for details of the search strategy used for CENTRAL.
The Cochrane Vascular Specialised Register is maintained by the CIS and is constructed from weekly electronic searches of MEDLINE Ovid, Embase Ovid, CINAHL, AMED, and through handsearches of relevant journals. The full list of the databases, journals and conference proceedings included in these searches, as well as the search strategies used, are described in the Specialised Register section of the Cochrane Vascular module in the Cochrane Library (www.cochranelibrary.com).
The CIS searched the following trial registries for details of ongoing and unpublished studies.
-
ClinicalTrials.gov (www.clinicaltrials.gov).
-
World Health Organization International Clinical Trials Registry Platform (www.who.int/trialsearch).
-
ISRCTN Register (www.isrctn.com/).
See Appendix 2 for details of the search strategies.
Searching other resources
We handsearched the reference lists of relevant trials and reviews identified for additional studies.
Data collection and analysis
Selection of studies
For this update, two review authors (JS, LR) independently scanned the titles, abstracts and keywords of every record retrieved. We retrieved full articles for further assessment if the information given suggested that the study fulfilled the inclusion criteria and did not meet the exclusion criteria. If there was any doubt regarding these criteria based on the title and abstract, we retrieved the full article for clarification.
Data extraction and management
For studies that fulfilled the inclusion criteria, we abstracted relevant population and intervention characteristics using standard data extraction templates. For details, see Characteristics of included studies and Appendix 3 (Additional study information). We resolved disagreements by discussion.
For this update, two review authors (JS, LR) extracted the following data.
-
General information: author, title, publication (published/unpublished; duplicate/multiple publication), language of publication, year of publication, country, complete reference or source, contact details, rural or urban setting, single centre versus multicentre, setting, stated aim of the study, sponsor, ethics committee approval and description of conflict of interests.
-
Trial design: prospective study, control group, parallel study, placebo controlled, active‐medication controlled, use of cross‐over design (and if so, description of run‐in period, wash‐out period and carry‐over effect described), description of period effect, sampling method and power calculation, selection bias (randomisation, unit of randomisation and allocation concealment adequacy), performance bias (blinding of participants and caregivers, method of blinding, check of blinding, check of blinding method), attrition bias (intention‐to‐treat analysis, description of withdrawals, drop‐outs description and losses to follow‐up, change of groups (if cross‐overs), number of dropouts and withdrawals and loss to follow‐up, reasons and description for dropouts, withdrawals or losses to follow‐up), and detection bias (blinding of outcome assessors), overall quality assessment, definition of inclusion criteria, definition of exclusion criteria,, and specified subgroups (predefined and defined post hoc).
-
Participants: venous thromboembolism (VTE) diagnostic criteria description, VTE diagnostic criteria validity,, baseline characteristics (i.e. number of participants, age, sex, race, body mass index, comorbidities, concomitant medications, identical treatment of groups (apart from intervention)).
-
Intervention: dose adjustment for subcutaneous UFH (weight‐adjusted or aPTT‐adjusted), bolus intravenous heparin in subcutaneous arm, number of daily subcutaneous doses, daily heparin cumulative dose, duration of heparin therapy (days), warfarin dose, length of follow‐up, compliance.
-
Outcomes assessed for short, intermediate and long term as defined above: incidence of symptomatic recurrent deep vein thrombosis (DVT) or pulmonary embolism (PE), mortality related to propagation of VTE, treatment‐related mortality during heparin treatment, incidence of asymptomatic propagation of VTE, treatment‐related morbidity during heparin treatment (major bleeding, minor bleeding, heparin‐induced thrombocytopenia (HIT), other), length of hospital stay, quality of life.
-
Effect modifiers: compliance, change of concomitant medication, warfarin therapy.
We sought any relevant missing information on the trials from the original author(s) of the article, if required.
Assessment of risk of bias in included studies
Two review authors (JS, LR) independently used the Cochrane 'Risk of bias' tool to assess the risk of bias for each of the included studies (Higgins 2011). The tool provides a protocol for judgements on sequence generation, allocation methods, blinding of participants, investigators and outcome assessors, incomplete outcome data, selective outcome reporting and any other relevant biases. We judged each of these domains as being at either high, low or unclear risk of bias according to Higgins 2011 and provided support for each judgement, resolving any disagreements by discussion. We present the conclusions in a 'Risk of bias' table.
Measures of treatment effect
We based the analysis on intention‐to‐treat data from the individual clinical trials. For the primary and secondary outcomes, which are binary measures, we computed odds ratios (ORs) using a fixed‐effect model and calculated the 95% confidence intervals (CI) of the effect sizes. For the continuous outcomes such as length of hospital stay and quality of life, we planned to use mean differences (MDs) with 95% CIs where the scales were the same, and where scales were different but the outcome was the same, we planned to use the standardised mean difference (SMD) with 95% CIs.
Unit of analysis issues
The unit of analysis was the individual participant.
Dealing with missing data
We sought relevant missing data from authors where necessary and feasible. We carefully evaluated important numerical data such as screened, eligible and randomised participants as well as intention‐to‐treat and per‐protocol population. We investigated dropouts, losses to follow‐up and withdrawn study participants.
Assessment of heterogeneity
We assessed heterogeneity between the trials by visual examination of the forest plot to check for overlapping CIs, the Chi2 test for homogeneity with a 10% level of significance and the I2 statistic to measure the degree of inconsistency between the studies. An I2 result of greater than 50% may represent moderate to substantial heterogeneity (Deeks 2011).
Assessment of reporting biases
We planned to assess publication bias by funnel plots if a sufficient number of studies (10 or more) were available in the meta‐analyses. There are many reasons for funnel plot asymmetry, and we planned to consult the Cochrane Handbook for Systematic Reviews of Interventions to aid the interpretation of the results (Sterne 2011).
Data synthesis
The review authors independently extracted the data. One review author (LR) entered the data into Review Manager 5 (RevMan 2014), and the second review author (JS) cross‐checked data entry. We resolved any discrepancies by consulting the source publication.
If data were available, sufficiently similar and of sufficient quality, we provided a statistical summary. We used a fixed‐effect model to meta‐analyse the data. If the I2 statistic indicated heterogeneity greater than 50%, we performed a random‐effects model analysis instead.
Subgroup analysis and investigation of heterogeneity
We planned to perform subgroup analyses, according to the following clinically logical pre‐defined groups.
-
Participants.
-
VTE at randomisation: DVT with/without PE versus DVT without PE versus PE without DVT.
-
VTE: first versus recurrent.
-
Severity: haemodynamically stable versus unstable, respiratory stable versus unstable.
-
Age.
-
Renal function.
-
Underlying pathology (e.g. orthopaedic patients).
-
-
Intervention.
-
Number of daily subcutaneous heparin injections.
-
Type of dose adjustment; weight‐adjusted versus aPTT‐adjusted.
-
Initial intravenous bolus heparin given versus not given.
-
Concomitant oral anticoagulant use.
-
Timing of oral anticoagulant initiation.
-
We performed neither a dose‐response analysis nor any indirect comparisons between groups not directly evaluated head‐to‐head in a clinical trial.
Sensitivity analysis
We planned to perform sensitivity analyses in order to explore the influence of the following factors on effect size, repeating the analysis by:
-
excluding data from unpublished studies;
-
taking account of study quality, as specified above;
-
excluding any very long or large studies to establish how much they dominated the results;
-
excluding studies using the following filters: diagnostic criteria, language of publication, source of funding (industry versus other), country.
Summary of findings table
We presented the main findings of the review results in a 'Summary of findings' table, reporting the quality of evidence (according to Atkins 2004), the magnitude of effect of the interventions examined, and the sum of available data on symptomatic recurrent VTE at three months, symptomatic recurrent DVT at three months, PE at three months, VTE‐related mortality at three months, major bleeding, all‐cause mortality and asymptomatic VTE at three months, . We used the GRADEpro software to assist in the preparation of the 'Summary of findings' table (GRADEpro GDT).
Results
Description of studies
Results of the search
See Figure 1.
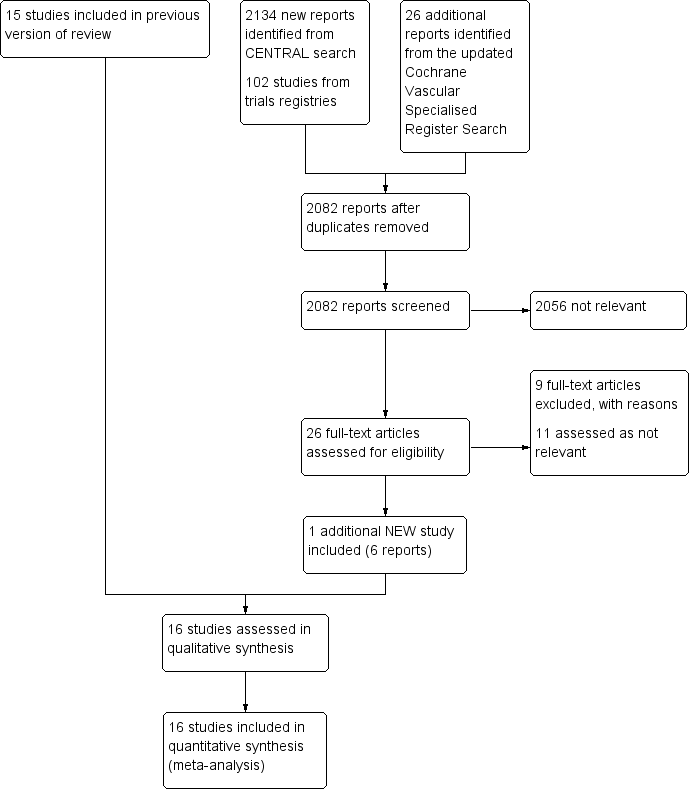
Study flow diagram.
Included studies
For this update, we identified one additional study that met the inclusion criteria for this review (Leizorovicz 2011), bringing the total number of included studies to 16 randomised controlled trials, involving 3593 participants (Andersson 1982; Belcaro 1999; Bentley 1980; Doyle 1987; Faivre 1987; Holm 1986; Hull 1986; Kearon 2006; Krähenbühl 1979; Leizorovicz 2011; Lopaciuk 1990; Lopaciuk 1992; Peternel 2002; Pini 1990; Prandoni 2004; Walker 1987). For detailed descriptions see Characteristics of included studies and Appendix 3.
Eight studies compared subcutaneous UFH versus intravenous UFH (Andersson 1982; Bentley 1980; Doyle 1987; Hull 1986; Krähenbühl 1979; Lopaciuk 1990; Pini 1990; Walker 1987), seven studies compared subcutaneous UFH versus LMWH (Faivre 1987; Holm 1986; Kearon 2006; Leizorovicz 2011; Lopaciuk 1992; Peternel 2002; Prandoni 2004), and one study compared subcutaneous UFH to both intravenous UFH and subcutaneous LMWH (Belcaro 1999).. For the long‐term treatment, nine studies utilised warfarin, three used acenocoumarol, and one used subcutaneous UFH. In three studies, the long‐term management was not clear. Thirteen trials monitored the subcutaneous heparin dose through aPTT measurements and one through anti‐factor Xa (anti‐Xa) measurements, while in two studies the subcutaneous heparin dose was fixed or based solely on weight.
Fourteen studies took place in an inpatient setting (Andersson 1982; Bentley 1980; Doyle 1987; Faivre 1987; Holm 1986; Hull 1986; Krähenbühl 1979; Leizorovicz 2011; Lopaciuk 1990; Lopaciuk 1992; Peternel 2002; Pini 1990; Prandoni 2004; Walker 1987), and two in both inpatient and outpatient settings (Belcaro 1999; Kearon 2006). All trials included participants with DVT. Four trials allowed for participants with PE in their inclusion criteria (Faivre 1987; Kearon 2006; Leizorovicz 2011; Prandoni 2004). Four trials excluded people with PE (Doyle 1987; Holm 1986; Peternel 2002; Walker 1987), and an additional two trials excluded people with massive PE (Faivre 1987; Lopaciuk 1990). The remaining trials did not clearly describe PE inclusion. We did not identify any trials that included only participants with PE. Studies recruited participants upon diagnosis of VTE and randomised them to treatment groups. Eight of the included studies administered an initial intravenous heparin bolus prior to initiating subcutaneous heparin treatment (Andersson 1982; Hull 1986; Krähenbühl 1979; Leizorovicz 2011; Lopaciuk 1990; Lopaciuk 1992; Peternel 2002; Prandoni 2004). One study maintained the infusion for 24 hours before the first subcutaneous administration (Holm 1986). The duration of the intervention ranged from a minimum of seven days to achievement of international normalised ratio (INR) target level for oral anticoagulation in all included trials apart from one, which administered subcutaneous heparin for three months (Belcaro 1999). Diagnostic modalities for DVT included venous occlusion plethysmography, thermography, phlebography, venography, and colour‐duplex sonography; as well as lung scan or CT‐angiography for PE. Follow‐up length was as long as the intervention duration in eight studies and three months in seven studies (Belcaro 1999; Doyle 1987; Hull 1986; Kearon 2006; Lopaciuk 1990; Lopaciuk 1992; Prandoni 2004). One study reported death rate at 12 months (Doyle 1987). One study was terminated early, as an interim safety analysis revealed an excess mortality rate in the subcutaneous heparin group (Leizorovicz 2011).
Excluded studies
After careful evaluation of the full publications, we excluded nine additional studies from this update (Nakamura 2010; NCT01956955; Quiros 2001; Riess 2014; Rodgers 1999; Romera 2009; Ucar 2015; Van Doormaal 2009; Van Doormaal 2010), for a total number of 16 excluded studies. The main reasons for exclusion were the method of administration of heparin and involvement of thrombolysis or VTE prophylaxis. For further details see Characteristics of excluded studies.
Risk of bias in included studies
For details on methodological quality of included studies, see Figure 2 and Figure 3.

Methodological quality graph: review authors' judgements about each methodological quality item presented as percentages across all included studies.
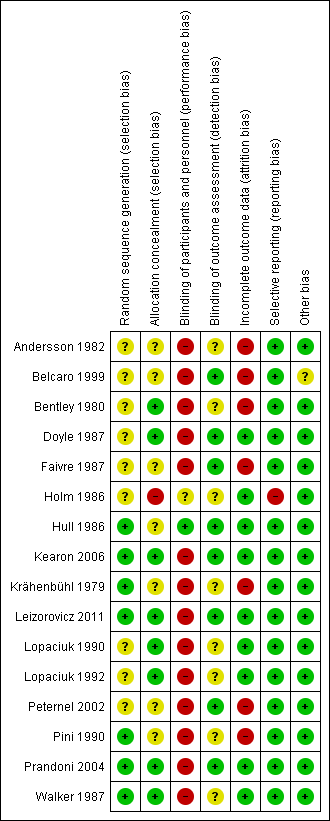
Methodological quality summary: review authors' judgements about each methodological quality item for each included study.
Allocation
Five studies described the use of computer‐generated random sequences (Hull 1986; Kearon 2006; Leizorovicz 2011; Pini 1990; Prandoni 2004), one study described 'drawing of lots' (Krähenbühl 1979), and another study described the use of a random number table to allocate participants to treatment groups (Walker 1987). We therefore deemed these seven studies to be at low risk of selection bias. All other studies stated that they randomised participants but did not provide a clear description of random sequence generation, so we considered them to be at unclear risk of selection bias (Andersson 1982; Belcaro 1999; Bentley 1980; Doyle 1987; Faivre 1987; Holm 1986; Lopaciuk 1990; Lopaciuk 1992; Peternel 2002).
We judged eight studies to be at low risk of selection bias due to allocation concealment (Bentley 1980; Doyle 1987; Kearon 2006; Leizorovicz 2011; Lopaciuk 1990; Lopaciuk 1992; Prandoni 2004; Walker 1987). Five of these studies described the use of 'sealed envelopes' to maintain allocation concealment (Bentley 1980; Doyle 1987; Lopaciuk 1990; Lopaciuk 1992; Walker 1987). The Cochrane Handbook for Systematic Reviews of Interventions states that allocation concealment should be achieved through sequentially numbered, opaque, sealed envelopes, opened only after irreversible assignment to a participant. However, due to the age of the studies included in this review, we decided that studies describing the use of envelopes to maintain allocation concealment would be at lower risk of selection bias than those that did not and that we would deem them to be at low risk. Three studies described the use of central telephone randomisation (Kearon 2006; Leizorovicz 2011; Prandoni 2004). Leizorovicz 2011 specifically stated that "no allocation concealment mechanism was attempted as the study was open"; however, we still considered the study to be at low risk of selection bias, as this statement appeared to contradict the description of "central telephone randomisation". We therefore assumed that the authors were referring to the blinding of participants and personnel as "allocation concealment". Furthermore, authors also stated that "care was taken to ensure that outcome assessors and data analysts were kept blinded to the allocation".
We judged Holm 1986 to be at high risk of selection bias due to allocation concealment. Authors stated that participants' allocations to treatment groups depended on the order of participant admission: "the vials [of low molecular weight or unfractionated heparin] had been randomised in advance and numbered consecutively, the number of patient admission determining the number of vial used". As personnel potentially had knowledge of the order of the vials – allowing them to control the composition of the treatment groups by manipulating the order of participant admission – we deemed this study to be at high risk of selection bias.
No other studies provided descriptions of allocation concealment, so we deemed them to be at unclear risk for allocation concealment (Andersson 1982; Belcaro 1999; Faivre 1987; Hull 1986; Krähenbühl 1979; Peternel 2002; Pini 1990).
Blinding
Only one study adequately reported the blinding of participants and personnel, so we considered it as being at low risk of performance bias (Hull 1986). One study reported that it was "double‐blind" but did not provide any further information, so we assessed it as being at unclear risk (Holm 1986). The remaining fourteen studies were not blinded, so we considered them to be at high risk of performance bias (Andersson 1982; Belcaro 1999; Bentley 1980; Doyle 1987; Faivre 1987; Kearon 2006; Krähenbühl 1979; Leizorovicz 2011; Lopaciuk 1990; Lopaciuk 1992; Peternel 2002; Pini 1990; Prandoni 2004; Walker 1987).
For measuring the risk of detection bias, we decided that due to the subjective nature of certain criteria, we would rate studies as being at high risk of detection bias if they did not adequately blind for the following outcomes: recurrent VTE at three months; recurrent DVT at three months; PE – excluding PE found at autopsy; incidence of asymptomatic VTE at three months; quality of life; and incidence of HIT. However, we thought that VTE‐related mortality at three months, all‐cause mortality and major and minor bleeding (if they followed the definition provided by the International Society on Thrombosis and Haemostasis) were objective enough to not require blinding.
In total, we judged eight studies to be at low risk of detection bias (Belcaro 1999; Doyle 1987; Faivre 1987; Hull 1986; Kearon 2006; Leizorovicz 2011; Peternel 2002; Prandoni 2004). Two studies were only included in the analysis of VTE‐related mortality at three months and all‐cause mortality, so we automatically deemed them to be at low risk of detection bias (Faivre 1987; Peternel 2002), while six studies adequately blinded for all six subjective outcomes (Belcaro 1999; Doyle 1987; Hull 1986; Kearon 2006; Leizorovicz 2011; Prandoni 2004). The remaining eight studies did not state whether personnel assessing suspected PE were adequately blinded, so we deemed them to be at unclear risk of detection bias (Andersson 1982; Bentley 1980; Holm 1986; Krähenbühl 1979; Lopaciuk 1990; Lopaciuk 1992; Pini 1990; Walker 1987).
Incomplete outcome data
Nine studies adequately accounted for all missing data, and we judged them to be at low risk of attrition bias (Doyle 1987; Holm 1986; Hull 1986; Kearon 2006; Leizorovicz 2011; Lopaciuk 1990; Lopaciuk 1992; Prandoni 2004; Walker 1987). The remaining seven studies did not adequately deal with missing data, so we deemed them to be at high risk of attrition bias (Andersson 1982; Belcaro 1999; Bentley 1980; Faivre 1987; Krähenbühl 1979; Peternel 2002; Pini 1990).
Selective reporting
Due to the age of the studies included in the review, there was only one available protocol for an included study (Kearon 2006). We therefore based our judgements of selective reporting solely on the reporting of pre‐specified outcomes in the Methods sections. Fifteen papers reported on all pre‐specified outcomes, and we deemed them to be at low risk of reporting bias (Andersson 1982; Belcaro 1999; Bentley 1980; Doyle 1987; Faivre 1987; Hull 1986; Kearon 2006; Krähenbühl 1979; Leizorovicz 2011; Lopaciuk 1990; Lopaciuk 1992; Peternel 2002; Pini 1990; Prandoni 2004; Walker 1987). We considered one study to be at high risk of reporting bias, as authors presented results for leg pain but did not present the method of measuring pain in the Methods section (Holm 1986).
Other potential sources of bias
We rated 15 studies as being at low risk of other bias (Andersson 1982; Bentley 1980; Doyle 1987; Faivre 1987; Holm 1986; Hull 1986; Kearon 2006; Krähenbühl 1979; Leizorovicz 2011; Lopaciuk 1990; Lopaciuk 1992; Peternel 2002; Pini 1990; Prandoni 2004; Walker 1987). We considered the risk of other bias to be unclear in one study, as different groups received treatment in different locations, with groups 1 and 2 receiving different treatments in hospital and group 3 receiving treatment at home (Belcaro 1999).
Effects of interventions
See: Summary of findings for the main comparison Subcutaneous unfractionated heparin compared to intravenous unfractionated heparin for the initial treatment of venous thromboembolism; Summary of findings 2 Subcutaneous unfractionated heparin compared to low molecular weight heparin for the initial treatment of venous thromboembolism
For a summary of outcomes see summary of findings Table for the main comparison; summary of findings Table 2. For details of outcomes see Data and analyses.
Subcutaneous UFH versus intravenous UFH
Symptomatic recurrent VTE at three months
Eight studies with a combined total of 965 participants measured recurrent VTE at three months (Andersson 1982; Bentley 1980; Doyle 1987; Hull 1986; Krähenbühl 1979; Lopaciuk 1990; Pini 1990; Walker 1987). The rate of recurrence was similar between participants treated with subcutaneous (27 events/485 participants) versus IV UFH (17 events/480 participants), leading to an odds ratio (OR) of 1.66 (95% CI 0.89 to 3.10; N = 965; 8 studies; I2 = 0%; low‐quality evidence; Analysis 1.1). All eight studies excluded participants with PE, so we could not perform subgroup analysis based on VTE at randomisation.
Symptomatic recurrent DVT at three months
One study with 115 participants measured recurrent DVT at three months (Hull 1986), finding a similar rate between participants treated with subcutaneous (6 events/57 participants) versus IV UFH (2 events/58 participants), leading to an OR of 3.29 (95% CI 0.64 to 17.06; N = 115; 1 study; low‐quality evidence; Analysis 1.2). This study included only DVT participants, so we could not perform subgroup analysis based on VTE at randomisation.
PE at three months
Nine studies with a combined total of 1161 participants measured incidence of PE at three months (Andersson 1982; Belcaro 1999; Bentley 1980; Doyle 1987; Hull 1986; Krähenbühl 1979; Lopaciuk 1990; Pini 1990; Walker 1987). Incidence was similar between participants treated with subcutaneous (21 events/584 participants) versus IV UFH (15 events/577 participants), leading to an OR of 1.44 (95% CI 0.73 to 2.84; N = 1161; 9 studies; I2 = 0%; low‐quality evidence; Analysis 1.3). All nine studies excluded participants with PE, so we could not perform subgroup analysis based on VTE at randomisation.
VTE‐related mortality at three months
Nine studies with a combined total of 1168 participants measured VTE‐related mortality at three months (Andersson 1982; Belcaro 1999; Bentley 1980; Doyle 1987; Hull 1986; Krähenbühl 1979; Lopaciuk 1990; Pini 1990; Walker 1987). However, only three studies reported any cases of this outcome (Hull 1986; Lopaciuk 1990; Pini 1990), which was similar for participants treated with subcutaneous (2 events/588 participants) versus IV UFH (2 events/580 participants), leading to an OR of 0.98 (95% CI 0.20 to 4.88; N = 1168; 9 studies; I2 = 0%; low‐quality evidence; Analysis 1.4). All nine studies excluded participants with PE, so we could not perform subgroup analysis based on VTE at randomisation.
Major bleeding
Four studies with a combined total of 583 participants measured incidence of major bleeding during the study period (Doyle 1987; Hull 1986; Lopaciuk 1990; Pini 1990). The incidence of major bleeding was similar between participants treated with subcutaneous (13 events/294 participants) versus IV UFH (14 events/289 participants), leading to an OR of 0.91 (95% CI 0.42 to 1.97; N = 583; 4 studies; I2 = 0%; low‐quality evidence; Analysis 1.5). All four studies excluded participants with PE, so we could not perform subgroup analysis based on VTE at randomisation.
All‐cause mortality
Eight studies with a combined total of 972 participants measured all‐cause mortality (Andersson 1982; Bentley 1980; Doyle 1987; Hull 1986; Krähenbühl 1979; Lopaciuk 1990; Pini 1990; Walker 1987). This outcome was similar for participants treated with subcutaneous (11 events/489 participants) versus IV UFH (6 events/483 participants), leading to an OR of 1.74 (95% CI 0.67 to 4.51; N = 972; 8 studies; I2 = 0%; low‐quality evidence; Analysis 1.6). All eight studies excluded participants with PE, so we could not perform subgroup analysis based on VTE at randomisation.
Asymptomatic VTE at three months
No studies comparing subcutaneous UFH with IV UFH reported any episodes of asymptomatic VTE occurring within three months of the commencement of treatment.
Treatment‐related morbidity
Minor bleeding
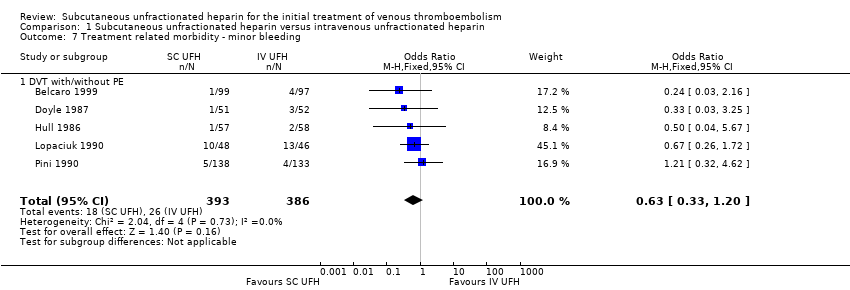
Five studies with a combined total of 779 participants measured incidence of minor bleeding during the study period (Belcaro 1999; Doyle 1987; Hull 1986; Lopaciuk 1990; Pini 1990). Incidence was similar for participants treated with subcutaneous (18 events/393 participants) versus IV UFH (26 events/386 participants), leading to an OR of 0.63 (95% CI 0.33 to 1.20; N = 779; 5 studies; I2 = 0%; low‐quality evidence; Analysis 1.7). All five studies excluded participants with PE, so we could not perform subgroup analysis based on VTE at randomisation.
Heparin‐induced thrombocytopenia
None of the studies comparing subcutaneous UFH with IV UFH reported episodes of HIT.
Length of hospital stay
The study by Belcaro 1999 measured days in hospital, but the subcutaneous UFH group were treated at home, so we could not make a comparison. The mean (± standard deviation) length of hospital stay in the IV UFH group was 5.4 ± 1.4 days.
Quality of life
None of the included studies measured quality of life as an outcome.
Subcutaneous UFH versus LMWH
Symptomatic recurrent VTE at three months
Five studies with a combined total of 2156 participants measured recurrent VTE at three months (Holm 1986; Kearon 2006; Leizorovicz 2011; Lopaciuk 1992; Prandoni 2004). The rate of recurrent VTE at three months was similar for participants treated with subcutaneous UFH (34 events/1071 participants) versus LMWH (34 events/1085 participants), leading to an OR of 1.01 (95% CI 0.63 to 1.63; N = 2156; 5 studies; I2 = 0%; low‐quality evidence; Analysis 2.1). We observed no differences between the VTE at randomisation subgroups 'DVT with/without PE' versus 'DVT without PE' (P = 0.38).
Symptomatic recurrent DVT at three months
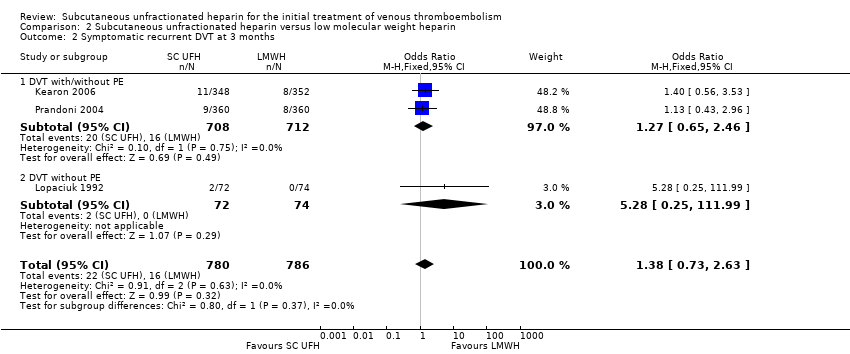
Three studies with a combined total of 1566 participants measured recurrent DVT at three months (Kearon 2006; Lopaciuk 1992; Prandoni 2004), finding similar rates for participants treated with subcutaneous UFH (22 events/780 participants) versus LMWH (16 events/786 participants), leading to an OR of 1.38 (95% CI 0.73 to 2.63; N = 1566; 3 studies; I2 = 0%; low‐quality evidence; Analysis 2.2). We observed no differences between the VTE at randomisation subgroups 'DVT with/without PE' versus 'DVT without PE' (P = 0.37).
PE at three months
Five studies with a combined total of 1819 participants measured incidence of PE at three months (Belcaro 1999; Holm 1986; Kearon 2006; Lopaciuk 1992; Prandoni 2004). Incidence was similar for participants treated with subcutaneous UFH (9 events/906 participants) versus LMWH (11 events/913 participants), leading to an OR of 0.84 (95% CI 0.36 to 1.96; N = 1819; 5 studies; I2 = 0%; low‐quality evidence) (Analysis 2.3). We observed no differences between the VTE at randomisation subgroups 'DVTwith/without PE' versus 'DVT without PE' (P = 0.81).
VTE‐related mortality at three months
Eight studies with a combined total of 2469 participants measured VTE‐related mortality at three months (Belcaro 1999; Faivre 1987; Holm 1986; Kearon 2006; Leizorovicz 2011; Lopaciuk 1992; Peternel 2002; Prandoni 2004). The outcome was similar for participants treated with subcutaneous UFH (4 events/1230 participants) versus LMWH (8 events/1239 participants), leading to an OR of 0.53 (95% CI 0.17 to 1.67; N = 2469; 8 studies; I2 = 0%; low‐quality evidence; Analysis 2.4). There were no cases of VTE‐related mortality in the four studies incorporating participants with DVT but without PE.
Major bleeding
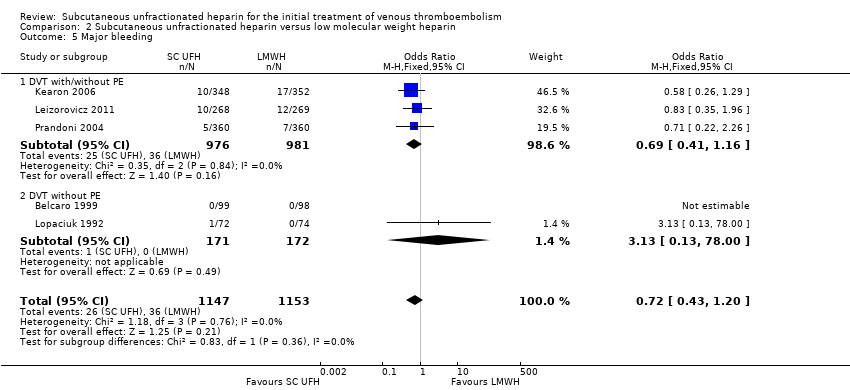
Five studies with a combined total of 2300 participants measured incidence of major bleeding during the study period (Belcaro 1999; Kearon 2006; Leizorovicz 2011; Lopaciuk 1992; Prandoni 2004). The incidence of major bleeding was similar for participants treated with subcutaneous UFH (26 events/1147 participants) versus LMWH (36 events/1153 participants), leading to an OR of 0.72 (95% CI 0.43 to 1.20; N = 2300; 5 studies; I2 = 0%; low‐quality evidence; Analysis 2.5). We observed no differences between the VTE at randomisation subgroups DVT regardless of PE status versus DVT without PE(P = 0.36).
All‐cause mortality
Seven studies with a combined total of 2272 participants measured all‐cause mortality (Faivre 1987; Holm 1986; Kearon 2006; Leizorovicz 2011; Lopaciuk 1992; Peternel 2002; Prandoni 2004). This outcome was similar for participants treated with subcutaneous UFH (49 events/1131 participants) versus LMWH (66 events/1141 participants), leading to an OR of 0.73 (95% CI 0.50 to 1.07; N = 2272; 7 studies; I2 = 0%; low‐quality evidence; Analysis 2.6). We observed no differences between the VTE at randomisation subgroups 'DVT with/without PE' versus 'DVT without PE' (P = 0.41).
Asymptomatic VTE at three months
There were no episodes of asymptomatic VTE occurring within three months of the commencement of treatment reported by any studies comparing subcutaneous UFH versus LMWH.
Treatment‐related morbidity
Minor bleeding
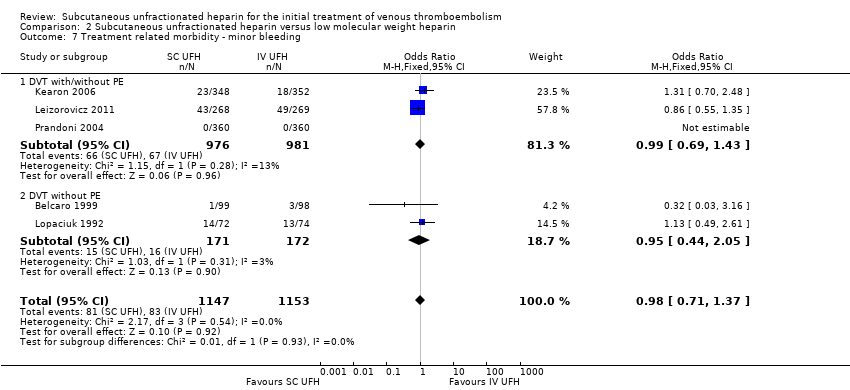
Five studies with a combined total of 2300 participants measured incidence of minor bleeding within the study period (Belcaro 1999; Kearon 2006; Leizorovicz 2011; Lopaciuk 1992; Prandoni 2004). The incidence of minor bleeding was similar for participants treated with subcutaneous UFH (81 events/1147 participants) versus LMWH (83 events/1153 participants), leading to an OR of 0.98 (95% CI 0.71 to 1.37; N = 2300; 5 studies; I2 = 0%;; Analysis 2.7). We observed no differences between the VTE at randomisation subgroups 'DVTwith/without PE' versus 'DVT without PE' (P = 0.93).
Heparin‐induced thrombocytopenia
Three studies with a combined total of 1954 participants measured the incidence of HIT (Kearon 2006; Leizorovicz 2011; Prandoni 2004). The outcome was similar for participants treated with subcutaneous UFH (3 events/972 participants) versus LMWH (2 events/982 participants), leading to an OR of 1.52 (95% CI 0.25 to 9.14; N = 1954; 3 studies; I2 = 0%; Analysis 2.8). All three studies included participants with PE, so we could not perform subgroup analysis based on VTE at randomisation.
Length of hospital stay
Belcaro 1999 measured days in hospital, but the subcutaneous UFH group received treatment at home, so we could not make a comparison. The mean length of hospital stay in the LMWH group was 5.1 ± 1.0 days.
Quality of life
None of the included studies measured quality of life as an outcome
Subgroup analysis
Data were not available for subgroup analysis by first or recurrent VTE, severity of VTE, age of participants, renal function or underlying pathology of VTE. Additionally, data were not available for subgroup analysis by number of daily subcutaneous heparin injections, type of dose adjustment, initial intravenous bolus heparin given versus not given, concomitant oral anticoagulant use or timing of oral anticoagulant initiation. We report results of subgroup analyses by VTE at randomisation above.
Sensitivity analysis
We performed sensitivity analyses in order to explore the influence of certain factors on effect size. We considered two studies large compared with others (Kearon 2006; Prandoni 2004). Both compared subcutaneous UFH versus LMWH. Exclusion of these trials from the analysis of outcomes did not influence the results (Analysis 3.1; Analysis 3.2; Analysis 3.3; Analysis 3.4; Analysis 3.5; Analysis 3.6; Analysis 3.7). We did not analyse the effect of published versus unpublished trials, as no unpublished data were available. Sensitivity of the results to the quality of trials was not feasible, as we judged all but one trial to be at a high risk of bias. Furthermore, we could not perform sensitivity analyses by diagnostic criteria, language of publication or source of funding due to insufficient data.
Discussion
Summary of main results
Symptomatic recurrent VTE at three months
Meta‐analyses showed no difference in the rate of symptomatic recurrent VTE at three months between subcutaneous UFH versus IV UFH or LMWH. Our analyses showed little or no statistical heterogeneity between the included studies. When comparing subcutaneous UFH versus LMWH, the subgroup analysis by VTE at randomisation showed no difference between participants that had DVT without PE and those that had DVT with/without PE. Furthermore, we observed no difference when excluding two large studies from the analysis.
Symptomatic recurrent DVT at three months
Meta‐analyses showed no difference in the rate of symptomatic recurrent DVT at three months between subcutaneous UFH versus IV UFH or LMWH.
PE at three months
Meta‐analyses showed no difference in the rate of PE between subcutaneous UFH and IV UFH nor LMWH. When comparing subcutaneous UFH versus LMWH, subgroup analysis by VTE at randomisation showed no difference between participants that had DVT without PE and those that had DVT with/without PE.
VTE‐related mortality at three months
Meta‐analyses showed no difference in the rate of VTE‐related mortality at three months between subcutaneous UFH versus IV UFH or LMWH. There were no cases of VTE‐related mortality in the four studies incorporating participants that had DVT without PE. Furthermore, we observed no difference when excluding two large studies from the analysis.
Major bleeding
Meta‐analyses showed no difference in the rate of major bleeding between subcutaneous UFH versus IV UFH or LMWH. When comparing subcutaneous UFH versus LMWH, subgroup analysis by VTE at randomisation showed no difference between participants that had DVT without PE and those that had DVT with/without PE. Furthermore, we observed no difference when excluding two large studies from the analysis.
All‐cause mortality
Meta‐analyses showed no difference in the rate of all‐cause mortality between subcutaneous UFH versus IV UFH or LMWH. When comparing subcutaneous UFH versus LMWH, subgroup analysis by VTE at randomisation showed no difference between participants that had DVT without PE and those that had DVT with/without PE.
Asymptomatic VTE at three months
None of the included studies reported any episodes of asymptomatic VTE occurring within three months of the commencement of treatment.
Treatment‐related morbidity
Minor bleeding
Meta‐analyses showed no difference in the incidence of minor bleeding between subcutaneous UFH and IV UFH or LMWH. When comparing subcutaneous UFH versus LMWH, subgroup analysis by VTE at randomisation showed no difference between participants that had DVT without PE and those that had DVT with/without PE. Furthermore, we observed no difference when excluding two large studies from the analysis.
Heparin‐induced thrombocytopenia
None of the studies comparing subcutaneous UFH versus IV UFH reported any episodes of HIT. Meta‐analyses showed no difference in the incidence of HIT between participants treated with subcutaneous UFH versus LMWH. When comparing subcutaneous UFH versus LMWH, subgroup analysis by VTE at randomisation showed no difference between participants that had DVT without PE and those that had DVT with/without PE. Furthermore, we observed no difference when excluding two large studies from the analysis.
Length of hospital stay
One three‐armed study, comparing subcutaneous UFH versus IV UFH versus LMWH, measured length of hospital stay associated with each treatment. However, the subcutaneous UFH group received treatment at home, so we could not make a comparison. The mean length of hospital stay was 5.4 ± 1.4 days in the IV UFH and 5.1 ± 1.0 days in the LWMH groups, respectively.
Quality of life
None of the included studies measured quality of life as an outcome.
Overall completeness and applicability of evidence
This review assessed whether subcutaneous UFH reduced the rate of recurrent VTE, VTE‐related mortality, major bleeding and all‐cause mortality in participants with VTE. Eight studies used IV UFH as the comparator and seven studies used LMWH, while one three‐armed trial compared all three of those treatment possibilities. We did not identify trials comparing subcutaneous UFH with other anticoagulant drugs. All trials included participants with deep vein thrombosis. Seven trials excluded people with a PE, four trials included PE participants, and the remaining trials did not clearly describe PE inclusion. With the exception of asymptomatic VTE at three months and health‐related quality of life, the included studies measured and reported all of the addressed outcomes. As all the trials had strict inclusion criteria, resulting in an overall participant population with almost identical conditions, statistical heterogeneity was logically low for all outcomes. Furthermore, studies used similar concentrations for each particular drug.
We planned subgroup analyses by first or recurrent VTE, severity, age, renal function, underlying pathology, number of daily subcutaneous heparin injections, type of dose adjustment, initial intravenous bolus heparin given versus not given, concomitant oral anticoagulant use, and timing of oral anticoagulant initiation. However, we could not perform these subgroup analyses because of the lack of participant‐level data.
Although many researchers consider DVT and PE to be manifestations of the same disorder, we elected to present them in the form of subgroups, as there is evidence of clinically significant differences between them. Most recurrent events occur at the same site as the original thrombosis (in other words, in a person presenting with a PE, a recurrent event after treatment is much more likely to be another PE). For comparisons and outcomes where subgroup analyses were possible, we did not observe any differences between studies recruiting participants that had DVT without PE and participants that had DVT with/without PE.
The American College of Chest Physicians (ACCP) clinical practice guidelines for the treatment of VTE suggest UFH as the treatment of choice for patients with severe renal failure (Kearon 2012). This is a grade 2C recommendation, based on low‐quality evidence that LMWH is associated with increased bleeding in patients with impaired renal function. Only one trial included in our review studied participants with impaired renal function (Leizorovicz 2011), comparing subcutaneous UFH versus LMWH tinzaparin in the treatment of acute DVT. The trial was terminated early due to a difference in mortality that favoured the group treated with UFH. However, rates of major bleeding and recurrent VTE were similar between the two groups.
Quality of the evidence
The risk of bias was high in 15 out of the 16 included studies, reflecting low methodological quality (Figure 2; Figure 3). This was largely due to the lack of blinding in 14 studies, which led to a high risk of performance bias. The risk of detection bias was lower: 8 of the 16 included studies reported that outcomes assessors were blinded to the treatment and adjudicated by a central independent committee. We judged seven studies to be at high risk of attrition bias for failing to account for missing data, one study to be at high risk of selection bias because of insufficient reporting of the methods used to conceal treatment allocation, and another study to be at high risk of reporting bias because it reported a significant result on an outcome that was not pre‐specified. We could not investigate publication bias because we could not assess asymmetry in a funnel plot with the limited number of studies included in the meta‐analysis.
For all outcomes in both comparisons, we downgraded the quality of the evidence to low due to the high risk of bias within each included study and also due to imprecision stemming from the small number of outcome events, as reflected by the wide confidence intervals.
Potential biases in the review process
The search was as comprehensive as possible, and we are confident that we have included all relevant studies. However, the possibility remains that we missed some relevant trials, particularly in the grey literature (for example conference proceedings). Two review authors independently performed study selection and data extraction in order to minimise bias in the review process. We performed data collection according to the process suggested by Cochrane. We also followed Cochrane processes as described by Higgins 2011 for assessing the risk of bias.
Agreements and disagreements with other studies or reviews
A meta‐analysis comparing subcutaneous heparin with intravenous heparin published in 1992 concluded that the subcutaneous mode of administration was more efficacious and less toxic than the intravenous mode of administration (Hommes 1992). Another more recent review of the literature comparing subcutaneous UFH versus subcutaneous LMWH concluded that subcutaneous UFH was an attractive alternative to LWMH for VTE, being "cheap, effective and safe" (Munro 2008).
Since the introduction of LMWH, there has been a shift away from the older and less easy‐to‐use UFH. Several other meta‐analyses of the medical literature have been published over the years, suggesting enhanced efficacy and safety profile for LMWH (Erkens 2010; Gould 1999).
Methodological quality graph: review authors' judgements about each methodological quality item presented as percentages across all included studies.
Methodological quality summary: review authors' judgements about each methodological quality item for each included study.

Comparison 1 Subcutaneous unfractionated heparin versus intravenous unfractionated heparin, Outcome 1 Symptomatic recurrent VTE at 3 months.

Comparison 1 Subcutaneous unfractionated heparin versus intravenous unfractionated heparin, Outcome 2 Symptomatic recurrent DVT at 3 months.
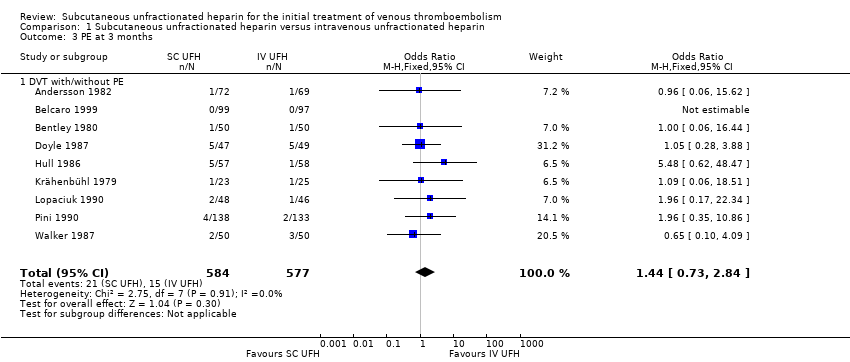
Comparison 1 Subcutaneous unfractionated heparin versus intravenous unfractionated heparin, Outcome 3 PE at 3 months.

Comparison 1 Subcutaneous unfractionated heparin versus intravenous unfractionated heparin, Outcome 4 VTE‐related mortality at 3 months.

Comparison 1 Subcutaneous unfractionated heparin versus intravenous unfractionated heparin, Outcome 5 Major bleeding.
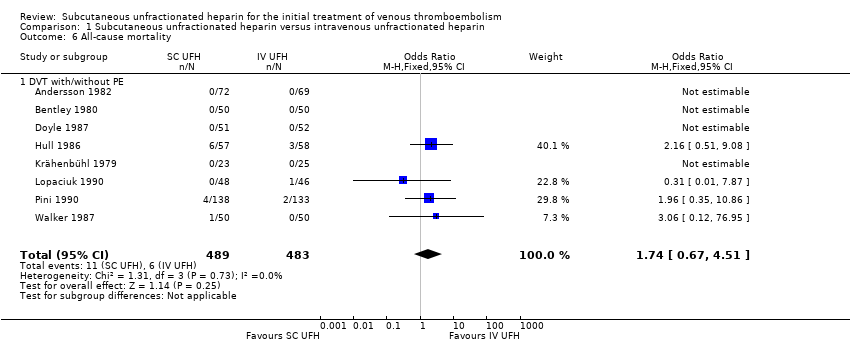
Comparison 1 Subcutaneous unfractionated heparin versus intravenous unfractionated heparin, Outcome 6 All‐cause mortality.
Comparison 1 Subcutaneous unfractionated heparin versus intravenous unfractionated heparin, Outcome 7 Treatment related morbidity ‐ minor bleeding.

Comparison 2 Subcutaneous unfractionated heparin versus low molecular weight heparin, Outcome 1 Symptomatic recurrent VTE at 3 months.
Comparison 2 Subcutaneous unfractionated heparin versus low molecular weight heparin, Outcome 2 Symptomatic recurrent DVT at 3 months.

Comparison 2 Subcutaneous unfractionated heparin versus low molecular weight heparin, Outcome 3 PE at 3 months.

Comparison 2 Subcutaneous unfractionated heparin versus low molecular weight heparin, Outcome 4 VTE‐related mortality at 3 months.
Comparison 2 Subcutaneous unfractionated heparin versus low molecular weight heparin, Outcome 5 Major bleeding.

Comparison 2 Subcutaneous unfractionated heparin versus low molecular weight heparin, Outcome 6 All‐cause mortality.
Comparison 2 Subcutaneous unfractionated heparin versus low molecular weight heparin, Outcome 7 Treatment related morbidity ‐ minor bleeding.

Comparison 2 Subcutaneous unfractionated heparin versus low molecular weight heparin, Outcome 8 Treatment related morbidity ‐ HIT.

Comparison 3 Subcutaneous unfractionated heparin versus low molecular weight heparin (excluding large studies), Outcome 1 Symptomatic recurrent VTE at 3 months.

Comparison 3 Subcutaneous unfractionated heparin versus low molecular weight heparin (excluding large studies), Outcome 2 Symptomatic recurrent DVT at 3 months.

Comparison 3 Subcutaneous unfractionated heparin versus low molecular weight heparin (excluding large studies), Outcome 3 PE at 3 months.
Comparison 3 Subcutaneous unfractionated heparin versus low molecular weight heparin (excluding large studies), Outcome 4 VTE‐related mortality at 3 months.

Comparison 3 Subcutaneous unfractionated heparin versus low molecular weight heparin (excluding large studies), Outcome 5 Major bleeding.

Comparison 3 Subcutaneous unfractionated heparin versus low molecular weight heparin (excluding large studies), Outcome 6 All‐cause mortality.

Comparison 3 Subcutaneous unfractionated heparin versus low molecular weight heparin (excluding large studies), Outcome 7 Treatment‐related morbidity.
| Subcutaneous unfractionated heparin compared to intravenous unfractionated heparin for the initial treatment of venous thromboembolism | |||||
| Patient or population: people aged ≥ 18 years with a diagnosis of new or recurrent VTE | |||||
| Outcomes | Anticipated absolute effects* (95% CI) | Relative effect | Number of participants | Quality of the evidence | |
| Assumed risk | Corresponding risk | ||||
| Risk with intravenous unfractionated heparin | Risk with subcutaneous unfractionated heparin | ||||
| Symptomatic recurrent VTE at 3 months | Study population | OR 1.66 | 965 | ⊕⊕⊝⊝ | |
| 35 per 1000 | 57 per 1000 | ||||
| Symptomatic recurrent DVT at 3 months | Study population | OR 3.29 | 115 | ⊕⊕⊝⊝ | |
| 34 per 1000 | 105 per 1000 | ||||
| PE at 3 months | Study population | OR 1.44 | 1161 | ⊕⊕⊝⊝ | |
| 26 per 1000 | 37 per 1000 | ||||
| VTE‐related mortality at 3 months | Study population | OR 0.98 | 1168 | ⊕⊕⊝⊝ | |
| 3 per 1000 | 3 per 1000 | ||||
| Major bleedingd (7 days ‐ 12 months) | Study population | OR 0.91 | 583 | ⊕⊕⊝⊝ | |
| 48 per 1000 | 44 per 1000 | ||||
| All‐cause mortality (5 days to 12 months) | Study population | OR 1.74 | 972 | ⊕⊕⊝⊝ | |
| 12 per 1000 | 21 per 1000 | ||||
| Asymptomatic VTE at 3 months | No study measured this outcome | ||||
| *The basis for the assumed risk was the average risk in the intravenous unfractionated heparin group (i.e. the number of participants with events divided by total number of participants of the intravenous heparin group included in the meta‐analysis). The risk in the subcutaneous unfractionated heparin group (and its 95% confidence interval) is based on the assumed risk in the intravenous unfractionated heparin group and the relative effect of the intervention (and its 95% CI). | |||||
| GRADE Working Group grades of evidence | |||||
| aWe downgraded the quality of the evidence to low due to a high risk of performance bias in eight studies (Andersson 1982; Belcaro 1999; Bentley 1980; Doyle 1987; Krähenbühl 1979; Lopaciuk 1990; Pini 1990; Walker 1987), plus a high risk of attrition bias in five studies (Andersson 1982; Belcaro 1999; Bentley 1980; Krähenbühl 1979; Pini 1990). We also downgraded for imprecision, as reflected by the wide confidence intervals. | |||||
| Subcutaneous unfractionated heparin compared to low molecular weight heparin for the initial treatment of venous thromboembolism | |||||
| Patient or population: people aged ≥ 18 years with a diagnosis of new or recurrent VTE | |||||
| Outcomes | Anticipated absolute effects* (95% CI) | Relative effect | Number of participants | Quality of the evidence | |
| Assumed risk | Corresponding risk | ||||
| Risk with low molecular weight heparin | Risk with subcutaneous unfractionated heparin | ||||
| Symptomatic recurrent VTE at 3 months | Study population | OR 1.01 | 2156 | ⊕⊕⊝⊝ | |
| 31 per 1000 | 32 per 1000 | ||||
| Symptomatic recurrent DVT at 3 months | Study population | OR 1.38 | 1566 | ⊕⊕⊝⊝ | |
| 20 per 1000 | 28 per 1000 | ||||
| PE at 3 months | Study population | OR 0.84 | 1819 | ⊕⊕⊝⊝ | |
| 12 per 1000 | 10 per 1000 | ||||
| VTE‐related mortality at 3 months | Study population | OR 0.53 | 2469 | ⊕⊕⊝⊝ | |
| 6 per 1000 | 3 per 1000 | ||||
| Major bleedingd (3 months) | Study population | OR 0.72 | 2300 | ⊕⊕⊝⊝ | |
| 31 per 1000 | 23 per 1000 | ||||
| All‐cause mortality (7 days ‐ 3 months) | Study population | OR 0.73 | 2272 | ⊕⊕⊝⊝ | |
| 58 per 1000 | 43 per 1000 | ||||
| Asymptomatic VTE at 3 months | No study measured this outcome | ||||
| *The basis for the assumed risk was the average risk in the low molecular weight heparin group (i.e. the number of participants with events divided by total number of participants of the low molecular weight heparin group included in the meta‐analysis). The risk in the subcutaneous unfractionated heparin group (and its 95% confidence interval) is based on the assumed risk in the low molecular weight heparin group and the relative effect of the intervention (and its 95% CI). | |||||
| GRADE Working Group grades of evidence | |||||
| aWe downgraded the quality of the evidence to low due to high risk of selection and reporting bias in one study (Holm 1986), plus a high risk of performance bias in four studies (Kearon 2006; Leizorovicz 2011; Lopaciuk 1992; Prandoni 2004). We also downgraded for imprecision, as reflected by the wide confidence intervals. | |||||
| Outcome or subgroup title | No. of studies | No. of participants | Statistical method | Effect size |
| 1 Symptomatic recurrent VTE at 3 months Show forest plot | 8 | 965 | Odds Ratio (M‐H, Fixed, 95% CI) | 1.66 [0.89, 3.10] |
| 1.1 DVT with/without PE | 8 | 965 | Odds Ratio (M‐H, Fixed, 95% CI) | 1.66 [0.89, 3.10] |
| 2 Symptomatic recurrent DVT at 3 months Show forest plot | 1 | 115 | Odds Ratio (M‐H, Fixed, 95% CI) | 3.29 [0.64, 17.06] |
| 2.1 DVT with/without PE | 1 | 115 | Odds Ratio (M‐H, Fixed, 95% CI) | 3.29 [0.64, 17.06] |
| 3 PE at 3 months Show forest plot | 9 | 1161 | Odds Ratio (M‐H, Fixed, 95% CI) | 1.44 [0.73, 2.84] |
| 3.1 DVT with/without PE | 9 | 1161 | Odds Ratio (M‐H, Fixed, 95% CI) | 1.44 [0.73, 2.84] |
| 4 VTE‐related mortality at 3 months Show forest plot | 9 | 1168 | Odds Ratio (M‐H, Fixed, 95% CI) | 0.98 [0.20, 4.88] |
| 4.1 DVT with/without PE | 9 | 1168 | Odds Ratio (M‐H, Fixed, 95% CI) | 0.98 [0.20, 4.88] |
| 5 Major bleeding Show forest plot | 4 | 583 | Odds Ratio (M‐H, Fixed, 95% CI) | 0.91 [0.42, 1.97] |
| 5.1 DVT with/without PE | 4 | 583 | Odds Ratio (M‐H, Fixed, 95% CI) | 0.91 [0.42, 1.97] |
| 6 All‐cause mortality Show forest plot | 8 | 972 | Odds Ratio (M‐H, Fixed, 95% CI) | 1.74 [0.67, 4.51] |
| 6.1 DVT with/without PE | 8 | 972 | Odds Ratio (M‐H, Fixed, 95% CI) | 1.74 [0.67, 4.51] |
| 7 Treatment related morbidity ‐ minor bleeding Show forest plot | 5 | 779 | Odds Ratio (M‐H, Fixed, 95% CI) | 0.63 [0.33, 1.20] |
| 7.1 DVT with/without PE | 5 | 779 | Odds Ratio (M‐H, Fixed, 95% CI) | 0.63 [0.33, 1.20] |
| Outcome or subgroup title | No. of studies | No. of participants | Statistical method | Effect size |
| 1 Symptomatic recurrent VTE at 3 months Show forest plot | 5 | 2156 | Odds Ratio (M‐H, Fixed, 95% CI) | 1.01 [0.63, 1.63] |
| 1.1 DVT with/without PE | 3 | 1954 | Odds Ratio (M‐H, Fixed, 95% CI) | 0.95 [0.57, 1.56] |
| 1.2 DVT without PE | 2 | 202 | Odds Ratio (M‐H, Fixed, 95% CI) | 2.12 [0.38, 11.84] |
| 2 Symptomatic recurrent DVT at 3 months Show forest plot | 3 | 1566 | Odds Ratio (M‐H, Fixed, 95% CI) | 1.38 [0.73, 2.63] |
| 2.1 DVT with/without PE | 2 | 1420 | Odds Ratio (M‐H, Fixed, 95% CI) | 1.27 [0.65, 2.46] |
| 2.2 DVT without PE | 1 | 146 | Odds Ratio (M‐H, Fixed, 95% CI) | 5.28 [0.25, 111.99] |
| 3 PE at 3 months Show forest plot | 5 | 1819 | Odds Ratio (M‐H, Fixed, 95% CI) | 0.84 [0.36, 1.96] |
| 3.1 DVT with/without PE | 2 | 1420 | Odds Ratio (M‐H, Fixed, 95% CI) | 0.80 [0.31, 2.04] |
| 3.2 DVT without PE | 3 | 399 | Odds Ratio (M‐H, Fixed, 95% CI) | 1.05 [0.14, 7.63] |
| 4 VTE‐related mortality at 3 months Show forest plot | 8 | 2469 | Odds Ratio (M‐H, Fixed, 95% CI) | 0.53 [0.17, 1.67] |
| 4.1 DVT with/without PE | 4 | 2016 | Odds Ratio (M‐H, Fixed, 95% CI) | 0.53 [0.17, 1.67] |
| 4.2 DVT without PE | 4 | 453 | Odds Ratio (M‐H, Fixed, 95% CI) | 0.0 [0.0, 0.0] |
| 5 Major bleeding Show forest plot | 5 | 2300 | Odds Ratio (M‐H, Fixed, 95% CI) | 0.72 [0.43, 1.20] |
| 5.1 DVT with/without PE | 3 | 1957 | Odds Ratio (M‐H, Fixed, 95% CI) | 0.69 [0.41, 1.16] |
| 5.2 DVT without PE | 2 | 343 | Odds Ratio (M‐H, Fixed, 95% CI) | 3.13 [0.13, 78.00] |
| 6 All‐cause mortality Show forest plot | 7 | 2272 | Odds Ratio (M‐H, Fixed, 95% CI) | 0.73 [0.50, 1.07] |
| 6.1 DVT with/without PE | 4 | 2016 | Odds Ratio (M‐H, Fixed, 95% CI) | 0.71 [0.48, 1.05] |
| 6.2 DVT without PE | 3 | 256 | Odds Ratio (M‐H, Fixed, 95% CI) | 1.71 [0.22, 13.26] |
| 7 Treatment related morbidity ‐ minor bleeding Show forest plot | 5 | 2300 | Odds Ratio (M‐H, Fixed, 95% CI) | 0.98 [0.71, 1.37] |
| 7.1 DVT with/without PE | 3 | 1957 | Odds Ratio (M‐H, Fixed, 95% CI) | 0.99 [0.69, 1.43] |
| 7.2 DVT without PE | 2 | 343 | Odds Ratio (M‐H, Fixed, 95% CI) | 0.95 [0.44, 2.05] |
| 8 Treatment related morbidity ‐ HIT Show forest plot | 3 | 1954 | Odds Ratio (M‐H, Fixed, 95% CI) | 1.52 [0.25, 9.14] |
| 8.1 DVT with/without PE | 3 | 1954 | Odds Ratio (M‐H, Fixed, 95% CI) | 1.52 [0.25, 9.14] |
| Outcome or subgroup title | No. of studies | No. of participants | Statistical method | Effect size |
| 1 Symptomatic recurrent VTE at 3 months Show forest plot | 3 | 736 | Odds Ratio (M‐H, Fixed, 95% CI) | 0.80 [0.29, 2.16] |
| 2 Symptomatic recurrent DVT at 3 months Show forest plot | 1 | Odds Ratio (M‐H, Fixed, 95% CI) | Totals not selected | |
| 3 PE at 3 months Show forest plot | 3 | 399 | Odds Ratio (M‐H, Fixed, 95% CI) | 1.05 [0.14, 7.63] |
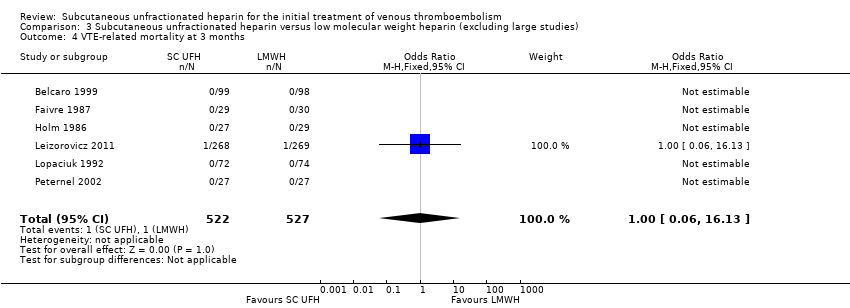
| 4 VTE‐related mortality at 3 months Show forest plot | 6 | 1049 | Odds Ratio (M‐H, Fixed, 95% CI) | 1.00 [0.06, 16.13] |
| 5 Major bleeding Show forest plot | 3 | 880 | Odds Ratio (M‐H, Fixed, 95% CI) | 0.92 [0.41, 2.09] |
| 6 All‐cause mortality Show forest plot | 5 | 852 | Odds Ratio (M‐H, Fixed, 95% CI) | 0.58 [0.32, 1.03] |
| 7 Treatment‐related morbidity Show forest plot | 3 | Odds Ratio (M‐H, Fixed, 95% CI) | Subtotals only | |
| 7.1 Minor bleeding | 3 | 880 | Odds Ratio (M‐H, Fixed, 95% CI) | 0.88 [0.60, 1.30] |
| 7.2 Heparin‐induced thrombocytopenia | 1 | 534 | Odds Ratio (M‐H, Fixed, 95% CI) | 2.05 [0.19, 22.78] |