Scolaris Content Display Scolaris Content Display

Adapted QUOROM flow chart of studies selection
Figuras y tablas -
Figure 1

Adapted QUOROM flow chart of studies selection

Methodological quality graph: review authors' judgements about each methodological quality item presented as percentages across all included studies.
Figuras y tablas -
Figure 2

Methodological quality graph: review authors' judgements about each methodological quality item presented as percentages across all included studies.

Methodological quality summary: review authors' judgements about each methodological quality item for each included study.
Figuras y tablas -
Figure 3

Methodological quality summary: review authors' judgements about each methodological quality item for each included study.

Funnel plot of comparison: Recurrent DVT during 3 months follow up.
Figuras y tablas -
Figure 4

Funnel plot of comparison: Recurrent DVT during 3 months follow up.

Funnel plot of comparison: New clinical pulmonary embolism.
Figuras y tablas -
Figure 5

Funnel plot of comparison: New clinical pulmonary embolism.

Comparison 1 Clinical efficacy, Outcome 1 DVT resolution (partial/full) ‐ end of heparin treatment.
Figuras y tablas -
Analysis 1.1

Comparison 1 Clinical efficacy, Outcome 1 DVT resolution (partial/full) ‐ end of heparin treatment.

Comparison 1 Clinical efficacy, Outcome 2 Recurrent DVT during 3 months follow up.
Figuras y tablas -
Analysis 1.2

Comparison 1 Clinical efficacy, Outcome 2 Recurrent DVT during 3 months follow up.

Comparison 1 Clinical efficacy, Outcome 3 New clinical pulmonary embolism.
Figuras y tablas -
Analysis 1.3

Comparison 1 Clinical efficacy, Outcome 3 New clinical pulmonary embolism.

Comparison 1 Clinical efficacy, Outcome 4 New pulmonary embolism on routine lung scan ‐ end of heparin therapy.
Figuras y tablas -
Analysis 1.4

Comparison 1 Clinical efficacy, Outcome 4 New pulmonary embolism on routine lung scan ‐ end of heparin therapy.

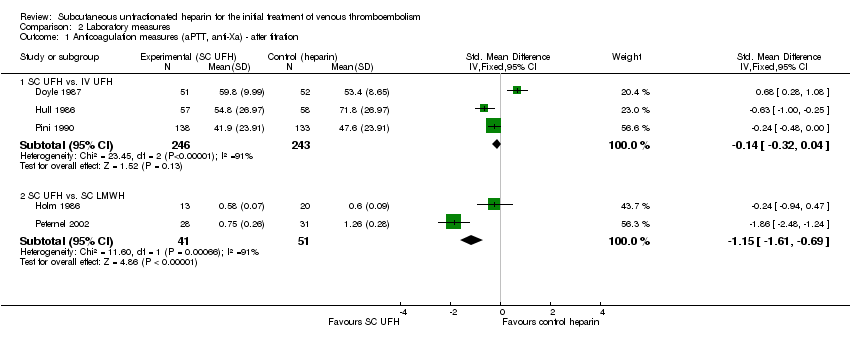
Comparison 2 Laboratory measures, Outcome 1 Anticoagulation measures (aPTT, anti‐Xa) ‐ after titration.
Figuras y tablas -
Analysis 2.1

Comparison 2 Laboratory measures, Outcome 1 Anticoagulation measures (aPTT, anti‐Xa) ‐ after titration.

Comparison 2 Laboratory measures, Outcome 2 Number of patients below therapeutic range.
Figuras y tablas -
Analysis 2.2

Comparison 2 Laboratory measures, Outcome 2 Number of patients below therapeutic range.

Comparison 3 Adverse events, Outcome 1 Major bleeding.
Figuras y tablas -
Analysis 3.1

Comparison 3 Adverse events, Outcome 1 Major bleeding.

Comparison 3 Adverse events, Outcome 2 Minor bleeding.
Figuras y tablas -
Analysis 3.2

Comparison 3 Adverse events, Outcome 2 Minor bleeding.

Comparison 3 Adverse events, Outcome 3 Platelet fall.
Figuras y tablas -
Analysis 3.3

Comparison 3 Adverse events, Outcome 3 Platelet fall.

Comparison 3 Adverse events, Outcome 4 Hemoglobin fall.
Figuras y tablas -
Analysis 3.4

Comparison 3 Adverse events, Outcome 4 Hemoglobin fall.

Comparison 4 Death, Outcome 1 Total death.
Figuras y tablas -
Analysis 4.1

Comparison 4 Death, Outcome 1 Total death.

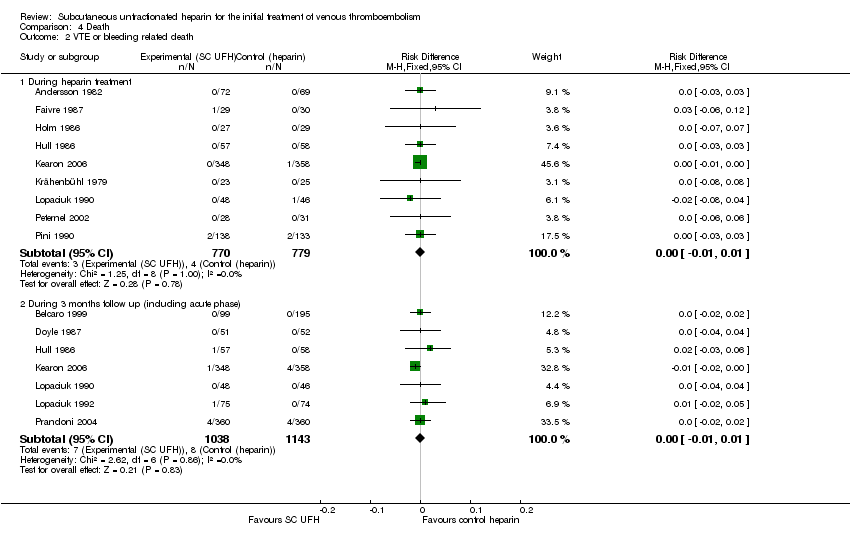
Comparison 4 Death, Outcome 2 VTE or bleeding related death.
Figuras y tablas -
Analysis 4.2

Comparison 4 Death, Outcome 2 VTE or bleeding related death.

Comparison 5 Clinical efficacy ‐ by control, Outcome 1 DVT resolution (partial/full) ‐ end of heparin treatment.
Figuras y tablas -
Analysis 5.1

Comparison 5 Clinical efficacy ‐ by control, Outcome 1 DVT resolution (partial/full) ‐ end of heparin treatment.

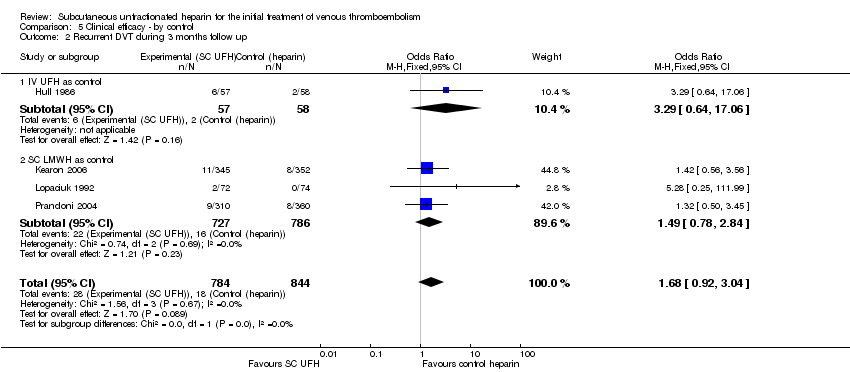
Comparison 5 Clinical efficacy ‐ by control, Outcome 2 Recurrent DVT during 3 months follow up.
Figuras y tablas -
Analysis 5.2

Comparison 5 Clinical efficacy ‐ by control, Outcome 2 Recurrent DVT during 3 months follow up.

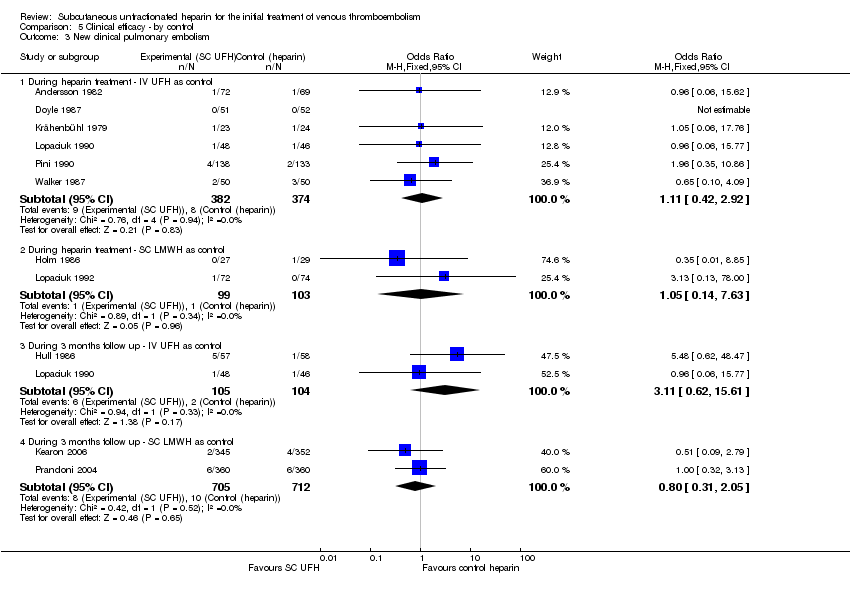
Comparison 5 Clinical efficacy ‐ by control, Outcome 3 New clinical pulmonary embolism.
Figuras y tablas -
Analysis 5.3

Comparison 5 Clinical efficacy ‐ by control, Outcome 3 New clinical pulmonary embolism.

Comparison 5 Clinical efficacy ‐ by control, Outcome 4 New pulmonary embolism on routine lung scan ‐ end of heparin therapy.
Figuras y tablas -
Analysis 5.4

Comparison 5 Clinical efficacy ‐ by control, Outcome 4 New pulmonary embolism on routine lung scan ‐ end of heparin therapy.

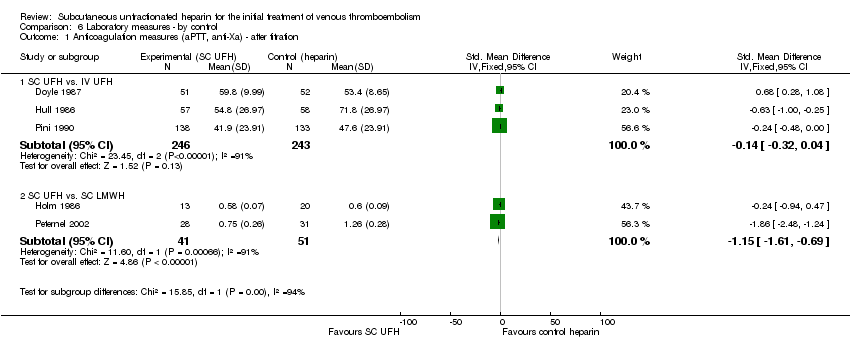
Comparison 6 Laboratory measures ‐ by control, Outcome 1 Anticoagulation measures (aPTT, anti‐Xa) ‐ after titration.
Figuras y tablas -
Analysis 6.1

Comparison 6 Laboratory measures ‐ by control, Outcome 1 Anticoagulation measures (aPTT, anti‐Xa) ‐ after titration.

Comparison 6 Laboratory measures ‐ by control, Outcome 2 Number of patients below therapeutic range.
Figuras y tablas -
Analysis 6.2

Comparison 6 Laboratory measures ‐ by control, Outcome 2 Number of patients below therapeutic range.

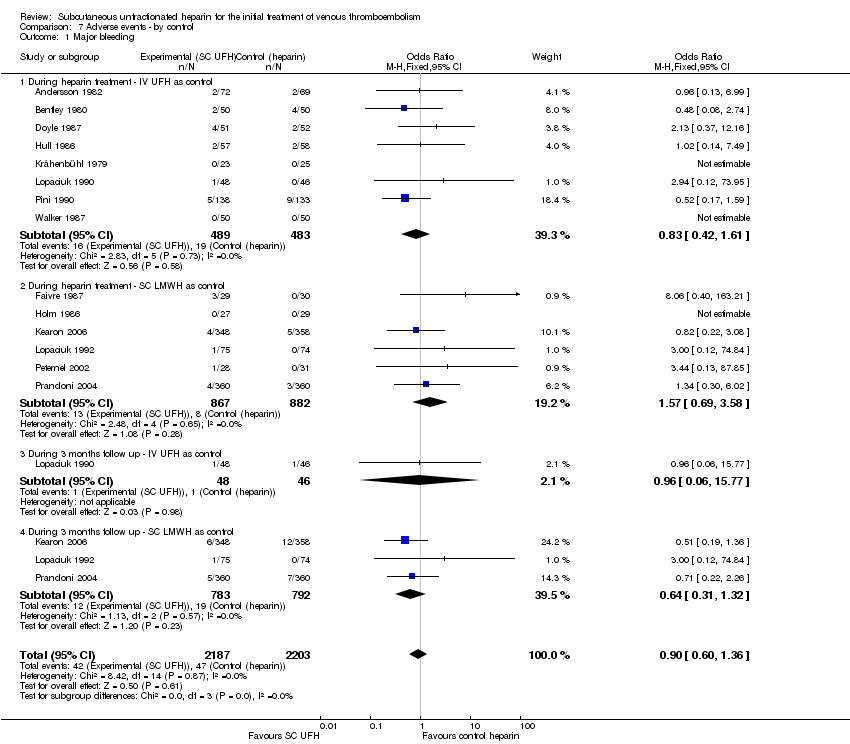
Comparison 7 Adverse events ‐ by control, Outcome 1 Major bleeding.
Figuras y tablas -
Analysis 7.1

Comparison 7 Adverse events ‐ by control, Outcome 1 Major bleeding.

Comparison 7 Adverse events ‐ by control, Outcome 2 Minor bleeding.
Figuras y tablas -
Analysis 7.2

Comparison 7 Adverse events ‐ by control, Outcome 2 Minor bleeding.

Comparison 7 Adverse events ‐ by control, Outcome 3 Platelet fall.
Figuras y tablas -
Analysis 7.3

Comparison 7 Adverse events ‐ by control, Outcome 3 Platelet fall.

Comparison 8 Death ‐ by control, Outcome 1 Total death.
Figuras y tablas -
Analysis 8.1

Comparison 8 Death ‐ by control, Outcome 1 Total death.

Comparison 8 Death ‐ by control, Outcome 2 VTE or bleeding‐related death.
Figuras y tablas -
Analysis 8.2

Comparison 8 Death ‐ by control, Outcome 2 VTE or bleeding‐related death.

Summary of findings for the main comparison. Subcutaneous unfractionated heparin compared to Other treatment modalities for Venous thromboembolism‐ clinical efficacy

Subcutaneous unfractionated heparin compared to Other treatment modalities for Venous thromboembolism‐ clinical efficacy

Patient or population: Venous thromboembolism‐ clinical efficacy
Settings:
Intervention: Subcutaneous unfractionated heparin
Comparison: Other treatment modalities

Outcomes

Illustrative comparative risks* (95% CI)

Relative effect
(95% CI)

No of Participants
(studies)

Quality of the evidence
(GRADE)

Comments

Assumed risk

Corresponding risk

Other treatment modalities

Subcutaneous unfractionated heparin

Recurrent DVT during 3 months follow up
Follow‐up: 0‐3 months

Medium risk population

OR 1.68
(0.92 to 3.04)

1628
(4 studies)

⊕⊕⊕⊝
moderate1

23 per 1000

38 per 1000
(21 to 67)

New clinical pulmonary embolism during heparin treatment
Follow‐up: 0‐10 days

Medium risk population

OR 1.1
(0.46 to 2.62)

958
(8 studies)

⊕⊕⊕⊝
moderate1

18 per 1000

20 per 1000
(8 to 46)

New clinical pulmonary embolism during 3 months follow up
Follow‐up: 0‐3 months

Medium risk population

OR 1.18
(0.54 to 2.56)

1626
(4 studies)

⊕⊕⊕⊝
moderate1

17 per 1000

20 per 1000
(9 to 42)

Major bleeding
Follow‐up: 0‐3 months

Medium risk population

OR 0.9
(0.6 to 1.36)

4390
(14 studies)

⊕⊝⊝⊝
very low

14 per 1000

13 per 1000
(8 to 19)

Minor bleeding
Follow‐up: 0‐3 months

Medium risk population

OR 0.98
(0.71 to 1.36)

2755
(10 studies)

⊕⊕⊕⊝
moderate

40 per 1000

39 per 1000
(29 to 54)

Total death ‐ During 3 months follow up (including acute phase)

Medium risk population

OR 1.02
(0.67 to 1.55)

1887
(6 studies)

⊕⊕⊕⊝
moderate

43 per 1000

44 per 1000
(29 to 65)

VTE or bleeding related death during 3 months follow‐up (including acute phase)
Follow‐up: 0‐3 months

Medium risk population

RD 0.0
(‐0.01 to 0.01)

2181
(7 studies)

⊕⊕⊕⊝
moderate

0 per 1000

0 per 1000
(0 to 0)

*The basis for the assumed risk (e.g. the median control group risk across studies) is provided in footnotes. The corresponding risk (and its 95% confidence interval) is based on the assumed risk in the comparison group and the relative effect of the intervention (and its 95% CI).
CI: Confidence interval; OR: Odds ratio;

GRADE Working Group grades of evidence
High quality: Further research is very unlikely to change our confidence in the estimate of effect.
Moderate quality: Further research is likely to have an important impact on our confidence in the estimate of effect and may change the estimate.
Low quality: Further research is very likely to have an important impact on our confidence in the estimate of effect and is likely to change the estimate.
Very low quality: We are very uncertain about the estimate.

1 Selection, performance, attrition and detection bias exist in some of the trials assessed.

Figuras y tablas -
Summary of findings for the main comparison. Subcutaneous unfractionated heparin compared to Other treatment modalities for Venous thromboembolism‐ clinical efficacy
Table 1. Overall quality of included studies ‐ three point scale

Study

Selection bias

Performance bias

Attrition bias

Detection bias

Overall quality

Andersson 1982

Unclear

No

No

No

C

Belcaro 1999

Unclear

Unclear

No

No

C

Bentley 1980

Yes

No

No

+/‐

C

Doyle 1987

Yes

No

No

+/‐

C

Faivre 1987

Unclear

No

No

+/‐

C

Holm 1986

Unclear

Yes

No

+/‐

C

Hull 1986

Yes

Yes

Unclear

Unclear

B

Kearon 2006

Yes

No

No

Yes

C

Krähenbühl 1979

Unclear

No

No

Yes

C

Lopaciuk 1990

Yes

No

No

Yes

C

Lopaciuk 1992

Unclear

No

No

Yes

C

Peternel 2002

Unclear

No

No

Unclear

C

Pini 1990

Unclear

No

No

Unclear

C

Prandoni 2004

Unclear

No

Yes

Yes

C

Walker 1987

Unclear

No

No

Yes

C

Figuras y tablas -
Table 1. Overall quality of included studies ‐ three point scale
Comparison 1. Clinical efficacy

Outcome or subgroup title

No. of studies

No. of participants

Statistical method

Effect size

1 DVT resolution (partial/full) ‐ end of heparin treatment Show forest plot

9

886

Odds Ratio (M‐H, Fixed, 95% CI)

1.40 [1.06, 1.84]

2 Recurrent DVT during 3 months follow up Show forest plot

4

1628

Odds Ratio (M‐H, Fixed, 95% CI)

1.68 [0.92, 3.04]

3 New clinical pulmonary embolism Show forest plot

11

Odds Ratio (M‐H, Fixed, 95% CI)

Subtotals only

3.1 During heparin treatment

8

958

Odds Ratio (M‐H, Fixed, 95% CI)

1.10 [0.46, 2.62]

3.2 During 3 months follow up

4

1626

Odds Ratio (M‐H, Fixed, 95% CI)

1.18 [0.54, 2.56]

4 New pulmonary embolism on routine lung scan ‐ end of heparin therapy Show forest plot

2

109

Odds Ratio (M‐H, Fixed, 95% CI)

0.84 [0.25, 2.81]

Figuras y tablas -
Comparison 1. Clinical efficacy
Comparison 2. Laboratory measures

Outcome or subgroup title

No. of studies

No. of participants

Statistical method

Effect size

1 Anticoagulation measures (aPTT, anti‐Xa) ‐ after titration Show forest plot

5

Std. Mean Difference (IV, Fixed, 95% CI)

Subtotals only

1.1 SC UFH vs. IV UFH

3

489

Std. Mean Difference (IV, Fixed, 95% CI)

‐0.14 [‐0.32, 0.04]

1.2 SC UFH vs. SC LMWH

2

92

Std. Mean Difference (IV, Fixed, 95% CI)

‐1.15 [‐1.61, ‐0.69]

2 Number of patients below therapeutic range Show forest plot

3

Odds Ratio (M‐H, Fixed, 95% CI)

Subtotals only

2.1 SC UFH vs. IV UFH

3

434

Odds Ratio (M‐H, Fixed, 95% CI)

1.31 [0.89, 1.92]

Figuras y tablas -
Comparison 2. Laboratory measures
Comparison 3. Adverse events

Outcome or subgroup title

No. of studies

No. of participants

Statistical method

Effect size

1 Major bleeding Show forest plot

14

4390

Odds Ratio (M‐H, Fixed, 95% CI)

0.90 [0.60, 1.36]

1.1 During heparin treatment

14

2721

Odds Ratio (M‐H, Fixed, 95% CI)

1.07 [0.64, 1.79]

1.2 During 3 months follow up (including acute phase)

4

1669

Odds Ratio (M‐H, Fixed, 95% CI)

0.66 [0.33, 1.32]

2 Minor bleeding Show forest plot

10

2755

Odds Ratio (M‐H, Fixed, 95% CI)

0.98 [0.71, 1.36]

2.1 During heparin treatment

10

1806

Odds Ratio (M‐H, Fixed, 95% CI)

1.01 [0.64, 1.59]

2.2 During 3 months follow up (including acute phase)

3

949

Odds Ratio (M‐H, Fixed, 95% CI)

0.96 [0.61, 1.52]

3 Platelet fall Show forest plot

5

1343

Odds Ratio (M‐H, Fixed, 95% CI)

1.12 [0.40, 3.11]

4 Hemoglobin fall Show forest plot

2

200

Odds Ratio (M‐H, Fixed, 95% CI)

0.74 [0.16, 3.41]

Figuras y tablas -
Comparison 3. Adverse events
Comparison 4. Death

Outcome or subgroup title

No. of studies

No. of participants

Statistical method

Effect size

1 Total death Show forest plot

10

Risk Difference (M‐H, Fixed, 95% CI)

Subtotals only

1.1 During heparin treatment

7

1349

Risk Difference (M‐H, Fixed, 95% CI)

0.00 [‐0.01, 0.01]

1.2 During 3 months follow up (including acute phase)

6

1887

Risk Difference (M‐H, Fixed, 95% CI)

0.00 [‐0.02, 0.02]

2 VTE or bleeding related death Show forest plot

13

Risk Difference (M‐H, Fixed, 95% CI)

Subtotals only

2.1 During heparin treatment

9

1549

Risk Difference (M‐H, Fixed, 95% CI)

‐0.00 [‐0.01, 0.01]

2.2 During 3 months follow up (including acute phase)

7

2181

Risk Difference (M‐H, Fixed, 95% CI)

‐0.00 [‐0.01, 0.01]

Figuras y tablas -
Comparison 4. Death
Comparison 5. Clinical efficacy ‐ by control

Outcome or subgroup title

No. of studies

No. of participants

Statistical method

Effect size

1 DVT resolution (partial/full) ‐ end of heparin treatment Show forest plot

9

886

Odds Ratio (M‐H, Fixed, 95% CI)

1.40 [1.06, 1.84]

1.1 IV UFH as control

6

641

Odds Ratio (M‐H, Fixed, 95% CI)

1.83 [1.31, 2.56]

1.2 SC LMWH as control

3

245

Odds Ratio (M‐H, Fixed, 95% CI)

0.76 [0.46, 1.26]

2 Recurrent DVT during 3 months follow up Show forest plot

4

1628

Odds Ratio (M‐H, Fixed, 95% CI)

1.68 [0.92, 3.04]

2.1 IV UFH as control

1

115

Odds Ratio (M‐H, Fixed, 95% CI)

3.29 [0.64, 17.06]

2.2 SC LMWH as control

3

1513

Odds Ratio (M‐H, Fixed, 95% CI)

1.49 [0.78, 2.84]

3 New clinical pulmonary embolism Show forest plot

11

Odds Ratio (M‐H, Fixed, 95% CI)

Subtotals only

3.1 During heparin treatment ‐ IV UFH as control

6

756

Odds Ratio (M‐H, Fixed, 95% CI)

1.11 [0.42, 2.92]

3.2 During heparin treatment ‐ SC LMWH as control

2

202

Odds Ratio (M‐H, Fixed, 95% CI)

1.05 [0.14, 7.63]

3.3 During 3 months follow up ‐ IV UFH as control

2

209

Odds Ratio (M‐H, Fixed, 95% CI)

3.11 [0.62, 15.61]

3.4 During 3 months follow up ‐ SC LMWH as control

2

1417

Odds Ratio (M‐H, Fixed, 95% CI)

0.80 [0.31, 2.05]

4 New pulmonary embolism on routine lung scan ‐ end of heparin therapy Show forest plot

2

109

Odds Ratio (M‐H, Fixed, 95% CI)

0.84 [0.25, 2.81]

Figuras y tablas -
Comparison 5. Clinical efficacy ‐ by control
Comparison 6. Laboratory measures ‐ by control

Outcome or subgroup title

No. of studies

No. of participants

Statistical method

Effect size

1 Anticoagulation measures (aPTT, anti‐Xa) ‐ after titration Show forest plot

5

Std. Mean Difference (IV, Fixed, 95% CI)

Subtotals only

1.1 SC UFH vs. IV UFH

3

489

Std. Mean Difference (IV, Fixed, 95% CI)

‐0.14 [‐0.32, 0.04]

1.2 SC UFH vs. SC LMWH

2

92

Std. Mean Difference (IV, Fixed, 95% CI)

‐1.15 [‐1.61, ‐0.69]

2 Number of patients below therapeutic range Show forest plot

3

434

Odds Ratio (M‐H, Fixed, 95% CI)

1.31 [0.89, 1.92]

2.1 SC UFH vs. IV UFHp

3

434

Odds Ratio (M‐H, Fixed, 95% CI)

1.31 [0.89, 1.92]

Figuras y tablas -
Comparison 6. Laboratory measures ‐ by control
Comparison 7. Adverse events ‐ by control

Outcome or subgroup title

No. of studies

No. of participants

Statistical method

Effect size

1 Major bleeding Show forest plot

14

4390

Odds Ratio (M‐H, Fixed, 95% CI)

0.90 [0.60, 1.36]

1.1 During heparin treatment ‐ IV UFH as control

8

972

Odds Ratio (M‐H, Fixed, 95% CI)

0.83 [0.42, 1.61]

1.2 During heparin treatment ‐ SC LMWH as control

6

1749

Odds Ratio (M‐H, Fixed, 95% CI)

1.57 [0.69, 3.58]

1.3 During 3 months follow up ‐ IV UFH as control

1

94

Odds Ratio (M‐H, Fixed, 95% CI)

0.96 [0.06, 15.77]

1.4 During 3 months follow up ‐ SC LMWH as control

3

1575

Odds Ratio (M‐H, Fixed, 95% CI)

0.64 [0.31, 1.32]

2 Minor bleeding Show forest plot

9

2461

Odds Ratio (M‐H, Fixed, 95% CI)

1.03 [0.74, 1.43]

2.1 During heparin treatment ‐ IV UFH as control

6

601

Odds Ratio (M‐H, Fixed, 95% CI)

0.64 [0.32, 1.27]

2.2 During heparin treatment ‐ SC LMWH as control

3

911

Odds Ratio (M‐H, Fixed, 95% CI)

1.94 [0.96, 3.89]

2.3 During 3 months follow up ‐ IV UFH as control

1

94

Odds Ratio (M‐H, Fixed, 95% CI)

3.0 [0.30, 29.94]

2.4 During 3 months follow up ‐ SC LMWH as control

2

855

Odds Ratio (M‐H, Fixed, 95% CI)

0.91 [0.56, 1.45]

3 Platelet fall Show forest plot

5

1343

Odds Ratio (M‐H, Fixed, 95% CI)

1.12 [0.40, 3.11]

3.1 IV UFH as control

3

465

Odds Ratio (M‐H, Fixed, 95% CI)

0.61 [0.15, 2.37]

3.2 SC LMWH as control

2

878

Odds Ratio (M‐H, Fixed, 95% CI)

2.98 [0.47, 18.95]

Figuras y tablas -
Comparison 7. Adverse events ‐ by control
Comparison 8. Death ‐ by control

Outcome or subgroup title

No. of studies

No. of participants

Statistical method

Effect size

1 Total death Show forest plot

10

Risk Difference (M‐H, Fixed, 95% CI)

Subtotals only

1.1 During heparin treatment

7

1349

Risk Difference (M‐H, Fixed, 95% CI)

0.00 [‐0.01, 0.01]

1.2 During 3 months follow up (including acute phase)

6

1887

Risk Difference (M‐H, Fixed, 95% CI)

0.00 [‐0.02, 0.02]

2 VTE or bleeding‐related death Show forest plot

12

Risk Difference (M‐H, Fixed, 95% CI)

Subtotals only

2.1 During heparin treatment

8

1490

Risk Difference (M‐H, Fixed, 95% CI)

‐0.00 [‐0.01, 0.01]

2.2 During 3 months follow up (including acute phase)

7

2181

Risk Difference (M‐H, Fixed, 95% CI)

‐0.00 [‐0.01, 0.01]

Figuras y tablas -
Comparison 8. Death ‐ by control