Subcutaneous unfractionated heparin for the initial treatment of venous thromboembolism
Referencias
References to studies included in this review
References to studies excluded from this review
Additional references
Characteristics of studies
Characteristics of included studies [ordered by study ID]
Ir a:
| Methods | Study design: Open randomised controlled trial Duration of intervention: at least 5 days to INR target Duration of follow up: Acute phase only Run‐in period: N/A Intention‐to‐treat analysis: no Language of publication: English. | |
| Participants | Who participated: Patients with acute DVT Country: Sweden Number of study centres: 3 Setting: In hospital Number: 141(SC UFH group 72; IV UFH group 69) Age mean (range): SC UFH group 64 (23 to 88); IV UFH group 64 (20 to 88) Sex (M/F): SC UFH group 47/25; IV UFH group 41/28 Inclusion criteria: Clinical signs of acute DVT Exclusion criteria: Not stated Diagnostic criteria: Phlebography, venous occlusion plethysmography, thermography | |
| Interventions | Intervention (route, total dose/day, frequency): IV UFH bolus dose (sodium heparin) (5000 IU/ml) followed by SC UFH (2,5000 IU/ml) BID aPTT adjusted + warfarin Control (route, total dose/day, frequency): IV UFH bolus dose (sodium heparin) (5000 IU/ml) followed by continuous IV UFH aPTT adjusted + warfarin Treatment before study: N/A Titration period: N/A | |
| Outcomes | Primary outcome: Therapeutic efficacy with repeat imaging Secondary outcomes: Bleeding, pulmonary emboli, aPTT, heparin dose | |
| Notes | Stated aim of the study: The therapeutic effect and number of complications in the two groups. | |
| Risk of bias | ||
| Bias | Authors' judgement | Support for judgement |
| Adequate sequence generation? | Unclear risk | Method not stated |
| Allocation concealment? | Unclear risk | Not stated |
| Blinding? | High risk | |
| Methods | Study design: Open randomised aPTT‐controlled trial Duration of intervention: 3 months for SC heparin; until INR target in LMWH and IV heparin Duration of follow up: 3 months Run‐in period: N/A Intention‐to‐treat analysis: no Language of publication: English | |
| Participants | Who participated: Patients with acute DVT Country: Italy (Chieti and Pescara), UK Number of study centres: 3 Setting: SC UFH ‐ outpatient; LMWH ‐ out/inpatient; IV UFH ‐ inpatient Number: 325 randomised, 294 completed the study (SC UFH 99; LMWH 98; IV UFH 97) Age (mean): SC UFH 54 ± 9; LMWH 54 ± 11; IV UFH 53 ± 10 Sex (M/F): SC UFH 52/47; LMWH 54/44; IV UFH 57/40 Inclusion criteria: Acute proximal DVT diagnosed by colour duplex ultrasonography Exclusion criteria: Two or more previous episodes of DVT or PE, current active bleeding, active ulcers, bleeding or coagulation disorder, concurrent PE, treatment for DVT with standard heparin > 48 hrs, home treatment not possible, neoplasia requiring surgery or chemotherapy in three months, likelihood of low compliance, pregnancy, Plt < 100,000 x 109/L Diagnostic criteria: Color duplex | |
| Interventions | Intervention (route, total dose/day, frequency): SC heparin (12,500 IU BID), fixed dose (no oral anticoagulation) administered exclusively at home Control (route, total dose/day, frequency): (1) LMWH (100Axa IU/kg BID) administred primarily at home + warfarin; (2) IV bolus (5000 IU) followed by continuous IV UFH aPTT adjusted + warfarin Treatment before study: N/A | |
| Outcomes | Outcomes not specified as primary or secondary Outcomes: Symptomatic or asymptomatic recurrent DVT or DVT extension at 3 months, bleeding during the administration of the study drug, PE, lenght of stay in hospital, number of patients treated directly at home without admission | |
| Notes | Stated aim of the study: To compare intravenous standard heparin (inhospital) with oral anticoagulant treatment to LMWH and oral anticoagulant treatment administrated primarily at home, to SC heparin administered at home. | |
| Risk of bias | ||
| Bias | Authors' judgement | Support for judgement |
| Adequate sequence generation? | Unclear risk | Method not stated |
| Allocation concealment? | Unclear risk | Method not stated |
| Blinding? | High risk | "Open randomised trial" |
| Methods | Study design: Open randomised controlled trial Duration of intervention: 7 days to INR target Duration of follow up: 7 days Run‐in period: N/A Intention‐to‐treat analysis: no Language of publication: English. | |
| Participants | Who participated: Patients with acute DVT Country: UK Number of study centres: 1 Setting: Inpatient Age (mean ± SD): SC UFH group 60.49 ± 14.32; IV UFH group 58.18 ± 12.66 Sex (M/F): not specified but describes "well matched for age, sex ..." Inclusion criteria: Acute calf DVT diagnosed by venography Exclusion criteria: Contraindication to heparin, thrombus extension < 5 cm Diagnostic criteria: Venography | |
| Interventions | Intervention (route, total dose/day, frequency): SC UFH (calcium heparin), initial dose 40000 IU/day followed by aPTT‐adjusted dose BID + warfarin Control (route, total dose/day, frequency): IV UFH (sodium heparin), initial dose 40000 IU/day followed by aPTT‐adjusted continous dose + warfarin Treatment before study: N/A | |
| Outcomes | Outcomes not specified as primary or secondary Outcomes: Cutaneous haematoma, macroscopic haematuria, major bleeding, DVT extension, new or extended PE, aPTT, heparin level | |
| Notes | Stated aim of the study: To compare the safety and efficacy of IV and SC heparin | |
| Risk of bias | ||
| Bias | Authors' judgement | Support for judgement |
| Adequate sequence generation? | Unclear risk | Method not stated |
| Allocation concealment? | Low risk | Sealed envelopes |
| Blinding? | High risk | |
| Methods | Study deisgn: Open randomised controlled trial Duration of intervention: 10 days Duration of follow up: 12 months Run‐in period: N/A Intention‐to‐treat analysis: no Language of publication: English. | |
| Participants | Who participated: Patients with acute DVT Country: Canada Number of study centres: 1 Setting: Inpatients Number: 103 SC UFH 51; IV UFH 52 Age mean (range): SC UFH 66.6 (31 to 96); IV UFH 64.6 (25 to 94) Sex (M/F): SC UFH 23/28; IV UFH 32/20 Inclusion criteria: Acute proximal or calf DVT diagnosed by venography Exclusion criteria: Clinically suspected PE, active peptic ulceration, bleeding disorder, no informed consent Diagnostic criteria: Venography | |
| Interventions | Intervention (route, total dose/day, frequency): SC UFH (calcium heparin), initial dose 15,000 IU, then BID, aPTT adjusted + warfarin Control (route, total dose/day, frequency): IV UFH (calcium heparin), initial dose 5,000 IU, then continuous, aPTT adjusted + warfarin Treatment before study: N/A | |
| Outcomes | Primary outcome: PE Secondary outcomes: Other lung scan abnormalities, bleeding, leg symptoms, death | |
| Notes | Stated aim of the study: To determine the effiacy and safety of adjusted SC calcium heparin compared with continuous IV calcium heparin as the initial treatment for acute DVT | |
| Risk of bias | ||
| Bias | Authors' judgement | Support for judgement |
| Adequate sequence generation? | Unclear risk | "prescribed randomised arrangement" |
| Allocation concealment? | Low risk | Sealed envelopes |
| Blinding? | High risk | |
| Methods | Study design: Randomised controlled trial Duration of intervention: 10 days Duration of follow up: 10 days Run‐in period: N/A Intention‐to‐treat analysis: no Language of publication: French | |
| Participants | Who participated: Patients with acute DVT and PE Country: France Number of study centres: 1 Setting: Inpatient Number: 68 SC UFH 35; SC LMWH 33 (number evaluated: 59 SC UFH 29; SC LMWH 30) Age (mean ±) : SC UFH 63.6 ± 16.2; SC LMWH 65.6 ± 14.8 Sex (M/F): 39/29 Inclusion criteria: Acute DVT or PE diagnosed with phlebography or perfusion‐ventilation scan Exclusion criteria: Over 2 weeks of symptoms, massive PE Diagnostic criteria: Phlebography and lung scan | |
| Interventions | Intervention (route, total dose/day, frequency): SC UFH (calcium heparin) 500 IU/kg/day BID, aPTT adjusted Control (route, total dose/day, frequency): SC LMWH 750 anti‐Xa/kg/day BID Treatment before study: N/A | |
| Outcomes | Outcomes not specified as primary or secondary Outcomes: DVT extension, bleeding, aPTT, anti‐Xa, anti‐IIa | |
| Notes | Stated aim of the study: To assess the efficacy and safety of CY222 for the treatment of DVT compared with SC heparin | |
| Risk of bias | ||
| Bias | Authors' judgement | Support for judgement |
| Adequate sequence generation? | Unclear risk | Method not stated |
| Allocation concealment? | Unclear risk | Not stated |
| Blinding? | Unclear risk | Not stated |
| Methods | Study design: Randomised double blind controlled trial Duration of intervention: 7 days Duration of follow up: 7 days Run‐in period: N/A Intention‐to‐treat analysis: no Language of publication: English. | |
| Participants | Who participated: Patients with acute DVT Country: Norway Number of study centres: 1 Setting: Inpatients Number: 56 (SC UFH 27; SC LMWH 29) Age mean (± SD): SC UFH 60 ± 15.8; SC LMWH 61 ±15.3 Sex (M/F): 33/23 (SC UFH 17/10; SC LMWH 16/13) Inclusion criteria: Acute DVT below the groin diagnosed by phlebography, with symptoms less than 14 days Exclusion criteria: PE, pregnancy, history of cerebral haemorrhage, surgery in previous 6 days, diastolic BP > 115 mmHg, retinal haemorrhage, impaired renal function, impaired PT Diagnostic criteria: Phlebography | |
| Interventions | Intervention (route, total dose/day, frequency): IV continuous infusion UFH for 24 hours, followed by SC UFH 10000‐15000 IU BID, anti‐Xa adjusted + warfarin Control (route, total dose/day, frequency): IV continuous infusion UFH for 24 hours, followed by SC LMWH 5000‐7500 IU BID, anti‐Xa adjusted + warfarin Treatment before study: N/A | |
| Outcomes | Outcomes not specified as primary or secondary Outcomes: DVT extension, new PE, anti‐Xa, bleeding, leg pain, death, Hgb, Plt | |
| Notes | Stated aim of the study: To compare subcutaneous heparin and LMWH for the treatment of DVT | |
| Risk of bias | ||
| Bias | Authors' judgement | Support for judgement |
| Adequate sequence generation? | Low risk | "the number of patient admission determining the number of vial used" |
| Allocation concealment? | Low risk | "vials randomised in advance and numbered consecutively" |
| Blinding? | Low risk | "phlebograms were blinded, randomly numbered and subjected to evaluation by 3 independent pairs of radiologists" |
| Methods | Study design: Randomised double blind controlled trial Duration of intervention: 10 days Duration of follow up: 3 months Run‐in period: N/A Intention‐to‐treat analysis: no Language of publication: English. | |
| Participants | Who participated: Patients with acute DVT Country: Canada Number of study centres: 1 Setting: Inpatients Number: 115 Age (< 60/> 60): SC UFH 10/4; 7 IV UFH 11/47 Sex (M/F): SC UFH 27/30; IV UFH 28/30 Inclusion criteria: Acute proximal (+/‐calf) DVT diagnosed by venography Exclusion criteria: Active bleeding, contraindication to heparin, already on heparin, no outpatient follow up available Diagnostic criteria: Venography | |
| Interventions | Intervention (route, total dose/day, frequency): IV UFH 5000 IU bolus followed by SC UFH 15000 BID, aPTT adjusted + warfarin Control (route, total dose/day, frequency): IV UFH 5000 IU bolus followed by continuous IV UFH aPTT adjusted + warfarin Treatment before study: N/A | |
| Outcomes | Outcomes not specified as primary or secondary Outcomes: Reccurent DVT, PE, bleeding, aPTT, death | |
| Notes | Stated aim of the study: Compare continuous IV heparin to intermittent SC heparin in the initial treatment of proximal DVT | |
| Risk of bias | ||
| Bias | Authors' judgement | Support for judgement |
| Adequate sequence generation? | Low risk | "Computer‐generated prescribed randomised arrangement" |
| Allocation concealment? | Low risk | "Masked pre‐labelled syringes and intravenous packs were used" |
| Blinding? | Low risk | Those patients assigned to IV heparin also received SC injections of placebo; those assigned to SC heparin also received IV infusion of placebo. |
| Methods | Study design: Open‐label, adjudicator‐blinded randomised controlled trial Duration of intervention: 5 days to INR target Duration of follow up: 3 months Run‐in period: N/A Intention‐to‐treat analysis: no Language of publication: English. | |
| Participants | Who participated: Patients with acute DVT or PE Country: Canada and New Zealand Number of study centres: 6 Setting: Inpatients and outpatients Number: 708 (SC UFH 355; SC LMWH 353) Age mean (SD): SC UFH 60 (17); SC LMWH 60 (16) Sex (M/F): SC UFH 182/173; SC LMWH 206/147 Inclusion criteria: 18 years or older with newly diagnosed DVT of the legs or PE diagnosed by compression ultrasonography or by venography, and by a high probability ventilation‐perfusion lung scan, by non diagnostic findings on lung scan accompanied by diagnostic findings for DVT, or by computed tomographic angiography. Exclusion criteria: Contraindication to subcutaneous therapy, such as shock or major surgery in the past 48 hours, had active bleeding, a life expectancy of less than 3 months, had already received acute treatment for venous thromboembolism for more than 48 hours, were receiving long term anticoagulant therapy, had a contraindication to heparin or to radiographic contrast, had a creatinine level of greater than 200 µmol/L (2.3 mg/dL), were pregnant, were enrolled in a competing study, or were unable to have follow‐up assessments because of geographic inaccessibility. Diagnostic criteria: Compression ultrasonography or by venography, and by a high probability ventilation‐perfusion lung scan, by non diagnostic findings on lung scan accompanied by diagnostic findings for deep vein thrombosis, or by computed tomographic angiography. | |
| Interventions | Intervention (route, total dose/day, frequency): SC UFH, initial 333 IU/kg followed by 250 IU/kg BID + warfarin Control (route, total dose/day, frequency): SC LMWH 100 IU/kg BID + warfarin Treatment before study: N/A | |
| Outcomes | Primary outcomes: The primary analysis for efficacy was the absolute difference in the proportion of eligible patients who had recurrent venous thromboembolism at 3 months. The primary analysis for safety was the absolute difference in the proportion of patients who received at least 1 dose of study drug who had an episode of major bleeding within 10 days of randomisation. Secondary outcomes: Reccurent VTE at 10 days, major or minor bleeding, death, aPTT | |
| Notes | Stated aim of the study: To determine if fixed‐dose, weight‐adjusted, subcutaneous unfractionated heparin is as effective and safe as low molecular‐weight heparin for treatment of venous thromboembolism. | |
| Risk of bias | ||
| Bias | Authors' judgement | Support for judgement |
| Adequate sequence generation? | Low risk | Computer generated |
| Allocation concealment? | Low risk | Clinical centres telephoned an automated centralised system |
| Blinding? | High risk | Open‐label but adjudicator blinded |
| Methods | Study design: Randomised controlled trial Duration of intervention: 7 days Duration of follow up: 6 weeks Run‐in period: N/A Intention‐to‐treat analysis: no Language of publication: French | |
| Participants | Who participated: Patients with acute DVT of the lower limb Country: Switzerland Number of study centres: 1 Setting: Inpatients Number: 48 (SC UFH 23; IV UFH 25) Age: not stated Sex (M/F): SC UFH 18/5; IV UFH13/12) Inclusion criteria: DVT of lower limbs diagnosed by phlebography or colour duplex US, with symptoms < 1 week Exclusion criteria: none stated Diagnostic criteria: Phlebography or color duplex ultrasound | |
| Interventions | Intervention (route, total dose/day, frequency): IV bolus UFH (sodium heparin) 5000 IU, followed by SC UFH 15,000U/day BID (aPTT adjusted) Control (route, total dose/day, frequency): IV bolus UFH (sodium heparin) 5000 IU followed by IV continuous UFH (aPTT adjusted) Treatment before study: N/A | |
| Outcomes | Outcomes not specified as primary or secondary Outcomes: Symptoms duration, DVT extension, PE, aPTT | |
| Notes | Stated aim of the study: To compare heparin administration methods | |
| Risk of bias | ||
| Bias | Authors' judgement | Support for judgement |
| Adequate sequence generation? | Low risk | Drawing of lots |
| Allocation concealment? | Unclear risk | Not stated |
| Blinding? | High risk | |
| Methods | Study design: Open randomised controlled trial Duration of intervention: 7 days Duration of follow up: 3 months Run‐in period: N/A Intention‐to‐treat analysis: no Language of publication: Polish. | |
| Participants | Who participated: Patients with acute proximal or calf DVT (with or without PE) Country: Poland Number of study centres: 5 Setting: Inpatients Number: 94 (SC UFH 48; IV UFH 46) Age: Sex (M/F): SC UFH 23/25; IV UFH 24/22 Inclusion criteria: Calf or proximal DVT diagnosed by phlebography, age 20 to 79 years Exclusion criteria: PE necessitating thrombolysis, gastric or doudenal ulcer Diagnostic criteria: Phlebography | |
| Interventions | Intervention (route, total dose/day, frequency): Bolus IV UFH (sodium heparin) 5000 IU, followed by SC UFH 500 IU/kg/day BID, aPTT adjusted + sintron (after 7 days) Control (route, total dose/day, frequency): Bolus IV UFH (sodium heparin) 5000 IU, followed by continuous IV UFH aPTT adjusted + sintron (after 7 days) Treatment before study: N/A | |
| Outcomes | Outcomes not specified as primary or secondary Outcomes: DVT extension, aPTT, Plt, PE, bleeding, death | |
| Notes | Stated aim of the study: To compare efficacy and safety of SC heparin versus IV heparin for DVT | |
| Risk of bias | ||
| Bias | Authors' judgement | Support for judgement |
| Adequate sequence generation? | Low risk | "Kopert method" |
| Allocation concealment? | Unclear risk | Not stated |
| Blinding? | High risk | |
| Methods | Study design: Open, stratified randomised controlled trial with blind evaluation of phlebographic results Duration of intervention: 10 days Duration of follow up: 3 months Run‐in period: N/A Intention‐to‐treat analysis: no Language of publication: English. | |
| Participants | Who participated: Patients with acute proximal or calf DVT Country: Poland Number of study centres: 6 Setting: Inpatients Number: 149 (SC UFH 75 (3 excluded from analysis); SC LMWH 74) Age (mean ± SD): SC UFH 47.8 ±15.4; SC LMWH 49.1 ± 15.4 Sex (M/F): SC UFH 42/30; SC LMWH 39/35 Inclusion criteria: Calf or proximal DVT diagnosed by phlebography, symptoms shorter than 10 days Exclusion criteria: Clinically suspected PE, phlegmasia caerulea dolens, treatment with anticoagulation prior to enrollment, VTE in previous 2 years, surgery or trauma in recent 3 days, contraindication to heparin, pregnancy, ATIII deficiency Diagnostic criteria: Phlebography (blind evaluation of phlebographic results) | |
| Interventions | Intervention (route, total dose/day, frequency): Bolus IV UFH 5000 IU, followed by SC UFH 250 IU/kg BID, aPTT adjusted + sintron Control (route, total dose/day, frequency): SC LMWH 225 IU/kg BID, fixed dose + sintron Treatment before study: N/A | |
| Outcomes | Outcomes not specified as primary or secondary Outcomes: DVT extension, reccurent DVT, PE, bleeding, death | |
| Notes | Stated aim of the study: To determine the efficacy and safety of subcutaneous LMWH compared with SC UFH as the initial treatment of DVT of the lower limbs | |
| Risk of bias | ||
| Bias | Authors' judgement | Support for judgement |
| Adequate sequence generation? | Unclear risk | Method not stated |
| Allocation concealment? | Low risk | Sealed envelopes |
| Blinding? | High risk | |
| Methods | Study design: Open randomised controlled trial Duration of intervention: To INR target Duration of follow up: 7 days Run‐in period: N/A Intention‐to‐treat analysis: no Language of publication: English. | |
| Participants | Who participated: Patients with acute proximal DVT Country: Slovenia Number of study centres: 1 Setting: Inpatients Number: 59 (SC UFH 28; SC LMWH 31) Age (years): SC UFH 68 ± 13; SC LMWH 69 ±14 Sex (M/F): SC UFH 15/13; SC LMWH 17/14 Inclusion criteria: Proximal DVT diagnosed by ultasound duplex Exclusion criteria: Anticoagulant treatment with heparin or coumarins in the period of 10 days before admission, clinically significant pulmonary embolism or pregnancy Diagnostic criteria: Ultrasound duplex | |
| Interventions | Intervention (route, total dose/day, frequency): Bolus IV UFH, followed by SC UFH BID or TID, aPTT adjusted + warfarin Control (route, total dose/day, frequency): SC LMWH 200 IU/kg QD + warfarin Treatment before study: N/A | |
| Outcomes | Outcomes not specified as primary or secondary Outcomes: Major bleeding, death, aPTT, haemostatic markers (F1+2, TAT, D‐dimer) | |
| Notes | Stated aim of the study: The aim of this study was to compare these markers in the acute phase of DVT during treatment either with subcutaneous aPTT‐adjusted UFH or with weight‐adjusted LMWH in order to estimate control of hemostatic system activation during both regimens | |
| Risk of bias | ||
| Bias | Authors' judgement | Support for judgement |
| Adequate sequence generation? | Unclear risk | Method not stated |
| Allocation concealment? | Unclear risk | Not stated |
| Blinding? | High risk | |
| Methods | Study design: Open randomised controlled trial Duration of intervention: 7 days Duration of follow up: 7 days Run‐in period: N/A Intention‐to‐treat analysis: no Language of publication: English | |
| Participants | Who participated: Patients with acute DVT Country: Italy Number of study centres: 1 Setting: Inpatients Number: 271(SC UFH 138; IV UFH 133) Age mean (range): SC UFH 63.4 (16 to 87); IV UFH 60.9 (11 to 86) Sex (M/F): SC UFH 83/55; IV UFH 72/61 Inclusion criteria: Acute DVT diagnosed with strain‐gauge plethysmography or venography Exclusion criteria: Bleeding disorder, abnormal results in hemostatic function screening tests, active peptic disease, on heparin treatment + acenocoumarol Diagnostic criteria: Plethysmography or venography in diagnosis not concluded | |
| Interventions | Intervention (route, total dose/day, frequency): SC UFH (calcium heparin) 250 U/kg BID + acenocoumarol Control (route, total dose/day, frequency): IV UFH (sodium heparin bolus) followed by continuous IV UFH 500 U/Kg/day + acenocoumarol Treatment before study: N/A | |
| Outcomes | Outcomes not specified as primary or secondary Outcomes: DVT extension, PE, death, bleeding | |
| Notes | Stated aim of the study: To compare IV and SC heparin for acute DVT in a large population study | |
| Risk of bias | ||
| Bias | Authors' judgement | Support for judgement |
| Adequate sequence generation? | Low risk | "Patients were assigned by computer‐generated random numbers" |
| Allocation concealment? | Unclear risk | Not stated |
| Blinding? | High risk | |
| Methods | Study design: Open randomised controlled trial Duration of intervention: 5 days to INR Duration of follow up: 3 months Run‐in period: N/A Intention‐to‐treat analysis: yes Language of publication: English. | |
| Participants | Who participated: Patients with acute VTE (DVT+PE) Number of study centres: 19 Setting: Inpatients Number: 720 (SC UFH 360; SC LMWH 360) Age (mean ± SD): SC UFH 65.7 ± 15.6; SC LMWH 67.0 ± 14.8 Sex M/F: SC UFH 158/202; SC LMWH 167/193 Inclusion criteria: Patients with DVT of the lower extremities and/or PE were eligible for the study, provided that the suspicion was objectively confirmed. Exclusion criteria: Age less than 18 years, pregnancy, contraindications to anticoagulant treatment, full‐dose anticoagulant treatment (either heparin or oral anticoagulants) for more than 24 hours, hemodynamic instability, previous (less than 1 year earlier) episode of VTE, life expectancy less than 3 months, poor compliance, and geographic inaccessibility for follow‐up. Diagnostic criteria: A positive result of at least 1 of the following tests was accepted for patient inclusion: ascending phlebography, compression ultrasound of the proximal vein system, echo color Doppler scan of the calf vein system in the case of clinical suspicion of DVT, ventilation‐perfusion scanning, spiral computed tomographic scanning, and pulmonary angiography in the case of clinical suspicion of PE. In the presence of abnormal results of an ultrasound test of the lower extremities, the diagnosis of PE was also accepted if a perfusion lung scan was compatible with a high probability of PE when compared with the chest x‐ray. | |
| Interventions | Intervention (route, total dose/day, frequency): IV bolus UFH (calcium heparin) 4000‐5000 IU followed by SC UFH BID, aPTT adjusted + warfarin Control (route, total dose/day, frequency): SC LMWH 85 U/kg BID + warfarin Treatment before study: N/A | |
| Outcomes | Primary outcome: Reccurent VTE at 3 month follow up Secondary outcomes: Reccurent VTE during heparin treatment, bleeding during heparin treatment, death | |
| Notes | Stated aim of the study: The value of UFH or LMWH in treating the full spectrum of patients with VTE, including recurrent VTE and PE. | |
| Risk of bias | ||
| Bias | Authors' judgement | Support for judgement |
| Adequate sequence generation? | Low risk | Computer generated |
| Allocation concealment? | Low risk | "24‐hour telephone service that recorded patient information before disclosure of the treatment assigned" |
| Blinding? | High risk | Open trial |
| Methods | Study design: Open randomised controlled trial Duration of intervention: 14 days Duration of follow up: 14 days Run‐in period: N/A Intention‐to‐treat analysis: no Language of publication: English | |
| Participants | Who participated: Patients with acute lower limb DVT Country: UK Number of study centres: 5 Setting: Inpatients Number: 100 (SC UFH 50; IV continuous UFH 50) Age mean (SD): SC UFH M 61 (11), F 63 (16); IV continuous UFH M 60 (14), F 63 (15) Sex (M/F): SC UFH 25/25; IV continuous UFH 28/22 Inclusion criteria: Patients with DVT of the legs (calf + proximal), phlebography proven, with a thrombus > 5 cm Exclusion criteria: PE or occlusive thrombus Diagnostic criteria: Phlebography | |
| Interventions | Intervention (route, total dose/day, frequency): SC UFH (calcium heparin) 250 U/kg, aPTT adjusted + warfarin Control (route, total dose/day, frequency): IV continuous UFH (sodium heparin) aPTT adjusted + warfarin Treatment before study: N/A | |
| Outcomes | Outcomes not specified as primary or secondary Outcomes: DVT extension, injection site pain, PE, Hgb, Plt, aPTT | |
| Notes | Stated aim of the study: To compare the efficacy and safety of SC versus IV heparin for leg DVT | |
| Risk of bias | ||
| Bias | Authors' judgement | Support for judgement |
| Adequate sequence generation? | Low risk | Random number table |
| Allocation concealment? | Low risk | Sealed envelopes |
| Blinding? | High risk | |
aPTT: activated partial thromboplastin time
AT: antithrombin
BID: twice daily
BP: blood pressure
DVT: deep vein thrombosis
Hgb: haemoglobin
INR: international normalised ratio
IU: international units
IV: intravenous
LMWH: low molecular weight heparin
N/A: not applicable
PE: pulmonary embolism
Plt: platelets
QD: four times per day
SC: subcutaneous
UFH: unfractionated heparin
US: ultrasound
VTE: venous thromboembolism
Characteristics of excluded studies [ordered by study ID]
Ir a:
| Study | Reason for exclusion |
| RCT comparing continuous versus intermittent Intraveneous heparin administration in patients diagnosed with DVT | |
| RCT comparing continuous versus intermittent Intraveneous heparin administration in patients with PE | |
| RCT comparing subcutaneous heparin and dextran for the prophylaxis of VTE | |
| RCT comparing subcutaneous LMWH with subcutaneous UFH for the prophylaxis of VTE | |
| RCT comparing Intraveneous UFH with intravenous LMWH in patients diagnosed with DVT | |
| RCT of patients diagnosed with superficial vein thrombosis | |
| RCT comparing long term treatment of patients with VTE |
DVT: deep vein thrombosis
LMWH: low molecular weight heparin
PE: pulmonary embolism
RCT: randomised controlled trial
VTE: venous thromboembolism
Data and analyses
| Outcome or subgroup title | No. of studies | No. of participants | Statistical method | Effect size |
| 1 DVT resolution (partial/full) ‐ end of heparin treatment Show forest plot | 9 | 886 | Odds Ratio (M‐H, Fixed, 95% CI) | 1.40 [1.06, 1.84] |
| Analysis 1.1  Comparison 1 Clinical efficacy, Outcome 1 DVT resolution (partial/full) ‐ end of heparin treatment. | ||||
| 2 Recurrent DVT during 3 months follow up Show forest plot | 4 | 1628 | Odds Ratio (M‐H, Fixed, 95% CI) | 1.68 [0.92, 3.04] |
| Analysis 1.2  Comparison 1 Clinical efficacy, Outcome 2 Recurrent DVT during 3 months follow up. | ||||
| 3 New clinical pulmonary embolism Show forest plot | 11 | Odds Ratio (M‐H, Fixed, 95% CI) | Subtotals only | |
| Analysis 1.3  Comparison 1 Clinical efficacy, Outcome 3 New clinical pulmonary embolism. | ||||
| 3.1 During heparin treatment | 8 | 958 | Odds Ratio (M‐H, Fixed, 95% CI) | 1.10 [0.46, 2.62] |
| 3.2 During 3 months follow up | 4 | 1626 | Odds Ratio (M‐H, Fixed, 95% CI) | 1.18 [0.54, 2.56] |
| 4 New pulmonary embolism on routine lung scan ‐ end of heparin therapy Show forest plot | 2 | 109 | Odds Ratio (M‐H, Fixed, 95% CI) | 0.84 [0.25, 2.81] |
| Analysis 1.4  Comparison 1 Clinical efficacy, Outcome 4 New pulmonary embolism on routine lung scan ‐ end of heparin therapy. | ||||
| Outcome or subgroup title | No. of studies | No. of participants | Statistical method | Effect size |
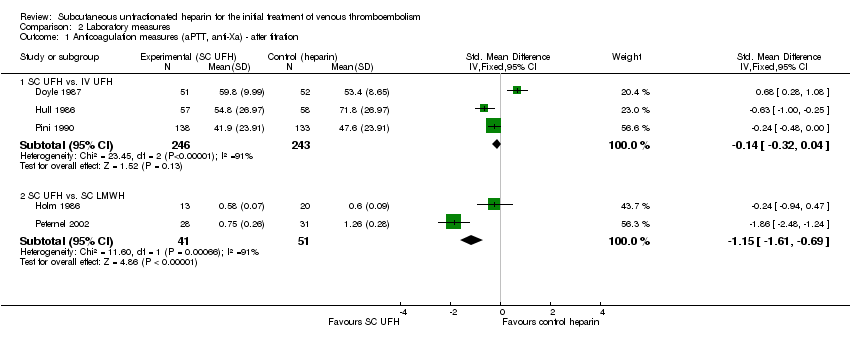
| 1 Anticoagulation measures (aPTT, anti‐Xa) ‐ after titration Show forest plot | 5 | Std. Mean Difference (IV, Fixed, 95% CI) | Subtotals only | |
| Analysis 2.1  Comparison 2 Laboratory measures, Outcome 1 Anticoagulation measures (aPTT, anti‐Xa) ‐ after titration. | ||||
| 1.1 SC UFH vs. IV UFH | 3 | 489 | Std. Mean Difference (IV, Fixed, 95% CI) | ‐0.14 [‐0.32, 0.04] |
| 1.2 SC UFH vs. SC LMWH | 2 | 92 | Std. Mean Difference (IV, Fixed, 95% CI) | ‐1.15 [‐1.61, ‐0.69] |
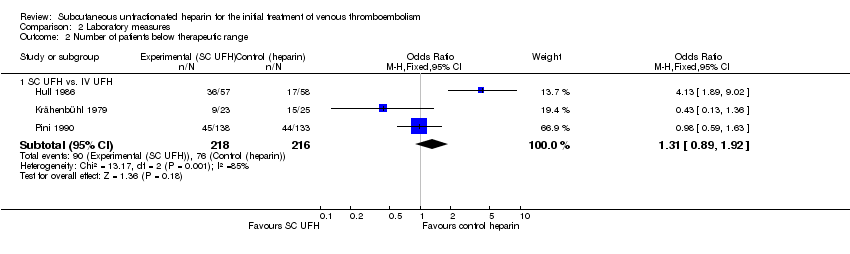
| 2 Number of patients below therapeutic range Show forest plot | 3 | Odds Ratio (M‐H, Fixed, 95% CI) | Subtotals only | |
| Analysis 2.2  Comparison 2 Laboratory measures, Outcome 2 Number of patients below therapeutic range. | ||||
| 2.1 SC UFH vs. IV UFH | 3 | 434 | Odds Ratio (M‐H, Fixed, 95% CI) | 1.31 [0.89, 1.92] |
| Outcome or subgroup title | No. of studies | No. of participants | Statistical method | Effect size |
| 1 Major bleeding Show forest plot | 14 | 4390 | Odds Ratio (M‐H, Fixed, 95% CI) | 0.90 [0.60, 1.36] |
| Analysis 3.1  Comparison 3 Adverse events, Outcome 1 Major bleeding. | ||||
| 1.1 During heparin treatment | 14 | 2721 | Odds Ratio (M‐H, Fixed, 95% CI) | 1.07 [0.64, 1.79] |
| 1.2 During 3 months follow up (including acute phase) | 4 | 1669 | Odds Ratio (M‐H, Fixed, 95% CI) | 0.66 [0.33, 1.32] |
| 2 Minor bleeding Show forest plot | 10 | 2755 | Odds Ratio (M‐H, Fixed, 95% CI) | 0.98 [0.71, 1.36] |
| Analysis 3.2  Comparison 3 Adverse events, Outcome 2 Minor bleeding. | ||||
| 2.1 During heparin treatment | 10 | 1806 | Odds Ratio (M‐H, Fixed, 95% CI) | 1.01 [0.64, 1.59] |
| 2.2 During 3 months follow up (including acute phase) | 3 | 949 | Odds Ratio (M‐H, Fixed, 95% CI) | 0.96 [0.61, 1.52] |
| 3 Platelet fall Show forest plot | 5 | 1343 | Odds Ratio (M‐H, Fixed, 95% CI) | 1.12 [0.40, 3.11] |
| Analysis 3.3  Comparison 3 Adverse events, Outcome 3 Platelet fall. | ||||
| 4 Hemoglobin fall Show forest plot | 2 | 200 | Odds Ratio (M‐H, Fixed, 95% CI) | 0.74 [0.16, 3.41] |
| Analysis 3.4  Comparison 3 Adverse events, Outcome 4 Hemoglobin fall. | ||||
| Outcome or subgroup title | No. of studies | No. of participants | Statistical method | Effect size |
| 1 Total death Show forest plot | 10 | Risk Difference (M‐H, Fixed, 95% CI) | Subtotals only | |
| Analysis 4.1  Comparison 4 Death, Outcome 1 Total death. | ||||
| 1.1 During heparin treatment | 7 | 1349 | Risk Difference (M‐H, Fixed, 95% CI) | 0.00 [‐0.01, 0.01] |
| 1.2 During 3 months follow up (including acute phase) | 6 | 1887 | Risk Difference (M‐H, Fixed, 95% CI) | 0.00 [‐0.02, 0.02] |
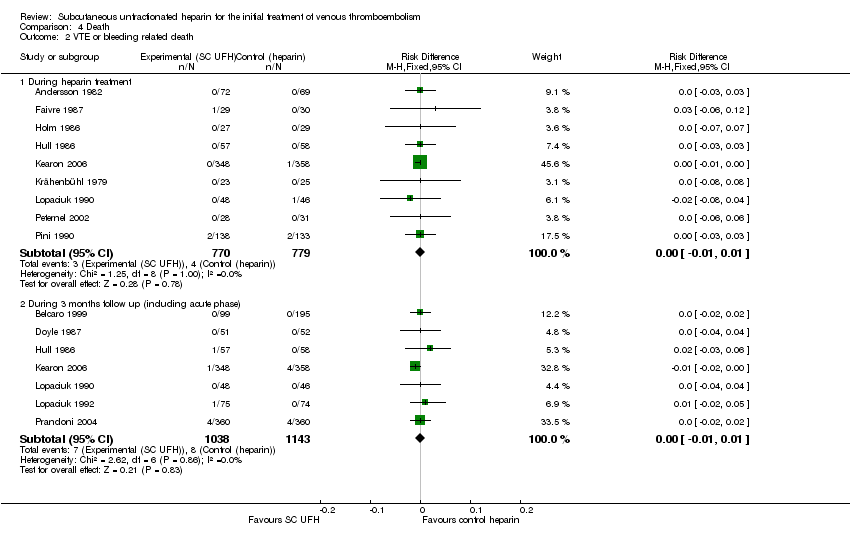
| 2 VTE or bleeding related death Show forest plot | 13 | Risk Difference (M‐H, Fixed, 95% CI) | Subtotals only | |
| Analysis 4.2  Comparison 4 Death, Outcome 2 VTE or bleeding related death. | ||||
| 2.1 During heparin treatment | 9 | 1549 | Risk Difference (M‐H, Fixed, 95% CI) | ‐0.00 [‐0.01, 0.01] |
| 2.2 During 3 months follow up (including acute phase) | 7 | 2181 | Risk Difference (M‐H, Fixed, 95% CI) | ‐0.00 [‐0.01, 0.01] |
| Outcome or subgroup title | No. of studies | No. of participants | Statistical method | Effect size |
| 1 DVT resolution (partial/full) ‐ end of heparin treatment Show forest plot | 9 | 886 | Odds Ratio (M‐H, Fixed, 95% CI) | 1.40 [1.06, 1.84] |
| Analysis 5.1  Comparison 5 Clinical efficacy ‐ by control, Outcome 1 DVT resolution (partial/full) ‐ end of heparin treatment. | ||||
| 1.1 IV UFH as control | 6 | 641 | Odds Ratio (M‐H, Fixed, 95% CI) | 1.83 [1.31, 2.56] |
| 1.2 SC LMWH as control | 3 | 245 | Odds Ratio (M‐H, Fixed, 95% CI) | 0.76 [0.46, 1.26] |
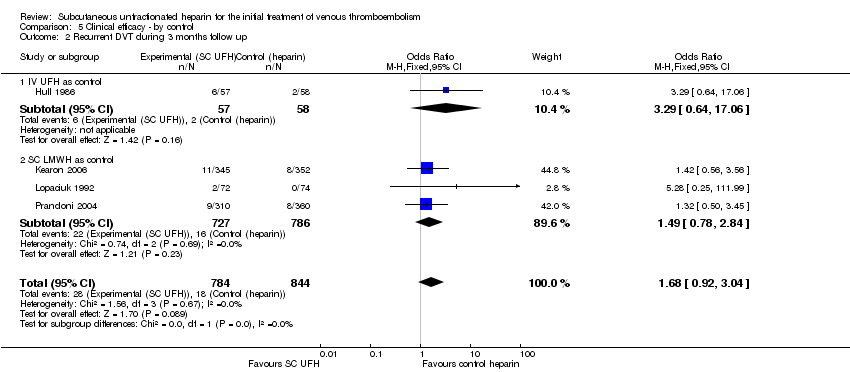
| 2 Recurrent DVT during 3 months follow up Show forest plot | 4 | 1628 | Odds Ratio (M‐H, Fixed, 95% CI) | 1.68 [0.92, 3.04] |
| Analysis 5.2  Comparison 5 Clinical efficacy ‐ by control, Outcome 2 Recurrent DVT during 3 months follow up. | ||||
| 2.1 IV UFH as control | 1 | 115 | Odds Ratio (M‐H, Fixed, 95% CI) | 3.29 [0.64, 17.06] |
| 2.2 SC LMWH as control | 3 | 1513 | Odds Ratio (M‐H, Fixed, 95% CI) | 1.49 [0.78, 2.84] |
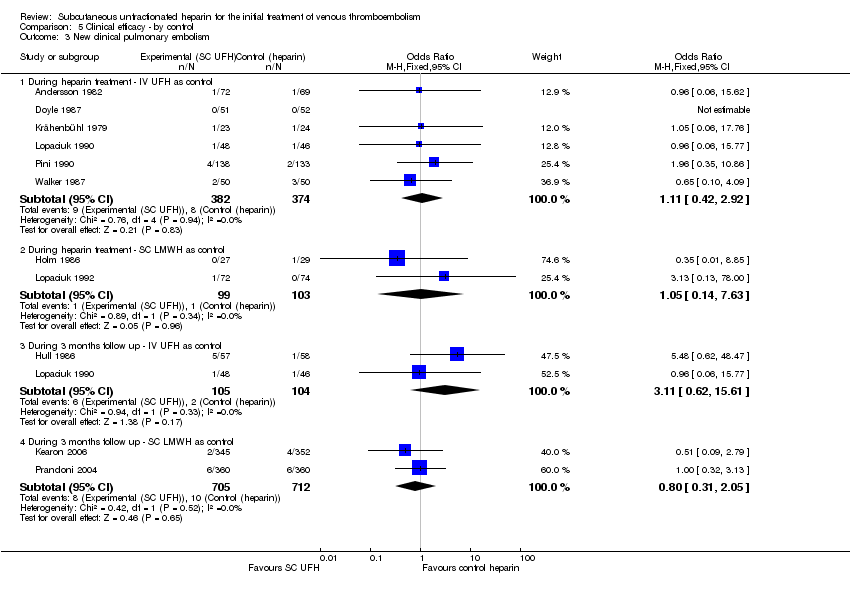
| 3 New clinical pulmonary embolism Show forest plot | 11 | Odds Ratio (M‐H, Fixed, 95% CI) | Subtotals only | |
| Analysis 5.3  Comparison 5 Clinical efficacy ‐ by control, Outcome 3 New clinical pulmonary embolism. | ||||
| 3.1 During heparin treatment ‐ IV UFH as control | 6 | 756 | Odds Ratio (M‐H, Fixed, 95% CI) | 1.11 [0.42, 2.92] |
| 3.2 During heparin treatment ‐ SC LMWH as control | 2 | 202 | Odds Ratio (M‐H, Fixed, 95% CI) | 1.05 [0.14, 7.63] |
| 3.3 During 3 months follow up ‐ IV UFH as control | 2 | 209 | Odds Ratio (M‐H, Fixed, 95% CI) | 3.11 [0.62, 15.61] |
| 3.4 During 3 months follow up ‐ SC LMWH as control | 2 | 1417 | Odds Ratio (M‐H, Fixed, 95% CI) | 0.80 [0.31, 2.05] |
| 4 New pulmonary embolism on routine lung scan ‐ end of heparin therapy Show forest plot | 2 | 109 | Odds Ratio (M‐H, Fixed, 95% CI) | 0.84 [0.25, 2.81] |
| Analysis 5.4  Comparison 5 Clinical efficacy ‐ by control, Outcome 4 New pulmonary embolism on routine lung scan ‐ end of heparin therapy. | ||||
| Outcome or subgroup title | No. of studies | No. of participants | Statistical method | Effect size |
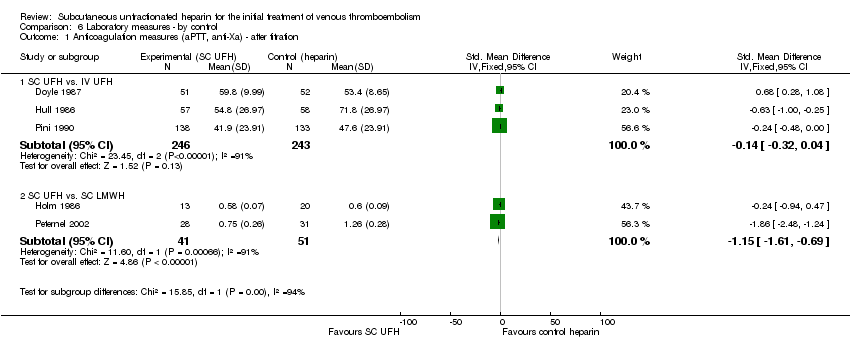
| 1 Anticoagulation measures (aPTT, anti‐Xa) ‐ after titration Show forest plot | 5 | Std. Mean Difference (IV, Fixed, 95% CI) | Subtotals only | |
| Analysis 6.1  Comparison 6 Laboratory measures ‐ by control, Outcome 1 Anticoagulation measures (aPTT, anti‐Xa) ‐ after titration. | ||||
| 1.1 SC UFH vs. IV UFH | 3 | 489 | Std. Mean Difference (IV, Fixed, 95% CI) | ‐0.14 [‐0.32, 0.04] |
| 1.2 SC UFH vs. SC LMWH | 2 | 92 | Std. Mean Difference (IV, Fixed, 95% CI) | ‐1.15 [‐1.61, ‐0.69] |
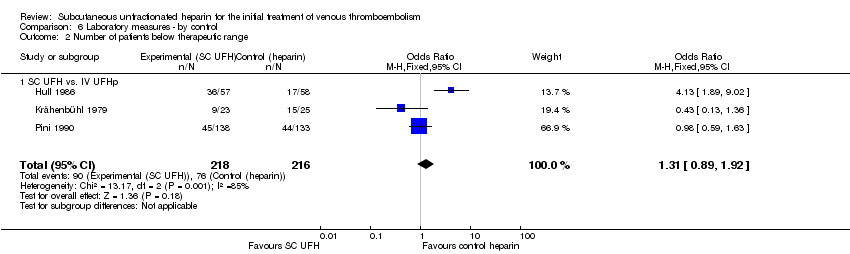
| 2 Number of patients below therapeutic range Show forest plot | 3 | 434 | Odds Ratio (M‐H, Fixed, 95% CI) | 1.31 [0.89, 1.92] |
| Analysis 6.2  Comparison 6 Laboratory measures ‐ by control, Outcome 2 Number of patients below therapeutic range. | ||||
| 2.1 SC UFH vs. IV UFHp | 3 | 434 | Odds Ratio (M‐H, Fixed, 95% CI) | 1.31 [0.89, 1.92] |
| Outcome or subgroup title | No. of studies | No. of participants | Statistical method | Effect size |
| 1 Major bleeding Show forest plot | 14 | 4390 | Odds Ratio (M‐H, Fixed, 95% CI) | 0.90 [0.60, 1.36] |
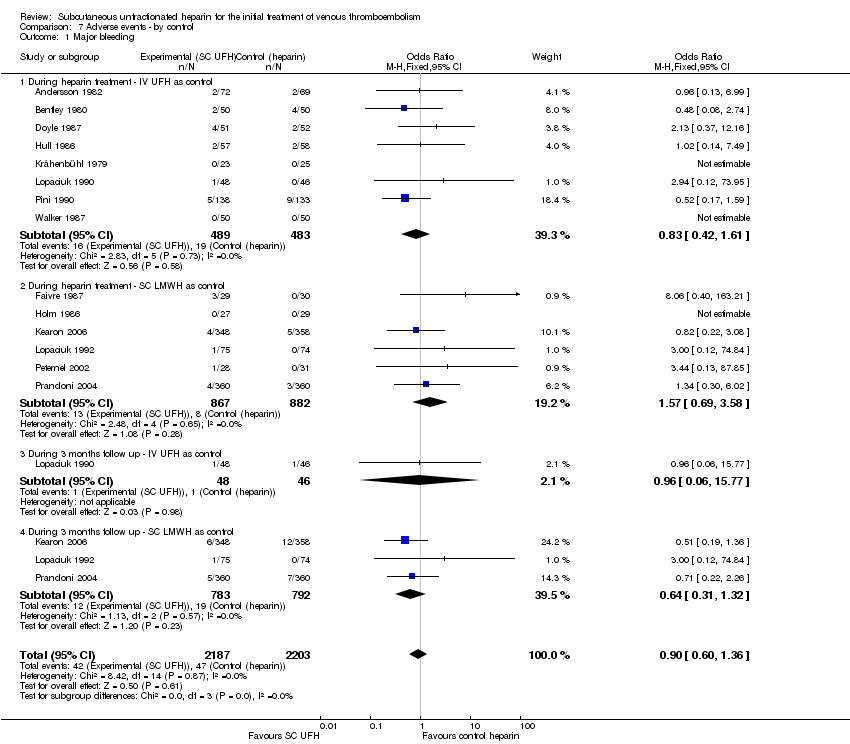
| Analysis 7.1  Comparison 7 Adverse events ‐ by control, Outcome 1 Major bleeding. | ||||
| 1.1 During heparin treatment ‐ IV UFH as control | 8 | 972 | Odds Ratio (M‐H, Fixed, 95% CI) | 0.83 [0.42, 1.61] |
| 1.2 During heparin treatment ‐ SC LMWH as control | 6 | 1749 | Odds Ratio (M‐H, Fixed, 95% CI) | 1.57 [0.69, 3.58] |
| 1.3 During 3 months follow up ‐ IV UFH as control | 1 | 94 | Odds Ratio (M‐H, Fixed, 95% CI) | 0.96 [0.06, 15.77] |
| 1.4 During 3 months follow up ‐ SC LMWH as control | 3 | 1575 | Odds Ratio (M‐H, Fixed, 95% CI) | 0.64 [0.31, 1.32] |
| 2 Minor bleeding Show forest plot | 9 | 2461 | Odds Ratio (M‐H, Fixed, 95% CI) | 1.03 [0.74, 1.43] |
| Analysis 7.2  Comparison 7 Adverse events ‐ by control, Outcome 2 Minor bleeding. | ||||
| 2.1 During heparin treatment ‐ IV UFH as control | 6 | 601 | Odds Ratio (M‐H, Fixed, 95% CI) | 0.64 [0.32, 1.27] |
| 2.2 During heparin treatment ‐ SC LMWH as control | 3 | 911 | Odds Ratio (M‐H, Fixed, 95% CI) | 1.94 [0.96, 3.89] |
| 2.3 During 3 months follow up ‐ IV UFH as control | 1 | 94 | Odds Ratio (M‐H, Fixed, 95% CI) | 3.0 [0.30, 29.94] |
| 2.4 During 3 months follow up ‐ SC LMWH as control | 2 | 855 | Odds Ratio (M‐H, Fixed, 95% CI) | 0.91 [0.56, 1.45] |
| 3 Platelet fall Show forest plot | 5 | 1343 | Odds Ratio (M‐H, Fixed, 95% CI) | 1.12 [0.40, 3.11] |
| Analysis 7.3  Comparison 7 Adverse events ‐ by control, Outcome 3 Platelet fall. | ||||
| 3.1 IV UFH as control | 3 | 465 | Odds Ratio (M‐H, Fixed, 95% CI) | 0.61 [0.15, 2.37] |
| 3.2 SC LMWH as control | 2 | 878 | Odds Ratio (M‐H, Fixed, 95% CI) | 2.98 [0.47, 18.95] |
| Outcome or subgroup title | No. of studies | No. of participants | Statistical method | Effect size |
| 1 Total death Show forest plot | 10 | Risk Difference (M‐H, Fixed, 95% CI) | Subtotals only | |
| Analysis 8.1  Comparison 8 Death ‐ by control, Outcome 1 Total death. | ||||
| 1.1 During heparin treatment | 7 | 1349 | Risk Difference (M‐H, Fixed, 95% CI) | 0.00 [‐0.01, 0.01] |
| 1.2 During 3 months follow up (including acute phase) | 6 | 1887 | Risk Difference (M‐H, Fixed, 95% CI) | 0.00 [‐0.02, 0.02] |
| 2 VTE or bleeding‐related death Show forest plot | 12 | Risk Difference (M‐H, Fixed, 95% CI) | Subtotals only | |
| Analysis 8.2  Comparison 8 Death ‐ by control, Outcome 2 VTE or bleeding‐related death. | ||||
| 2.1 During heparin treatment | 8 | 1490 | Risk Difference (M‐H, Fixed, 95% CI) | ‐0.00 [‐0.01, 0.01] |
| 2.2 During 3 months follow up (including acute phase) | 7 | 2181 | Risk Difference (M‐H, Fixed, 95% CI) | ‐0.00 [‐0.01, 0.01] |

Adapted QUOROM flow chart of studies selection
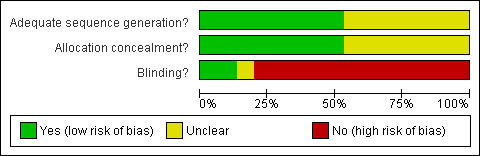
Methodological quality graph: review authors' judgements about each methodological quality item presented as percentages across all included studies.

Methodological quality summary: review authors' judgements about each methodological quality item for each included study.

Funnel plot of comparison: Recurrent DVT during 3 months follow up.

Funnel plot of comparison: New clinical pulmonary embolism.

Comparison 1 Clinical efficacy, Outcome 1 DVT resolution (partial/full) ‐ end of heparin treatment.

Comparison 1 Clinical efficacy, Outcome 2 Recurrent DVT during 3 months follow up.

Comparison 1 Clinical efficacy, Outcome 3 New clinical pulmonary embolism.

Comparison 1 Clinical efficacy, Outcome 4 New pulmonary embolism on routine lung scan ‐ end of heparin therapy.
Comparison 2 Laboratory measures, Outcome 1 Anticoagulation measures (aPTT, anti‐Xa) ‐ after titration.
Comparison 2 Laboratory measures, Outcome 2 Number of patients below therapeutic range.

Comparison 3 Adverse events, Outcome 1 Major bleeding.

Comparison 3 Adverse events, Outcome 2 Minor bleeding.

Comparison 3 Adverse events, Outcome 3 Platelet fall.

Comparison 3 Adverse events, Outcome 4 Hemoglobin fall.

Comparison 4 Death, Outcome 1 Total death.
Comparison 4 Death, Outcome 2 VTE or bleeding related death.

Comparison 5 Clinical efficacy ‐ by control, Outcome 1 DVT resolution (partial/full) ‐ end of heparin treatment.
Comparison 5 Clinical efficacy ‐ by control, Outcome 2 Recurrent DVT during 3 months follow up.
Comparison 5 Clinical efficacy ‐ by control, Outcome 3 New clinical pulmonary embolism.

Comparison 5 Clinical efficacy ‐ by control, Outcome 4 New pulmonary embolism on routine lung scan ‐ end of heparin therapy.
Comparison 6 Laboratory measures ‐ by control, Outcome 1 Anticoagulation measures (aPTT, anti‐Xa) ‐ after titration.
Comparison 6 Laboratory measures ‐ by control, Outcome 2 Number of patients below therapeutic range.
Comparison 7 Adverse events ‐ by control, Outcome 1 Major bleeding.

Comparison 7 Adverse events ‐ by control, Outcome 2 Minor bleeding.

Comparison 7 Adverse events ‐ by control, Outcome 3 Platelet fall.

Comparison 8 Death ‐ by control, Outcome 1 Total death.

Comparison 8 Death ‐ by control, Outcome 2 VTE or bleeding‐related death.
| Subcutaneous unfractionated heparin compared to Other treatment modalities for Venous thromboembolism‐ clinical efficacy | ||||||
| Patient or population: Venous thromboembolism‐ clinical efficacy | ||||||
| Outcomes | Illustrative comparative risks* (95% CI) | Relative effect | No of Participants | Quality of the evidence | Comments | |
| Assumed risk | Corresponding risk | |||||
| Other treatment modalities | Subcutaneous unfractionated heparin | |||||
| Recurrent DVT during 3 months follow up | Medium risk population | OR 1.68 | 1628 | ⊕⊕⊕⊝ | ||
| 23 per 1000 | 38 per 1000 | |||||
| New clinical pulmonary embolism during heparin treatment | Medium risk population | OR 1.1 | 958 | ⊕⊕⊕⊝ | ||
| 18 per 1000 | 20 per 1000 | |||||
| New clinical pulmonary embolism during 3 months follow up | Medium risk population | OR 1.18 | 1626 | ⊕⊕⊕⊝ | ||
| 17 per 1000 | 20 per 1000 | |||||
| Major bleeding | Medium risk population | OR 0.9 | 4390 | ⊕⊝⊝⊝ | ||
| 14 per 1000 | 13 per 1000 | |||||
| Minor bleeding | Medium risk population | OR 0.98 | 2755 | ⊕⊕⊕⊝ | ||
| 40 per 1000 | 39 per 1000 | |||||
| Total death ‐ During 3 months follow up (including acute phase) | Medium risk population | OR 1.02 | 1887 | ⊕⊕⊕⊝ | ||
| 43 per 1000 | 44 per 1000 | |||||
| VTE or bleeding related death during 3 months follow‐up (including acute phase) | Medium risk population | RD 0.0 | 2181 | ⊕⊕⊕⊝ | ||
| 0 per 1000 | 0 per 1000 | |||||
| *The basis for the assumed risk (e.g. the median control group risk across studies) is provided in footnotes. The corresponding risk (and its 95% confidence interval) is based on the assumed risk in the comparison group and the relative effect of the intervention (and its 95% CI). | ||||||
| GRADE Working Group grades of evidence | ||||||
| 1 Selection, performance, attrition and detection bias exist in some of the trials assessed. | ||||||
| Study | Selection bias | Performance bias | Attrition bias | Detection bias | Overall quality |
| Unclear | No | No | No | C | |
| Unclear | Unclear | No | No | C | |
| Yes | No | No | +/‐ | C | |
| Yes | No | No | +/‐ | C | |
| Unclear | No | No | +/‐ | C | |
| Unclear | Yes | No | +/‐ | C | |
| Yes | Yes | Unclear | Unclear | B | |
| Yes | No | No | Yes | C | |
| Unclear | No | No | Yes | C | |
| Yes | No | No | Yes | C | |
| Unclear | No | No | Yes | C | |
| Unclear | No | No | Unclear | C | |
| Unclear | No | No | Unclear | C | |
| Unclear | No | Yes | Yes | C | |
| Unclear | No | No | Yes | C |
| Outcome or subgroup title | No. of studies | No. of participants | Statistical method | Effect size |
| 1 DVT resolution (partial/full) ‐ end of heparin treatment Show forest plot | 9 | 886 | Odds Ratio (M‐H, Fixed, 95% CI) | 1.40 [1.06, 1.84] |
| 2 Recurrent DVT during 3 months follow up Show forest plot | 4 | 1628 | Odds Ratio (M‐H, Fixed, 95% CI) | 1.68 [0.92, 3.04] |
| 3 New clinical pulmonary embolism Show forest plot | 11 | Odds Ratio (M‐H, Fixed, 95% CI) | Subtotals only | |
| 3.1 During heparin treatment | 8 | 958 | Odds Ratio (M‐H, Fixed, 95% CI) | 1.10 [0.46, 2.62] |
| 3.2 During 3 months follow up | 4 | 1626 | Odds Ratio (M‐H, Fixed, 95% CI) | 1.18 [0.54, 2.56] |
| 4 New pulmonary embolism on routine lung scan ‐ end of heparin therapy Show forest plot | 2 | 109 | Odds Ratio (M‐H, Fixed, 95% CI) | 0.84 [0.25, 2.81] |
| Outcome or subgroup title | No. of studies | No. of participants | Statistical method | Effect size |
| 1 Anticoagulation measures (aPTT, anti‐Xa) ‐ after titration Show forest plot | 5 | Std. Mean Difference (IV, Fixed, 95% CI) | Subtotals only | |
| 1.1 SC UFH vs. IV UFH | 3 | 489 | Std. Mean Difference (IV, Fixed, 95% CI) | ‐0.14 [‐0.32, 0.04] |
| 1.2 SC UFH vs. SC LMWH | 2 | 92 | Std. Mean Difference (IV, Fixed, 95% CI) | ‐1.15 [‐1.61, ‐0.69] |
| 2 Number of patients below therapeutic range Show forest plot | 3 | Odds Ratio (M‐H, Fixed, 95% CI) | Subtotals only | |
| 2.1 SC UFH vs. IV UFH | 3 | 434 | Odds Ratio (M‐H, Fixed, 95% CI) | 1.31 [0.89, 1.92] |
| Outcome or subgroup title | No. of studies | No. of participants | Statistical method | Effect size |
| 1 Major bleeding Show forest plot | 14 | 4390 | Odds Ratio (M‐H, Fixed, 95% CI) | 0.90 [0.60, 1.36] |
| 1.1 During heparin treatment | 14 | 2721 | Odds Ratio (M‐H, Fixed, 95% CI) | 1.07 [0.64, 1.79] |
| 1.2 During 3 months follow up (including acute phase) | 4 | 1669 | Odds Ratio (M‐H, Fixed, 95% CI) | 0.66 [0.33, 1.32] |
| 2 Minor bleeding Show forest plot | 10 | 2755 | Odds Ratio (M‐H, Fixed, 95% CI) | 0.98 [0.71, 1.36] |
| 2.1 During heparin treatment | 10 | 1806 | Odds Ratio (M‐H, Fixed, 95% CI) | 1.01 [0.64, 1.59] |
| 2.2 During 3 months follow up (including acute phase) | 3 | 949 | Odds Ratio (M‐H, Fixed, 95% CI) | 0.96 [0.61, 1.52] |
| 3 Platelet fall Show forest plot | 5 | 1343 | Odds Ratio (M‐H, Fixed, 95% CI) | 1.12 [0.40, 3.11] |
| 4 Hemoglobin fall Show forest plot | 2 | 200 | Odds Ratio (M‐H, Fixed, 95% CI) | 0.74 [0.16, 3.41] |
| Outcome or subgroup title | No. of studies | No. of participants | Statistical method | Effect size |
| 1 Total death Show forest plot | 10 | Risk Difference (M‐H, Fixed, 95% CI) | Subtotals only | |
| 1.1 During heparin treatment | 7 | 1349 | Risk Difference (M‐H, Fixed, 95% CI) | 0.00 [‐0.01, 0.01] |
| 1.2 During 3 months follow up (including acute phase) | 6 | 1887 | Risk Difference (M‐H, Fixed, 95% CI) | 0.00 [‐0.02, 0.02] |
| 2 VTE or bleeding related death Show forest plot | 13 | Risk Difference (M‐H, Fixed, 95% CI) | Subtotals only | |
| 2.1 During heparin treatment | 9 | 1549 | Risk Difference (M‐H, Fixed, 95% CI) | ‐0.00 [‐0.01, 0.01] |
| 2.2 During 3 months follow up (including acute phase) | 7 | 2181 | Risk Difference (M‐H, Fixed, 95% CI) | ‐0.00 [‐0.01, 0.01] |
| Outcome or subgroup title | No. of studies | No. of participants | Statistical method | Effect size |
| 1 DVT resolution (partial/full) ‐ end of heparin treatment Show forest plot | 9 | 886 | Odds Ratio (M‐H, Fixed, 95% CI) | 1.40 [1.06, 1.84] |
| 1.1 IV UFH as control | 6 | 641 | Odds Ratio (M‐H, Fixed, 95% CI) | 1.83 [1.31, 2.56] |
| 1.2 SC LMWH as control | 3 | 245 | Odds Ratio (M‐H, Fixed, 95% CI) | 0.76 [0.46, 1.26] |
| 2 Recurrent DVT during 3 months follow up Show forest plot | 4 | 1628 | Odds Ratio (M‐H, Fixed, 95% CI) | 1.68 [0.92, 3.04] |
| 2.1 IV UFH as control | 1 | 115 | Odds Ratio (M‐H, Fixed, 95% CI) | 3.29 [0.64, 17.06] |
| 2.2 SC LMWH as control | 3 | 1513 | Odds Ratio (M‐H, Fixed, 95% CI) | 1.49 [0.78, 2.84] |
| 3 New clinical pulmonary embolism Show forest plot | 11 | Odds Ratio (M‐H, Fixed, 95% CI) | Subtotals only | |
| 3.1 During heparin treatment ‐ IV UFH as control | 6 | 756 | Odds Ratio (M‐H, Fixed, 95% CI) | 1.11 [0.42, 2.92] |
| 3.2 During heparin treatment ‐ SC LMWH as control | 2 | 202 | Odds Ratio (M‐H, Fixed, 95% CI) | 1.05 [0.14, 7.63] |
| 3.3 During 3 months follow up ‐ IV UFH as control | 2 | 209 | Odds Ratio (M‐H, Fixed, 95% CI) | 3.11 [0.62, 15.61] |
| 3.4 During 3 months follow up ‐ SC LMWH as control | 2 | 1417 | Odds Ratio (M‐H, Fixed, 95% CI) | 0.80 [0.31, 2.05] |
| 4 New pulmonary embolism on routine lung scan ‐ end of heparin therapy Show forest plot | 2 | 109 | Odds Ratio (M‐H, Fixed, 95% CI) | 0.84 [0.25, 2.81] |
| Outcome or subgroup title | No. of studies | No. of participants | Statistical method | Effect size |
| 1 Anticoagulation measures (aPTT, anti‐Xa) ‐ after titration Show forest plot | 5 | Std. Mean Difference (IV, Fixed, 95% CI) | Subtotals only | |
| 1.1 SC UFH vs. IV UFH | 3 | 489 | Std. Mean Difference (IV, Fixed, 95% CI) | ‐0.14 [‐0.32, 0.04] |
| 1.2 SC UFH vs. SC LMWH | 2 | 92 | Std. Mean Difference (IV, Fixed, 95% CI) | ‐1.15 [‐1.61, ‐0.69] |
| 2 Number of patients below therapeutic range Show forest plot | 3 | 434 | Odds Ratio (M‐H, Fixed, 95% CI) | 1.31 [0.89, 1.92] |
| 2.1 SC UFH vs. IV UFHp | 3 | 434 | Odds Ratio (M‐H, Fixed, 95% CI) | 1.31 [0.89, 1.92] |
| Outcome or subgroup title | No. of studies | No. of participants | Statistical method | Effect size |
| 1 Major bleeding Show forest plot | 14 | 4390 | Odds Ratio (M‐H, Fixed, 95% CI) | 0.90 [0.60, 1.36] |
| 1.1 During heparin treatment ‐ IV UFH as control | 8 | 972 | Odds Ratio (M‐H, Fixed, 95% CI) | 0.83 [0.42, 1.61] |
| 1.2 During heparin treatment ‐ SC LMWH as control | 6 | 1749 | Odds Ratio (M‐H, Fixed, 95% CI) | 1.57 [0.69, 3.58] |
| 1.3 During 3 months follow up ‐ IV UFH as control | 1 | 94 | Odds Ratio (M‐H, Fixed, 95% CI) | 0.96 [0.06, 15.77] |
| 1.4 During 3 months follow up ‐ SC LMWH as control | 3 | 1575 | Odds Ratio (M‐H, Fixed, 95% CI) | 0.64 [0.31, 1.32] |
| 2 Minor bleeding Show forest plot | 9 | 2461 | Odds Ratio (M‐H, Fixed, 95% CI) | 1.03 [0.74, 1.43] |
| 2.1 During heparin treatment ‐ IV UFH as control | 6 | 601 | Odds Ratio (M‐H, Fixed, 95% CI) | 0.64 [0.32, 1.27] |
| 2.2 During heparin treatment ‐ SC LMWH as control | 3 | 911 | Odds Ratio (M‐H, Fixed, 95% CI) | 1.94 [0.96, 3.89] |
| 2.3 During 3 months follow up ‐ IV UFH as control | 1 | 94 | Odds Ratio (M‐H, Fixed, 95% CI) | 3.0 [0.30, 29.94] |
| 2.4 During 3 months follow up ‐ SC LMWH as control | 2 | 855 | Odds Ratio (M‐H, Fixed, 95% CI) | 0.91 [0.56, 1.45] |
| 3 Platelet fall Show forest plot | 5 | 1343 | Odds Ratio (M‐H, Fixed, 95% CI) | 1.12 [0.40, 3.11] |
| 3.1 IV UFH as control | 3 | 465 | Odds Ratio (M‐H, Fixed, 95% CI) | 0.61 [0.15, 2.37] |
| 3.2 SC LMWH as control | 2 | 878 | Odds Ratio (M‐H, Fixed, 95% CI) | 2.98 [0.47, 18.95] |
| Outcome or subgroup title | No. of studies | No. of participants | Statistical method | Effect size |
| 1 Total death Show forest plot | 10 | Risk Difference (M‐H, Fixed, 95% CI) | Subtotals only | |
| 1.1 During heparin treatment | 7 | 1349 | Risk Difference (M‐H, Fixed, 95% CI) | 0.00 [‐0.01, 0.01] |
| 1.2 During 3 months follow up (including acute phase) | 6 | 1887 | Risk Difference (M‐H, Fixed, 95% CI) | 0.00 [‐0.02, 0.02] |
| 2 VTE or bleeding‐related death Show forest plot | 12 | Risk Difference (M‐H, Fixed, 95% CI) | Subtotals only | |
| 2.1 During heparin treatment | 8 | 1490 | Risk Difference (M‐H, Fixed, 95% CI) | ‐0.00 [‐0.01, 0.01] |
| 2.2 During 3 months follow up (including acute phase) | 7 | 2181 | Risk Difference (M‐H, Fixed, 95% CI) | ‐0.00 [‐0.01, 0.01] |