Tratamientos de desintoxicación para adolescentes dependientes de opiáceos
Resumen
Antecedentes
La bibliografía científica que examina los tratamientos dependientes de opiáceos efectivos para los adultos indica claramente que la farmacoterapia es un componente necesario y aceptable de los tratamientos efectivos para la dependencia de opiáceos. No obstante, no se han publicado estudios que evalúen sistemáticamente la efectividad de la desintoxicación farmacológica en los adolescentes.
Objetivos
Evaluar la efectividad de cualquier tratamiento de desintoxicación solo o en combinación con una intervención psicosocial comparado con ninguna intervención, otra intervención farmacológica o intervenciones psicosociales en finalizar el tratamiento, reducir el consumo de sustancias y mejorar el estado de salud y social.
Métodos de búsqueda
Se realizaron búsquedas en el Registro Cochrane Central de Ensayos Controlados (Cochrane Central Register of Controlled Trials, CENTRAL) (2014, número 1), PubMed (enero de 1966 a enero de 2014), EMBASE (enero de 1980 a enero de 2014), CINHAL (enero de 1982 a enero de 2014), Web of Science (1991 a enero de 2014) y en las listas de referencias de los artículos.
Criterios de selección
Ensayos clínicos controlados y aleatorizados que comparen cualquier intervención farmacológica sola o asociada a una intervención psicosocial para la desintoxicación, con ninguna intervención, placebo, otra intervención farmacológica o psicosocial en adolescentes (13 a 18 años).
Obtención y análisis de los datos
Se utilizaron los procedimientos metodológicos estándar recomendados por la Colaboración Cochrane
Resultados principales
Se incluyeron dos ensayos con 190 participantes. Un ensayo comparó la buprenorfina con la clonidina para la desintoxicación. No se encontraron diferencias en cuanto a la deserción: riesgo relativo (RR) 0,45 (intervalo de confianza (IC) del 95%): 0.20 a 1,04) y la aceptabilidad del tratamiento: la diferencia media de la puntuación de retirada (DM): 3.97 (IC del 95%: ‐1,38 a 9,32). Más participantes en el grupo de buprenorfina iniciaron el tratamiento con naltrexona: RR 11,00 (IC del 95%: 1,58 a 76,55), calidad de la evidencia moderada.
El otro ensayo comparó el tratamiento de mantenimiento con el tratamiento de desintoxicación: mantenimiento con buprenorfina y naloxona versus desintoxicación con buprenorfina. En cuanto al abandono, los resultados fueron favorables al tratamiento de mantenimiento: RR 2,67 (IC del 95%: 1,85 y 3,86), así como para los resultados en el seguimiento RR 1,36 (IC del 95%: 1,05 a 1,76); no hay diferencias para el uso de opiáceos, la calidad de la evidencia es baja.
Conclusiones de los autores
Es difícil sacar conclusiones sobre la base de dos ensayos con pocos participantes. Además, los dos estudios incluidos no consideraron la eficacia de la metadona, que sigue siendo el fármaco más frecuentemente utilizado para el tratamiento de la abstinencia de opiáceos. Una de las posibles razones de la ausencia de evidencia puede ser la dificultad de realizar ensayos con jóvenes debido a razones prácticas y éticas.
Resumen en términos sencillos
Tratamientos de desintoxicación para adolescentes dependientes de opiáceos
Tratamiento de desintoxicación para adolescentes dependientes de la heroína
Pregunta de la revisión
Se examinó la evidencia sobre el efecto del tratamiento de desintoxicación en comparación con el tratamiento de mantenimiento farmacológico o la intervención psicosocial para lograr la abstinencia en los adolescentes dependientes de la heroína.
Antecedentes
El consumo de sustancias entre los adolescentes (13 a 18 años de edad) es un problema grave que está en aumento. Es importante identificar los tratamientos efectivos para los individuos que dependen de los opiáceos. Para los adultos, la farmacoterapia es una parte necesaria y aceptable hacia el logro de un tratamiento eficaz. Los agentes de desintoxicación se usan para reducir los síntomas de abstinencia durante el tratamiento de la misma pero la tasa de desintoxicación completa tiende a ser baja y las tasas de reincidencia son altas. Los síntomas de abstinencia, especialmente la necesidad imperiosa de consumir la droga, pueden continuar durante semanas e incluso meses después de la desintoxicación. De manera característica, el período de recuperación de la dependencia se ve influenciado por una variedad de factores psicológicos, sociales y relacionados con el tratamiento. Los tratamientos de desintoxicación incluyen metadona, buprenorfina y agonistas adrenérgicos alfa2.
Características de los estudios
Los autores de la revisión buscaron en la bibliografía ensayos controlados aleatorizados que investigaran las intervenciones farmacológicas con o sin intervención psicosocial dirigidas a la desintoxicación en adolescentes. Encontraron sólo dos ensayos, ambos realizados en los EE.UU.; uno comparó el tratamiento de 28 días con buprenorfina, utilizando comprimidos colocados bajo la lengua, con el uso de un parche de clonidina en 36 adolescentes dependientes de opiáceos que fueron tratados como pacientes ambulatorios. El otro ensayo comparó el tratamiento de mantenimiento con el tratamiento de desintoxicación: mantenimiento con buprenorfina y naloxona versus desintoxicación con buprenorfina.
Resultados clave
El ensayo que comparaba la buprenorfina con la clonidina informó de una tendencia a favor de la buprenorfina en la reducción de la tasa de abandono, pero no hubo diferencias entre los tratamientos en cuanto a la duración y la gravedad de los síntomas de abstinencia. Más participantes en el grupo de buprenorfina fueron transferidos al tratamiento con naltrexona a largo plazo. No se informaron efectos secundarios. En el segundo ensayo que comparaba el mantenimiento con buprenorfina frente a la buprenorfina para la desintoxicación, en el caso de la deserción los resultados fueron a favor del tratamiento de mantenimiento, Al año de seguimiento, el uso de opiáceos autoinformado fue claramente menor en el grupo de mantenimiento y más adolescentes se inscribieron en otros programas de adicción. La realización de ensayos con jóvenes puede ser difícil por razones prácticas y éticas.
Calidad de la evidencia
Esta revisión se vio limitada por el escaso número de ensayos recuperados y la calidad de la evidencia fue moderada para la comparación entre la buprenorfina y la clonidina y baja para la comparación entre la desintoxicación de la buprenorfina y el mantenimiento de la buprenorfina. La evidencia está actualizada hasta enero 2014.
Authors' conclusions
Summary of findings
| Buprenorphine versus clonidine for opiate dependent adolescents | ||||||
| Patient or population: patients with opiate dependent adolescents | ||||||
| Outcomes | Illustrative comparative risks* (95% CI) | Relative effect | No of Participants | Quality of the evidence | Comments | |
| Assumed risk | Corresponding risk | |||||
| Control | Buprenorphine versus clonidine | |||||
| Drop out | Study population | RR 0.45 | 36 | ⊕⊕⊕⊝ | ||
| 611 per 1000 | 275 per 1000 | |||||
| Moderate | ||||||
| 611 per 1000 | 275 per 1000 | |||||
| Duration and severity of signs and symptoms of withdrawal | The mean duration and severity of signs and symptoms of withdrawal in the control groups was | The mean duration and severity of signs and symptoms of withdrawal in the intervention groups was | 32 | ⊕⊕⊕⊝ | ||
| Initiation of naltrexone treatment | Study population | RR 11 | 36 | ⊕⊕⊕⊝ | ||
| 56 per 1000 | 611 per 1000 | |||||
| Moderate | ||||||
| 56 per 1000 | 616 per 1000 | |||||
| *The basis for the assumed risk (e.g. the median control group risk across studies) is provided in footnotes. The corresponding risk (and its 95% confidence interval) is based on the assumed risk in the comparison group and the relative effect of the intervention (and its 95% CI). | ||||||
| GRADE Working Group grades of evidence | ||||||
| 1 only one study included | ||||||
| Buprenorphine detox compared with buprenorphine maintenance for opiate dependent adolescents | ||||||
| Patient or population: patients with opiate dependent adolescents | ||||||
| Outcomes | Illustrative comparative risks* (95% CI) | Relative effect | No of Participants | Quality of the evidence | Comments | |
| Assumed risk | Corresponding risk | |||||
| Buprenorphine maintenance | Buprenorphine detox | |||||
| Drop out | Study population | RR 2.67 | 152 | ⊕⊕⊝⊝ | ||
| 297 per 1000 | 794 per 1000 | |||||
| Moderate | ||||||
| 297 per 1000 | 793 per 1000 | |||||
| Patients with positive urine at the end of treatment | Study population | RR 1.03 | 152 | ⊕⊕⊝⊝ | ||
| 662 per 1000 | 682 per 1000 | |||||
| Moderate | ||||||
| 662 per 1000 | 682 per 1000 | |||||
| Self‐reported use at 12 months follow‐up | Study population | RR 1.36 | 152 | ⊕⊕⊝⊝ | ||
| 527 per 1000 | 717 per 1000 | |||||
| Moderate | ||||||
| 527 per 1000 | 717 per 1000 | |||||
| Enrolment in addiction treatment at 12 month follow‐up | Study population | RR 0.75 | 152 | ⊕⊕⊝⊝ | ||
| 527 per 1000 | 395 per 1000 | |||||
| Moderate | ||||||
| 527 per 1000 | 395 per 1000 | |||||
| *The basis for the assumed risk (e.g. the median control group risk across studies) is provided in footnotes. The corresponding risk (and its 95% confidence interval) is based on the assumed risk in the comparison group and the relative effect of the intervention (and its 95% CI). | ||||||
| GRADE Working Group grades of evidence | ||||||
| 1 no allocation concealment | ||||||
Background
Description of the condition
Several studies have demonstrated that adolescent (less than 18 years old) substance abuse is a serious and growing problem (Altobelli 2005).
In Europe, the estimate of lifetime prevalence of use for young adults 15 to 34 years old is of 32.5% for cannabis, 6.3 % for cocaine, ranging from 0.7 % to 13.6 % in different countries, 5.5 % for amphetamines, ranging from under 0.6 % to 12.4 %; most countries reported estimates in the range of 2.1 to 5.8 % for ectasy and from 0.1 % to 5.4 % for LSD. National estimates vary widely between countries in all measures of prevalence. Opioids, mainly heroin, were cited as the primary drug by more than 200,000 clients reported entering specialist drug treatment in 29 European countries in 2010, or 48 % of all reported treatment entrants (EMCDDA 2012).
In Europe in 2011, the European School Survey Project on Alcohol and Other Drugs (ESPAD) collected data on substance use of more than 100,000 15 to 16‐year‐old European students from 36 countries. Nearly one in three (29%) students in the ESPAD countries perceived cannabis to be (fairly or very) easily available. On average, 18% of students have tried illicit drugs at least once during their lifetime. Most of them (17%) have used cannabis while 6% reported experience with drugs other than cannabis. After cannabis, amphetamines and ecstasy are in second position, each being mentioned by 3% of the students. Lifetime use of cocaine, crack and LSD or other hallucinogens was reported by fewer students (2%) and the rates for heroin and GHB were even lower (1%). Use of cannabis in the past 12 months was 13%, while use in the past 30 days was claimed to be 7% (ESPAD 2012).
In the USA, recent household survey data indicate 9.5 % of youths aged 12 to 17 were current illicit drug users. This rate was similar to the rates of current illicit drug use in 2005 to 2011, but it was lower than the rates from 2002 to 2004. In addition, 7.2 % of youths aged 12 to 17 were current users of marijuana, 2.8 % were current non medical users of psychotherapeutic drugs, 0.8 % were current users of inhalants, 0.6% were current users of hallucinogens, and 0.1 % were current users of cocaine (SAMHSA 2013).
In the USA after 1992, the proportion of young Americans with lifetime use of any drugs rose considerably to a recent high point of 55% in 1999; it then declined gradually to 47% in 2007 through 2009, and stands at 49% in 2012. The annual prevalence of heroin use among 12th graders fell by half between 1975 and 1979, from 1.0% to 0.5%. The rate then held amazingly steady until 1994. Use rose in the mid and late 1990s, along with the use of most drugs; it reached peak levels in 1996 among 8th graders (1.6%), in 1997 among 10th graders (1.4%), and in 2000 among 12th graders (1.5%), suggesting a cohort effect. Since those peak levels, use has declined, with annual prevalence in all three grades fluctuating between 0.7% and 0.9% from 2005 through 2011. Use has declined some in the past two years; in the three grades combined, the 2011 to 2012 decline from 0.7% to 0.6% was significant (Monitoring the Future 2013).
In 2010, most Australians aged 14 years and over (60%) had never used an illicit drug. However, around 15% had used one or more illicit drugs in the past 12 months. Cannabis was the most common illicit drug used recently (10.3%), followed by ecstasy (3.0%) and amphetamines and cocaine (each used by 2.1% of people). Many people who used an illicit drug in 2010 also used other drugs, illicit or licit ( AIHW 2011).
Patterns of drug use have changed over time. An analysis of treatment entry data between 2000 and 2009 showed a decrease in drug injection among primary heroin clients in all European countries (from 58 % to 36 %), particularly in western Europe (EMCDDA 2012). In addition, among opioid users entering treatment in outpatient settings since 2009, those smoking the drug outnumbered those injecting it (EMCDDA 2012).
Description of the intervention
Numerous medications have been successfully used in the treatment of adolescents with a broad array of psychiatric disorders (Hunt 1990; Kaminer 1995). In contrast, medications have been infrequently used in treating substance abuse disorders among adolescents, nevertheless they have generally been shown to be a promising component of such interventions (Kaminer 1995).
The scientific literature examining effective treatments for opioid dependent adults clearly indicates that pharmacotherapy is a necessary and acceptable component of effective treatments for opioid dependence. Nevertheless, when young people must be treated, it probably is necessary to monitor the interventions in order to adapt them to this specific population. Different pharmacological agents have been used as detoxification agents to ameliorate withdrawal symptoms, however, the rate of completion of detoxification tends to be low, and rates of relapse to opioid use following detoxification are high (Gossop 1989; Vaillant 1988). Methadone may still be the medication that is most widely used but buprenorphine is seen as having some advantages for adolescents because of its excellent safety profile and the absence of long‐term complications (Levy 2007; Smith 2012). Younger patients who present for treatment of drug dependence often have a shorter history of drug use than treatment‐seeking adults. Treatment early in the course of the disorder presents the opportunity to prevent co‐morbidities associated with drug use, including acute and chronic medical conditions, and psychiatric and social complications (Levy 2007).
How the intervention might work
Managed withdrawal, or detoxification, is not in itself a treatment for dependence (Lipton 1983; Mattick 1996) but detoxification remains a required first step for many forms of longer‐term treatment (Kleber 1982). Withdrawal symptoms, particularly drug craving, may continue to be experienced for weeks and even for months after detoxification, and the period of recovery from dependence is typically influenced by a range of psychological, social and treatment‐ related factors.
Why it is important to do this review
We did not find any reviews in the published literature that assessed the effectiveness of detoxification treatment for adolescents. Many other Cochrane systematic reviews have been published on the effectiveness of various detoxification treatments: methadone (Amato 2013), buprenorphine (Gowing 2009), alpha2‐adrenergic agonists (Gowing 2014), opioid antagonists with minimal sedation (Gowing 2009b) and under heavy sedation (Gowing 2010), psychosocial combined with detoxification treatment (Amato 2011) and one review comparing inpatient versus outpatient settings for opioid detoxification (Day 2005), but none address the question of the effectiveness of treatments for adolescents.
Objectives
To assess the effectiveness of any detoxification treatment alone or in combination with psychosocial intervention compared with no intervention, other pharmacological intervention or psychosocial interventions on completion of treatment, reducing the use of substances and improving health and social status.
Methods
Criteria for considering studies for this review
Types of studies
Randomised controlled trials (RCTs) and controlled clinical trials (CCTs).
Types of participants
Opiate dependent adolescents (13 to 18 years of age). There was no restriction for participants with physical or psychological illness.
Types of interventions
Experimental intervention
-
Any pharmacological interventions (methadone, buprenorphine, adrenergic agonists, symptomatics) alone or associated with psychosocial intervention aimed at detoxification
Control intervention
-
No intervention
-
Other pharmacological interventions
-
Psychosocial interventions alone
Types of comparisons foreseen
-
Any detoxification treatment versus no treatment
-
Any detoxification treatment versus other pharmacological treatment (e.g. methadone versus buprenorphine)
-
Any pharmacological treatment plus psychosocial treatment versus any pharmacological treatment alone
-
Any detoxification treatment versus any psychosocial treatment
Types of outcome measures
Primary outcomes
-
Drop outs measured as number of participants who did not complete the detoxification treatment.
-
Use of primary substance measured as number of participants with opiate positive urine analysis during and at the end of treatment or self‐reported data.
-
Acceptability of the treatment as A) duration and severity of signs and symptoms of withdrawal, including patient self‐rating B) side effects.
-
Results at follow‐up measured as number of participants who relapsed at the end of follow‐up.
Secondary outcomes
-
Engagement in further treatment measured as number of participants who enrolled in any psychosocial or pharmacological treatment.
-
Use of other substances of abuse.
-
Overdose, fatal or nonfatal.
-
Criminal activity.
-
Social functioning (integration at school or at work, family relationship).
Search methods for identification of studies
Electronic searches
For this update, we revised the search strategy and re‐ran searches in the following databases.
-
Cochrane Drugs and Alcohol Group's trials register (Jannuary 2014).
-
The Cochrane Central Register of Controlled Trials (CENTRAL) (The Cochrane Library 2014, Issue 1).
-
MEDLINE (PubMed) (from 1966 ‐ to Jannuary 2014).
-
EMBASE (embase.com) (from 1980 ‐ to Jannuary 2014).
-
CINAHL (EBSCO) (1982 ‐ to Jannuary 2014).
-
Web of Science (1991 ‐ to Jannuary 2014).
Databases were searched using a strategy developed by incorporating the filter for identification of RCTs (Lefebvre 2011) combined with selected MeSH terms and free‐text terms related to alcohol dependence. For details on searchesseeAppendix 1; Appendix 3; Appendix 4; Appendix 5; Appendix 6.
We also searched some of the main electronic sources of ongoing trials.
-
Current Controlled Trials (www.controlled‐trials.com/).
-
Clinical Trials.gov (www.clinicaltrials.gov/).
-
International Clinical Trials Registry Platform (ICTRP) (www.who.int/ictrp/en).
Searching other resources
We also searched the following.
-
References of the articles obtained by any means.
-
Conference proceedings likely to contain trials relevant to the review (Annual Scientific Meeting of the College on Problems of Drug Dependence, European College of Neuropsychopharmacology, American Psychiatric Association).
-
By contacting investigators, and relevant trial authors seeking information about unpublished or incomplete trials.
All searches included non‐English language literature and studies with English abstracts were assessed for inclusion. When considered likely to meet inclusion criteria, studies were translated.
Data collection and analysis
Selection of studies
Two review authors (SM, CB) independently inspected the search 'hits' by reading titles and abstracts. Each potentially relevant study located in the search was obtained in full text and assessed for inclusion independently by two review authors (SM, LA). Any disagreements were resolved by discussion between the authors.
Data extraction and management
Three review authors (SM, LA, CB) independently extracted data. Any disagreements were discussed and resolved by consensus.
Assessment of risk of bias in included studies
We changed the criteria to assess methodological quality of included studies from that outlined in the protocol to conform the review to the recommended methods outlined in the Cochrane Reviewers Handbook version 5.0.0 and to the requirements of RevMan5 (Cochrane Handboook 2008).
The recommended approach for assessing risk of bias in studies included in Cochrane Review is a two‐part tool, addressing six specific domains (namely sequence generation, allocation concealment, blinding, incomplete outcome data, selective outcome reporting and other issues). The first part of the tool involves describing what was reported to have happened in the study. The second part of the tool involves assigning a judgement relating to the risk of bias for that entry. This is achieved by answering a pre‐specified question about the adequacy of the study in relation to the entry, such that a judgement of "Yes" indicates low risk of bias, "No" indicates high risk of bias, and "Unclear" indicates unclear or unknown risk of bias. To make these judgments we used the criteria indicated by the handbook and their applicability in the addiction field. For a detailed description of the criteria used see Cochrane Handboook 2008.
The domains of sequence generation, allocation concealment (avoidance of selection bias) and selective outcome reporting (avoidance of reporting bias) have been addressed in the tool by a single entry for each study.
Blinding of participants, personnel and outcome assessors (avoidance of performance bias and detection bias) was considered separately for objective outcomes (drop out, use of substance of abuse measured by urine‐analysis, subjects relapsed at the end of follow up, subjects engaged in further treatments) and subjective outcomes (duration and severity of signs and symptoms of withdrawal, including patient self‐rating, side effects, social functioning as integration at school or at work, family relationships).
Incomplete outcome data (avoidance of attrition bias) were considered for all outcomes except for drop out from the treatment, which is very often the primary outcome measure in trials on addiction. It have been assessed separately for results at the end of the study period and for results at follow up.
For drop out from treatment we judged that only sequence generation and allocation concealment could be relevant because lack of blinding is unlikely to influence data collection and incomplete outcome data could not be used for this outcome. For use of substances assessed by urine analysis we judged that sequence generation, allocation concealment and incomplete outcome data could influence results. For subjective outcomes we judged that also lack of blinding of outcome assessor could influence data.
Measures of treatment effect
Dichotomous outcomes were analysed calculating the risk ratio (RR) for each trial with the uncertainty in each result being expressed by their confidence intervals (CIs). Continuous outcomes were analysed calculating the mean difference (MD), again with 95% CIs.
The drop out from treatment was reported as the number of participants who did not complete the detoxification treatment. The use of primary substance was reported as the number of participants with opiate positive urine analysis during and at the end of treatment, or self‐report data.The results at follow‐up were measured as number of participants who had relapsed at the end of follow‐up. We did not use data presented as number of positive urine tests over total number of tests in the experimental and control group as a measure of substance abuse. This is because using the number of tests instead of the number of participants as the unit of analysis violates the hypothesis of independence among observations. In fact, the results of tests done in each participant are not independent. For outcomes assessed by scales, we compared and pooled the mean score differences from the end of treatment to baseline (post minus pre) in the experimental and control group. In case of missing data about the standard deviation of the change, we imputed this measure using the standard deviation at the end of treatment for each group.
Assessment of heterogeneity
Heterogeneity was analysed by means of the I2 statistic and Chi2 test for heterogeneity.The cut‐off points were I2 > 50% and P of the Chi2 test < 0.1.
Assessment of reporting biases
We planned to use funnel plots (plots of the effect estimate from each study against the sample size or effect standard error) to assess the potential for bias related to the size of the trials, which could indicate possible publication bias, but did not as we included only two trials.
Data synthesis
We planned to combine the relative risk (RR) or the weighted mean difference (WMD) from the individual trials through meta‐analysis where possible (comparability of intervention and outcomes between trials) using a random‐effects model as some variability was expected in the studies included. We included only two trials with different comparisons, which prevented the possibility of performing meta‐analysis. Accordingly, we used a fixed‐effect method with risk ratio (RR) for dichotomous data and mean difference (MD) for continuous data..
Sensitivity analysis
To incorporate assessment of risk of bias in the review process, we planned to first plot intervention effects estimates stratified for risk of bias for each relevant domain. If differences in results were present among studies at different risk of bias, we planned to perform sensitivity analysis excluding from the analysis studies with a high risk of bias. This was not done because only one study was included in each comparison of the review.
Results
Description of studies
Results of the search
This is an update of a Cochrane review first published in 2009. In the first version of our review we identified 2917 references. After excluding duplicate articles, we identified 2595 potentially relevant references. We excluded 2586 on the basis of title and abstracts leaving 10 studies which were acquired in full text for more evaluation. Out of these, seven studies were excluded, one was included, one is an ongoing trial and one study was classified as study awaiting assessment because it is finished but not yet published and the authors could not give us the data. Immediately before the publication of the review (November 2008) the ongoing study was published, so we decided to include it. See Figure 1.

Flow chart of studies of the review published in 2009
In the 2014 update, we retrieved 1004 further references after excluding duplicates. We further excluded 986 articles on the basis of title and abstract and 15 were acquired in full text for more detailed evaluation. Out of the 15 studies, two (Woody 2009 and Woody 2013) were errata corrige of Woody 2008. One study (with two conference proceedings) was classified as awaiting classification because although the study is finished, it is not yet published and the authors could not give us the data (Marsh 2009).The other 11 retrieved studies were excluded. See Figure 2.

Study flow diagram. 2014 update
For substantive descriptions of studies seeCharacteristics of included studies and Characteristics of excluded studies tables.
Included studies
Two studies met the inclusion criteria (Marsch 2005; Woody 2008). No further studies were retrieved for inclusion in the 2014 update.
-
Type of comparison: buprenorphine sublingual tablets versus clonidine patch (Marsch 2005; buprenorphine‐naloxone maintenance versus buprenorphine detox (Woody 2008)
-
Participants: 190 opiate dependent adolescents (13 to 21 years old)
-
Duration of the trial: 28 days (Marsch 2005); 12 weeks (Woody 2008)
-
Setting: outpatients
-
Country: USA
Excluded studies
Overall, 18 studies did not meet the criteria for inclusion in this review. The grounds for exclusion were: study design not in the inclusion criteria: not RCT or CCT: five studies (Ebner 2007; Fiellin 2008; Godley 2004; Lloyd 1974; Moore 2014); experimental intervention not in the inclusion criteria: only psychosocial intervention without pharmacological detoxification: two studies (Baer 2007; Kemp 2007); maintenance treatment: one study (Lehmann 1973); different psychosocial intervention given to two groups receiving the same pharmacological intervention: one study (Forcehimes 2008); outcome not in the inclusion criteria: six studies (Chakrabarti 2010, Hill 2013, Polsky 2010; Subramaniam 2011; Warden 2012; Wilcox 2013); participant not in the inclusion criteria: one study (Mannelli 2011); study design and participants not in the inclusion criteria: one study (Mullen 2010); secondary analysis of the Marsch 2005 study without distinction between experimental and control condition (Moore 2011).
Risk of bias in included studies
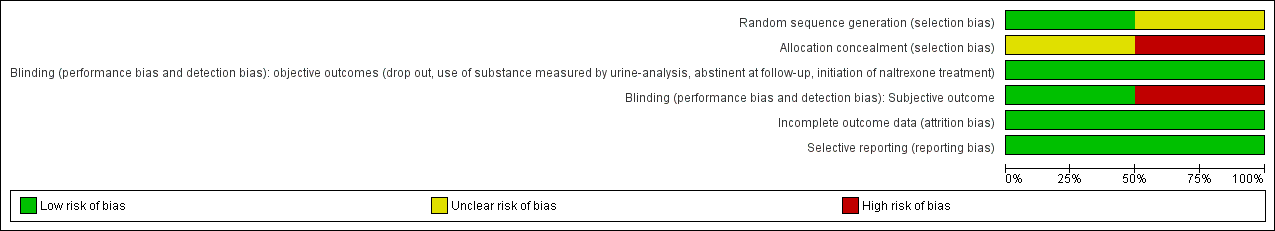
Methodological quality graph: review authors' judgements about each methodological quality item presented as percentages across all included studies.
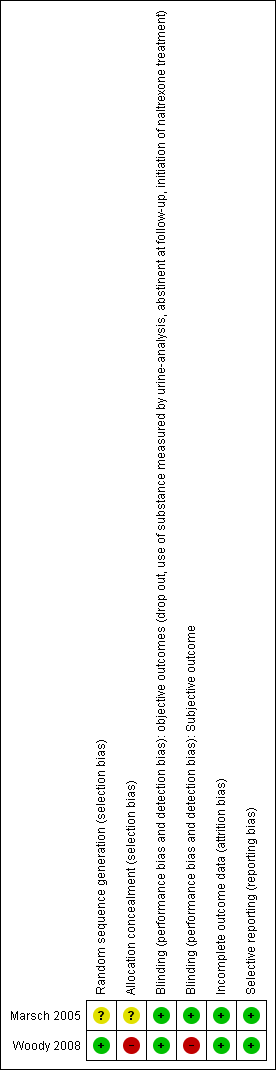
Methodological quality summary: review authors' judgements about each methodological quality item for each included study.
Allocation
Sequence generation and allocation concealment: we judged one study as at unclear risk of bias (Marsch 2005). The other study (Woody 2008) was judged to be at low risk of bias for sequence generation and at high risk of bias for allocation concealment.
Blinding
Both studies were judged to be at a low risk of bias for objective outcomes. For subjective outcomes, one study (Marsch 2005) was judged at low risk of bias, whereas the other (Woody 2008), was judged to be at a high risk of bias.
Incomplete outcome data
Both studies were judged as at low risk of bias.
Selective reporting
Both studies were judged as at low risk of bias.
Effects of interventions
See: Summary of findings for the main comparison Buprenorphine versus clonidine for opiate dependent adolescents; Summary of findings 2 Buprenorphine detox compared with buprenorphine maintenance for opiate dependent adolescents
No meta‐analysis was performed because the two studies assessed different comparisons.
Comparison 1: any detoxification treatment versus other pharmacological treatment: buprenorphine versus clonidine
See summary of findings Table for the main comparison
Primary outcomes
Drop out from treatment: risk ratio (RR): 0.45 (95% confidence interval (CI): 0.20 to 1.04); the result is not statistically significant but there is a trend in favour of buprenorphine. See Analysis 1.1.
Acceptability of the treatment:
-
duration and severity of signs and symptoms of withdrawal: Adjective rating scale: mean difference (MD): 3.97 (95% CI ‐1.38 to 9.32); the result is not statistically significant. See Analysis 1.2.
-
side effects: side effects were not reported in the study.
Secondary outcomes
Engagement in further treatment: measured as the number of participants who enrolled in any psychosocial or pharmacological treatment: initiation of naltrexone treatment: RR 11.00 (95% CI 1.58 to 76.55); the result is in favour of buprenorphine. See Analysis 1.3.
Comparison 2: maintenance treatment versus detoxification treatment: buprenorphine‐naloxone maintenance for nine weeks then tapered to 12 weeks versus buprenorphine detoxification 14 days
See summary of findings Table 2
Primary outcomes
-
Drop out from treatment: RR 2.67 (95% CI 1.85 to 3.86); in favour of maintenance treatment. See Analysis 2.1.
-
Use of substance of abuse: no significant difference. See Analysis 2.2.
-
Results at follow‐up: self‐reported heroin use at 12 months: RR 1.36 (95% CI 1.05 to 1.76); in favour of maintenance treatment. See Analysis 2.3.
-
Enrolment in addiction treatment at 12 months: RR: 0.75 (0.53 to 1.07); there is a trend in favour of maintenance treatment. See Analysis 2.4.
Secondary outcomes
-
Use of other substances of abuse: no significant difference for alcohol and marijuana; RR 8.54 (95%CI 1.11 to 65.75); in favour of maintenance treatment. See Analysis 2.5; Analysis 2.6; Analysis 2.7.
-
Side effects: the authors reported that no serious side effects attributable to buprenorphine‐naloxone were reported and no patients were removed from the study for side effects. The most common side effect was headache, which was reported by 16% to 21% of patients in both groups.
-
Mortality any cause: one death for methadone overdose occurred in the maintenance group in a patient who dropped out after three doses and was not located until her obituary appeared in a newspaper three months later.
Discussion
Summary of main results
Despite a comprehensive search of published and unpublished literature only two studies were found. One (Marsch 2005) compared buprenorphine and clonidine for detoxification of adolescents. The study found no difference in drop‐out rate and in withdrawal symptoms even if the difference in drop‐out rate is nearly significant in favour of buprenorphine. More participants in the buprenorphine group initiated naltrexone treatment. The other study (Woody 2008) compared maintenance treatment with buprenorphine‐naloxone for nine weeks then tapered until 12 weeks with 14 days detoxification with buprenorphine. Maintenance treatment seems more efficacious in retaining patients in treatment but not in reducing patients with positive urine at the end of the study. Self‐reported opioid use at one year follow‐up was significantly lower in the maintenance group even if both groups reported high level of opioid use and more patients in the maintenance group were enrolled in other addiction treatment at 12‐month follow‐up.
Overall completeness and applicability of evidence
One study (Marsch 2005) with few participants has too little evidence to draw any conclusions about the superiority of buprenorphine over clonidine. Moreover, there are no studies comparing pharmacological detoxification with psychosocial intervention alone, which is the most used approach to treat opioid dependent adolescents. The study of Woody 2008 compares a short‐term maintenance treatment with a 14‐day detoxification. More than a maintenance treatment, the 12 week buprenorphine‐naloxone could be considered a long‐term detoxification following a two‐month stabilisation period. Only one study with 150 participants has too little evidence to draw any firm conclusions.
Quality of the evidence
The quality of evidence was judged as moderate for the comparison between buprenorphine versus clonidine . The main reason for downgrading was due to the fact that only one study with 36 participants was found for this comparison. The quality of evidence was judged as low for the comparison between buprenorphine detoxification versus buprenorphine maintenance The reasons were that there was no allocation concealment, no blinding of participants, personnel and outcome assessor, and because only one trial with 154 participants has been found for this comparison.
Potential biases in the review process
A particularly important component of a review is the identification of relevant studies. Publication bias has long been recognised as a problem in this regard since it means that the likelihood of finding studies is related to the results of those studies. One way to investigate whether a review is subject to publication bias is to prepare a ‘funnel plot’ and examine this for signs of asymmetry. We could not explore the possibility of publication bias by funnel plot because only two studies was retrieved. We looked for all potentially relevant studies by a comprehensive search, which considered also conference proceedings and registers of ongoing trials. We wrote to the author of the only published trial asking for other trials but she did not answer. We also looked at references of published narrative reviews.
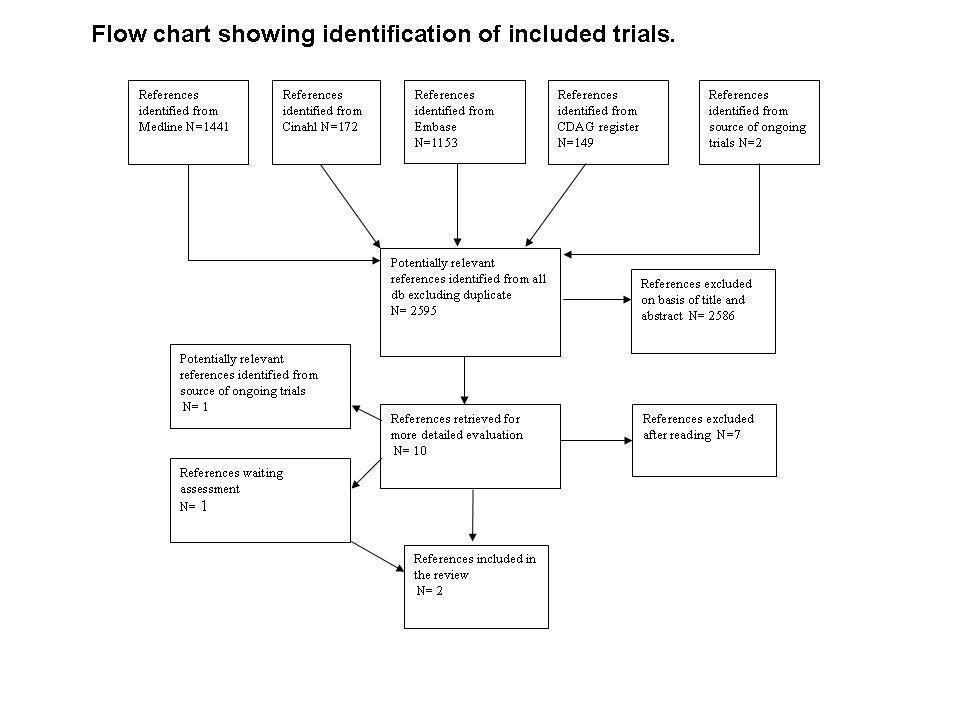
Flow chart of studies of the review published in 2009
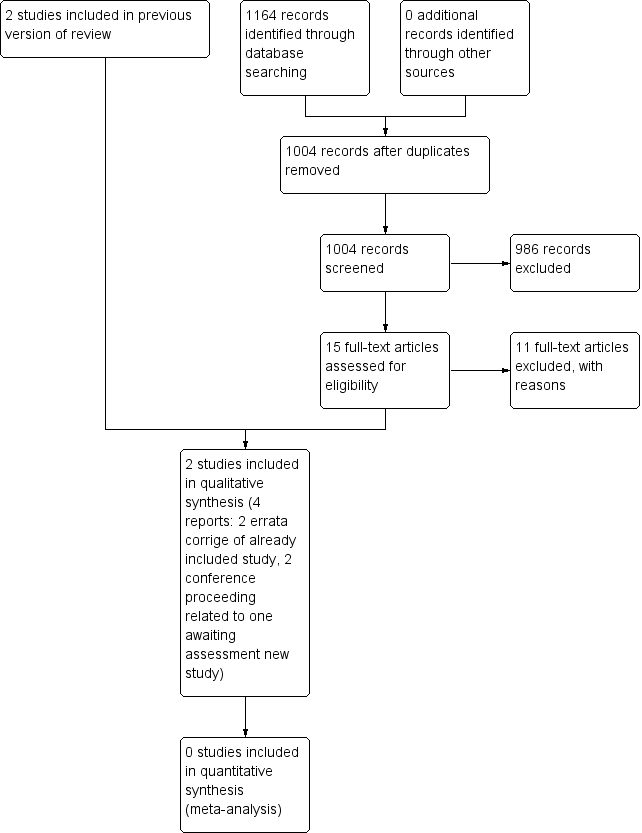
Study flow diagram. 2014 update

Methodological quality graph: review authors' judgements about each methodological quality item presented as percentages across all included studies.

Methodological quality summary: review authors' judgements about each methodological quality item for each included study.

Comparison 1 Buprenorphine versus clonidine, Outcome 1 drop out.

Comparison 1 Buprenorphine versus clonidine, Outcome 2 withdrawal score.

Comparison 1 Buprenorphine versus clonidine, Outcome 3 initiation of naltrexone treatment.

Comparison 2 Buprenorphine detox versus buprenorphine maintenance, Outcome 1 drop out.

Comparison 2 Buprenorphine detox versus buprenorphine maintenance, Outcome 2 patients with positive urine at the end of treatment.

Comparison 2 Buprenorphine detox versus buprenorphine maintenance, Outcome 3 self‐reported use at 12 months follow‐ up.

Comparison 2 Buprenorphine detox versus buprenorphine maintenance, Outcome 4 enrolment in addiction treatment at 12‐month follow‐up.

Comparison 2 Buprenorphine detox versus buprenorphine maintenance, Outcome 5 self‐reported alcohol use.
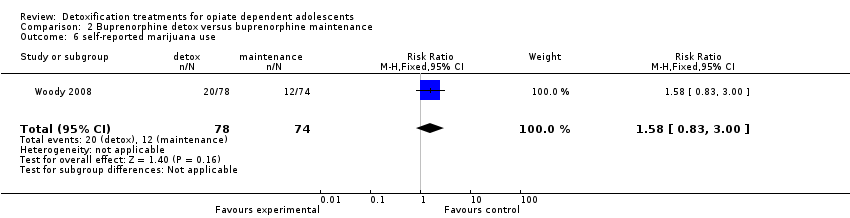
Comparison 2 Buprenorphine detox versus buprenorphine maintenance, Outcome 6 self‐reported marijuana use.
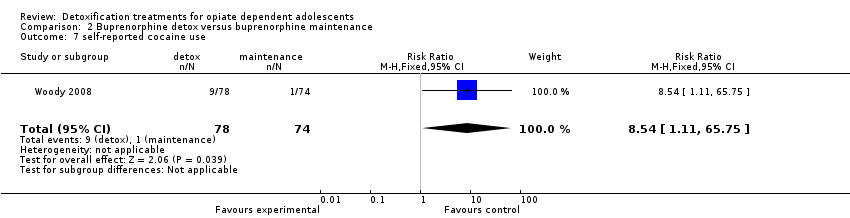
Comparison 2 Buprenorphine detox versus buprenorphine maintenance, Outcome 7 self‐reported cocaine use.
| Buprenorphine versus clonidine for opiate dependent adolescents | ||||||
| Patient or population: patients with opiate dependent adolescents | ||||||
| Outcomes | Illustrative comparative risks* (95% CI) | Relative effect | No of Participants | Quality of the evidence | Comments | |
| Assumed risk | Corresponding risk | |||||
| Control | Buprenorphine versus clonidine | |||||
| Drop out | Study population | RR 0.45 | 36 | ⊕⊕⊕⊝ | ||
| 611 per 1000 | 275 per 1000 | |||||
| Moderate | ||||||
| 611 per 1000 | 275 per 1000 | |||||
| Duration and severity of signs and symptoms of withdrawal | The mean duration and severity of signs and symptoms of withdrawal in the control groups was | The mean duration and severity of signs and symptoms of withdrawal in the intervention groups was | 32 | ⊕⊕⊕⊝ | ||
| Initiation of naltrexone treatment | Study population | RR 11 | 36 | ⊕⊕⊕⊝ | ||
| 56 per 1000 | 611 per 1000 | |||||
| Moderate | ||||||
| 56 per 1000 | 616 per 1000 | |||||
| *The basis for the assumed risk (e.g. the median control group risk across studies) is provided in footnotes. The corresponding risk (and its 95% confidence interval) is based on the assumed risk in the comparison group and the relative effect of the intervention (and its 95% CI). | ||||||
| GRADE Working Group grades of evidence | ||||||
| 1 only one study included | ||||||
| Buprenorphine detox compared with buprenorphine maintenance for opiate dependent adolescents | ||||||
| Patient or population: patients with opiate dependent adolescents | ||||||
| Outcomes | Illustrative comparative risks* (95% CI) | Relative effect | No of Participants | Quality of the evidence | Comments | |
| Assumed risk | Corresponding risk | |||||
| Buprenorphine maintenance | Buprenorphine detox | |||||
| Drop out | Study population | RR 2.67 | 152 | ⊕⊕⊝⊝ | ||
| 297 per 1000 | 794 per 1000 | |||||
| Moderate | ||||||
| 297 per 1000 | 793 per 1000 | |||||
| Patients with positive urine at the end of treatment | Study population | RR 1.03 | 152 | ⊕⊕⊝⊝ | ||
| 662 per 1000 | 682 per 1000 | |||||
| Moderate | ||||||
| 662 per 1000 | 682 per 1000 | |||||
| Self‐reported use at 12 months follow‐up | Study population | RR 1.36 | 152 | ⊕⊕⊝⊝ | ||
| 527 per 1000 | 717 per 1000 | |||||
| Moderate | ||||||
| 527 per 1000 | 717 per 1000 | |||||
| Enrolment in addiction treatment at 12 month follow‐up | Study population | RR 0.75 | 152 | ⊕⊕⊝⊝ | ||
| 527 per 1000 | 395 per 1000 | |||||
| Moderate | ||||||
| 527 per 1000 | 395 per 1000 | |||||
| *The basis for the assumed risk (e.g. the median control group risk across studies) is provided in footnotes. The corresponding risk (and its 95% confidence interval) is based on the assumed risk in the comparison group and the relative effect of the intervention (and its 95% CI). | ||||||
| GRADE Working Group grades of evidence | ||||||
| 1 no allocation concealment | ||||||
| Outcome or subgroup title | No. of studies | No. of participants | Statistical method | Effect size |
| 1 drop out Show forest plot | 1 | 36 | Risk Ratio (M‐H, Fixed, 95% CI) | 0.45 [0.20, 1.04] |
| 2 withdrawal score Show forest plot | 1 | 32 | Mean Difference (IV, Fixed, 95% CI) | 3.97 [‐1.38, 9.32] |
| 3 initiation of naltrexone treatment Show forest plot | 1 | 36 | Risk Ratio (M‐H, Fixed, 95% CI) | 11.0 [1.58, 76.55] |
| Outcome or subgroup title | No. of studies | No. of participants | Statistical method | Effect size |
| 1 drop out Show forest plot | 1 | 152 | Risk Ratio (M‐H, Fixed, 95% CI) | 2.67 [1.85, 3.86] |
| 2 patients with positive urine at the end of treatment Show forest plot | 1 | 152 | Risk Ratio (M‐H, Fixed, 95% CI) | 1.03 [0.82, 1.28] |
| 3 self‐reported use at 12 months follow‐ up Show forest plot | 1 | 152 | Risk Ratio (M‐H, Fixed, 95% CI) | 1.36 [1.05, 1.76] |
| 4 enrolment in addiction treatment at 12‐month follow‐up Show forest plot | 1 | 152 | Risk Ratio (M‐H, Fixed, 95% CI) | 0.75 [0.53, 1.07] |
| 5 self‐reported alcohol use Show forest plot | 1 | 152 | Risk Ratio (M‐H, Fixed, 95% CI) | 1.13 [0.63, 2.02] |
| 6 self‐reported marijuana use Show forest plot | 1 | 152 | Risk Ratio (M‐H, Fixed, 95% CI) | 1.58 [0.83, 3.00] |
| 7 self‐reported cocaine use Show forest plot | 1 | 152 | Risk Ratio (M‐H, Fixed, 95% CI) | 8.54 [1.11, 65.75] |