Scolaris Content Display Scolaris Content Display

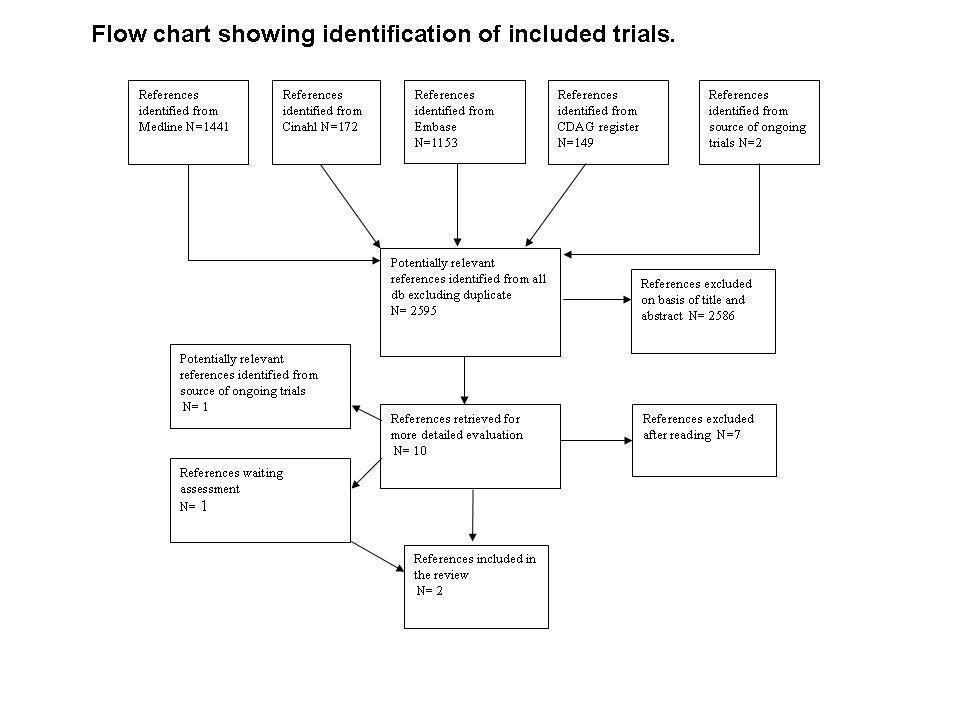
Flow chart of studies of the review published in 2009
Figuras y tablas -
Figure 1

Flow chart of studies of the review published in 2009

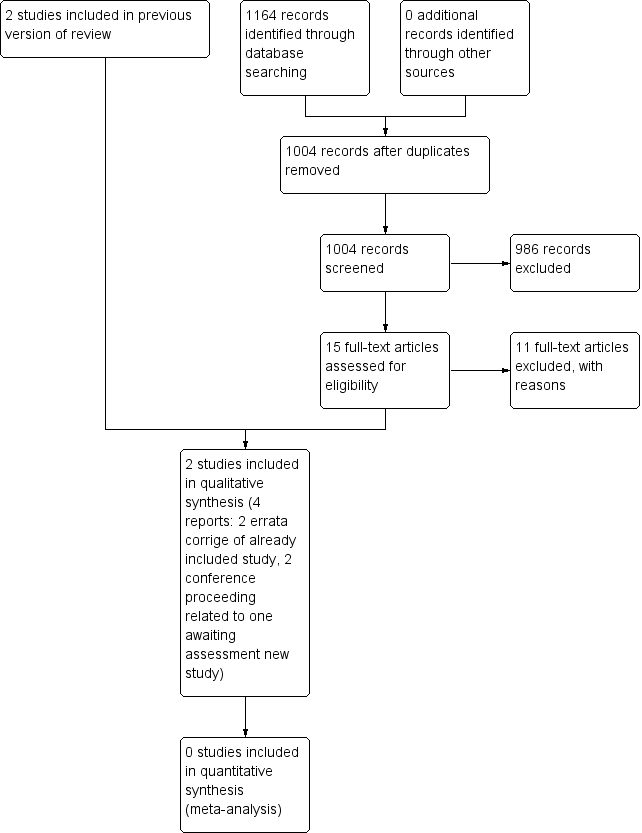
Study flow diagram. 2014 update
Figuras y tablas -
Figure 2

Study flow diagram. 2014 update

Methodological quality graph: review authors' judgements about each methodological quality item presented as percentages across all included studies.
Figuras y tablas -
Figure 3

Methodological quality graph: review authors' judgements about each methodological quality item presented as percentages across all included studies.

Methodological quality summary: review authors' judgements about each methodological quality item for each included study.
Figuras y tablas -
Figure 4

Methodological quality summary: review authors' judgements about each methodological quality item for each included study.

Comparison 1 Buprenorphine versus clonidine, Outcome 1 drop out.
Figuras y tablas -
Analysis 1.1

Comparison 1 Buprenorphine versus clonidine, Outcome 1 drop out.

Comparison 1 Buprenorphine versus clonidine, Outcome 2 withdrawal score.
Figuras y tablas -
Analysis 1.2

Comparison 1 Buprenorphine versus clonidine, Outcome 2 withdrawal score.

Comparison 1 Buprenorphine versus clonidine, Outcome 3 initiation of naltrexone treatment.
Figuras y tablas -
Analysis 1.3

Comparison 1 Buprenorphine versus clonidine, Outcome 3 initiation of naltrexone treatment.

Comparison 2 Buprenorphine detox versus buprenorphine maintenance, Outcome 1 drop out.
Figuras y tablas -
Analysis 2.1

Comparison 2 Buprenorphine detox versus buprenorphine maintenance, Outcome 1 drop out.

Comparison 2 Buprenorphine detox versus buprenorphine maintenance, Outcome 2 patients with positive urine at the end of treatment.
Figuras y tablas -
Analysis 2.2

Comparison 2 Buprenorphine detox versus buprenorphine maintenance, Outcome 2 patients with positive urine at the end of treatment.

Comparison 2 Buprenorphine detox versus buprenorphine maintenance, Outcome 3 self‐reported use at 12 months follow‐ up.
Figuras y tablas -
Analysis 2.3

Comparison 2 Buprenorphine detox versus buprenorphine maintenance, Outcome 3 self‐reported use at 12 months follow‐ up.

Comparison 2 Buprenorphine detox versus buprenorphine maintenance, Outcome 4 enrolment in addiction treatment at 12‐month follow‐up.
Figuras y tablas -
Analysis 2.4

Comparison 2 Buprenorphine detox versus buprenorphine maintenance, Outcome 4 enrolment in addiction treatment at 12‐month follow‐up.

Comparison 2 Buprenorphine detox versus buprenorphine maintenance, Outcome 5 self‐reported alcohol use.
Figuras y tablas -
Analysis 2.5

Comparison 2 Buprenorphine detox versus buprenorphine maintenance, Outcome 5 self‐reported alcohol use.

Comparison 2 Buprenorphine detox versus buprenorphine maintenance, Outcome 6 self‐reported marijuana use.
Figuras y tablas -
Analysis 2.6

Comparison 2 Buprenorphine detox versus buprenorphine maintenance, Outcome 6 self‐reported marijuana use.

Comparison 2 Buprenorphine detox versus buprenorphine maintenance, Outcome 7 self‐reported cocaine use.
Figuras y tablas -
Analysis 2.7

Comparison 2 Buprenorphine detox versus buprenorphine maintenance, Outcome 7 self‐reported cocaine use.

Summary of findings for the main comparison. Buprenorphine versus clonidine for opiate dependent adolescents

Buprenorphine versus clonidine for opiate dependent adolescents

Patient or population: patients with opiate dependent adolescents
Settings:
Intervention: buprenorphine versus clonidine

Outcomes

Illustrative comparative risks* (95% CI)

Relative effect
(95% CI)

No of Participants
(studies)

Quality of the evidence
(GRADE)

Comments

Assumed risk

Corresponding risk

Control

Buprenorphine versus clonidine

Drop out
Number of participants who did not complete the detoxification treatment
Follow‐up: 28 days

Study population

RR 0.45
(0.2 to 1.04)

36
(1 study)

⊕⊕⊕⊝
moderate1,2

611 per 1000

275 per 1000
(122 to 636)

Moderate

611 per 1000

275 per 1000
(122 to 635)

Duration and severity of signs and symptoms of withdrawal
Adjective rating scale
Follow‐up: 28 days

The mean duration and severity of signs and symptoms of withdrawal in the control groups was
‐18.8 score

The mean duration and severity of signs and symptoms of withdrawal in the intervention groups was
3.97 higher
(1.38 lower to 9.32 higher)

32
(1 study)

⊕⊕⊕⊝
moderate1,2

Initiation of naltrexone treatment
Number of participants initiating naltrexone
Follow‐up: 28 days

Study population

RR 11
(1.58 to 76.55)

36
(1 study)

⊕⊕⊕⊝
moderate1,2

56 per 1000

611 per 1000
(88 to 1000)

Moderate

56 per 1000

616 per 1000
(88 to 1000)

*The basis for the assumed risk (e.g. the median control group risk across studies) is provided in footnotes. The corresponding risk (and its 95% confidence interval) is based on the assumed risk in the comparison group and the relative effect of the intervention (and its 95% CI).
CI: Confidence interval; RR: Risk ratio;

GRADE Working Group grades of evidence
High quality: Further research is very unlikely to change our confidence in the estimate of effect.
Moderate quality: Further research is likely to have an important impact on our confidence in the estimate of effect and may change the estimate.
Low quality: Further research is very likely to have an important impact on our confidence in the estimate of effect and is likely to change the estimate.
Very low quality: We are very uncertain about the estimate.

1 only one study included
2 only one study with 36 participants included

Figuras y tablas -
Summary of findings for the main comparison. Buprenorphine versus clonidine for opiate dependent adolescents
Summary of findings 2. Buprenorphine detox compared with buprenorphine maintenance for opiate dependent adolescents

Buprenorphine detox compared with buprenorphine maintenance for opiate dependent adolescents

Patient or population: patients with opiate dependent adolescents
Settings:
Intervention: buprenorphine detox
Comparison: buprenorphine maintenance

Outcomes

Illustrative comparative risks* (95% CI)

Relative effect
(95% CI)

No of Participants
(studies)

Quality of the evidence
(GRADE)

Comments

Assumed risk

Corresponding risk

Buprenorphine maintenance

Buprenorphine detox

Drop out
Number of participants who dropped out from the study

Follow‐up: 12 weeks

Study population

RR 2.67
(1.85 to 3.86)

152
(1 study)

⊕⊕⊝⊝
low1,2,3

297 per 1000

794 per 1000
(550 to 1000)

Moderate

297 per 1000

793 per 1000
(549 to 1000)

Patients with positive urine at the end of treatment
Number of participants with urine positive for opiates

Follow‐up: 12 weeks

Study population

RR 1.03
(0.82 to 1.28)

152
(1 study)

⊕⊕⊝⊝
low1,2

662 per 1000

682 per 1000
(543 to 848)

Moderate

662 per 1000

682 per 1000
(543 to 847)

Self‐reported use at 12 months follow‐up
Number of participants who reported heroin used at follow‐up

Follow‐up: 12 months

Study population

RR 1.36
(1.05 to 1.76)

152
(1 study)

⊕⊕⊝⊝
low1,2,3,4

527 per 1000

717 per 1000
(553 to 928)

Moderate

527 per 1000

717 per 1000
(553 to 928)

Enrolment in addiction treatment at 12 month follow‐up
Number of participants enrolled in addiction treatment at follow‐up

Follow‐up: 12 months

Study population

RR 0.75
(0.53 to 1.07)

152
(1 study)

⊕⊕⊝⊝
low1,2,3

527 per 1000

395 per 1000
(279 to 564)

Moderate

527 per 1000

395 per 1000
(279 to 564)

*The basis for the assumed risk (e.g. the median control group risk across studies) is provided in footnotes. The corresponding risk (and its 95% confidence interval) is based on the assumed risk in the comparison group and the relative effect of the intervention (and its 95% CI).
CI: Confidence interval; RR: Risk ratio;

GRADE Working Group grades of evidence
High quality: Further research is very unlikely to change our confidence in the estimate of effect.
Moderate quality: Further research is likely to have an important impact on our confidence in the estimate of effect and may change the estimate.
Low quality: Further research is very likely to have an important impact on our confidence in the estimate of effect and is likely to change the estimate.
Very low quality: We are very uncertain about the estimate.

1 no allocation concealment
2 only one study with 154 participants
3 participants, providers and outcome assessor not blinded
4

Figuras y tablas -
Summary of findings 2. Buprenorphine detox compared with buprenorphine maintenance for opiate dependent adolescents
Comparison 1. Buprenorphine versus clonidine

Outcome or subgroup title

No. of studies

No. of participants

Statistical method

Effect size

1 drop out Show forest plot

1

36

Risk Ratio (M‐H, Fixed, 95% CI)

0.45 [0.20, 1.04]

2 withdrawal score Show forest plot

1

32

Mean Difference (IV, Fixed, 95% CI)

3.97 [‐1.38, 9.32]

3 initiation of naltrexone treatment Show forest plot

1

36

Risk Ratio (M‐H, Fixed, 95% CI)

11.0 [1.58, 76.55]

Figuras y tablas -
Comparison 1. Buprenorphine versus clonidine
Comparison 2. Buprenorphine detox versus buprenorphine maintenance

Outcome or subgroup title

No. of studies

No. of participants

Statistical method

Effect size

1 drop out Show forest plot

1

152

Risk Ratio (M‐H, Fixed, 95% CI)

2.67 [1.85, 3.86]

2 patients with positive urine at the end of treatment Show forest plot

1

152

Risk Ratio (M‐H, Fixed, 95% CI)

1.03 [0.82, 1.28]

3 self‐reported use at 12 months follow‐ up Show forest plot

1

152

Risk Ratio (M‐H, Fixed, 95% CI)

1.36 [1.05, 1.76]

4 enrolment in addiction treatment at 12‐month follow‐up Show forest plot

1

152

Risk Ratio (M‐H, Fixed, 95% CI)

0.75 [0.53, 1.07]

5 self‐reported alcohol use Show forest plot

1

152

Risk Ratio (M‐H, Fixed, 95% CI)

1.13 [0.63, 2.02]

6 self‐reported marijuana use Show forest plot

1

152

Risk Ratio (M‐H, Fixed, 95% CI)

1.58 [0.83, 3.00]

7 self‐reported cocaine use Show forest plot

1

152

Risk Ratio (M‐H, Fixed, 95% CI)

8.54 [1.11, 65.75]

Figuras y tablas -
Comparison 2. Buprenorphine detox versus buprenorphine maintenance