Scolaris Content Display Scolaris Content Display

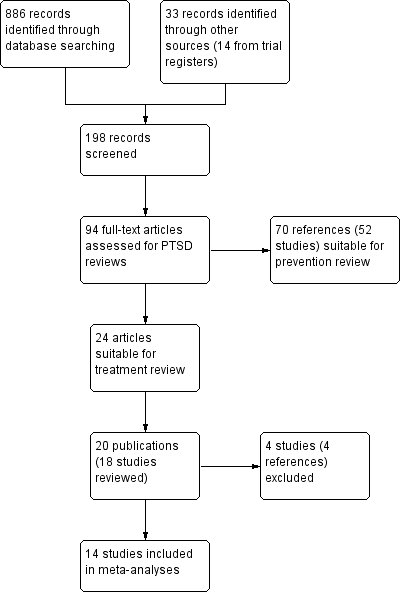
Study flow diagram.
Figuras y tablas -
Figure 1

Study flow diagram.

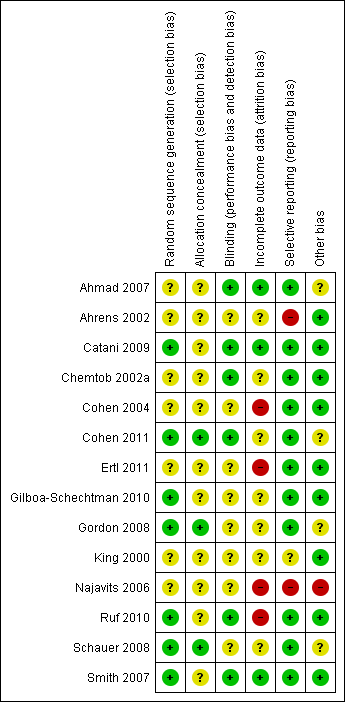
'Risk of bias' summary: review authors' judgements about each risk of bias item for each included study.
Figuras y tablas -
Figure 2

'Risk of bias' summary: review authors' judgements about each risk of bias item for each included study.

Comparison 1 All psychological therapies versus control, Outcome 1 Improvement.
Figuras y tablas -
Analysis 1.1

Comparison 1 All psychological therapies versus control, Outcome 1 Improvement.

Comparison 1 All psychological therapies versus control, Outcome 2 PTSD total.
Figuras y tablas -
Analysis 1.2

Comparison 1 All psychological therapies versus control, Outcome 2 PTSD total.

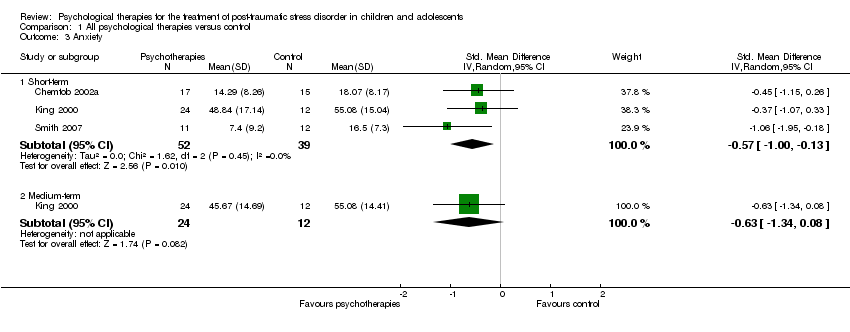
Comparison 1 All psychological therapies versus control, Outcome 3 Anxiety.
Figuras y tablas -
Analysis 1.3

Comparison 1 All psychological therapies versus control, Outcome 3 Anxiety.

Comparison 1 All psychological therapies versus control, Outcome 4 Depression.
Figuras y tablas -
Analysis 1.4

Comparison 1 All psychological therapies versus control, Outcome 4 Depression.

Comparison 1 All psychological therapies versus control, Outcome 5 Loss to follow‐up.
Figuras y tablas -
Analysis 1.5

Comparison 1 All psychological therapies versus control, Outcome 5 Loss to follow‐up.

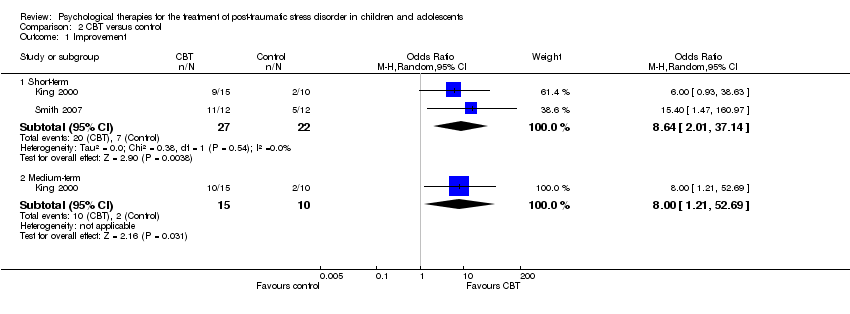
Comparison 2 CBT versus control, Outcome 1 Improvement.
Figuras y tablas -
Analysis 2.1

Comparison 2 CBT versus control, Outcome 1 Improvement.

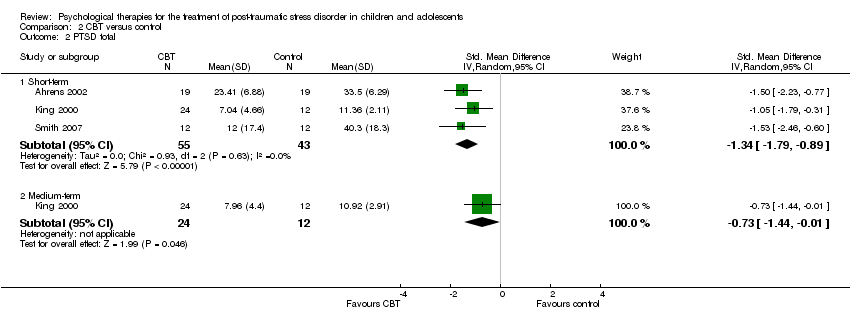
Comparison 2 CBT versus control, Outcome 2 PTSD total.
Figuras y tablas -
Analysis 2.2

Comparison 2 CBT versus control, Outcome 2 PTSD total.

Comparison 2 CBT versus control, Outcome 3 PTSD avoidance.
Figuras y tablas -
Analysis 2.3

Comparison 2 CBT versus control, Outcome 3 PTSD avoidance.

Comparison 2 CBT versus control, Outcome 4 PTSD hyperarousal.
Figuras y tablas -
Analysis 2.4

Comparison 2 CBT versus control, Outcome 4 PTSD hyperarousal.

Comparison 2 CBT versus control, Outcome 5 PTSD re‐experiencing.
Figuras y tablas -
Analysis 2.5

Comparison 2 CBT versus control, Outcome 5 PTSD re‐experiencing.

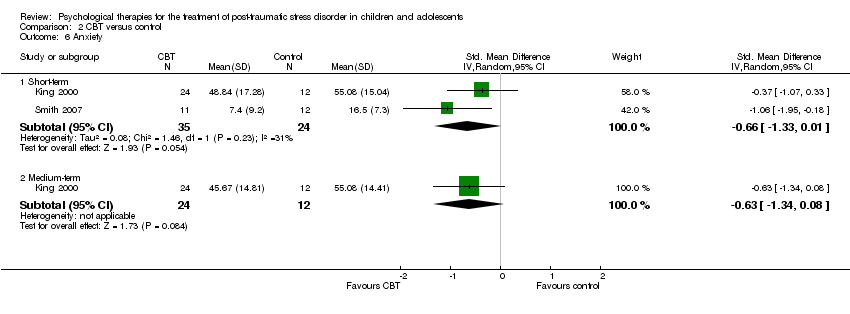
Comparison 2 CBT versus control, Outcome 6 Anxiety.
Figuras y tablas -
Analysis 2.6

Comparison 2 CBT versus control, Outcome 6 Anxiety.

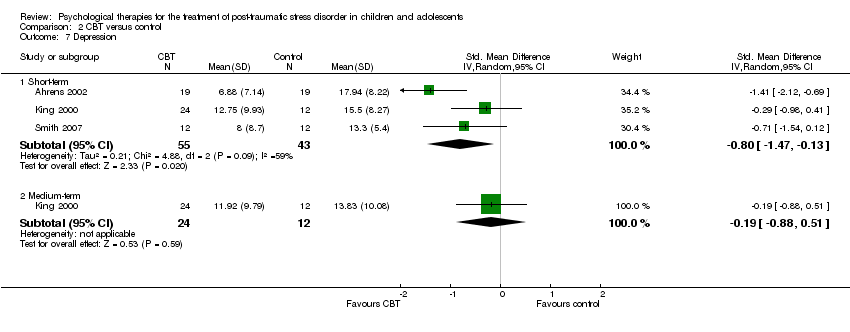
Comparison 2 CBT versus control, Outcome 7 Depression.
Figuras y tablas -
Analysis 2.7

Comparison 2 CBT versus control, Outcome 7 Depression.

Comparison 2 CBT versus control, Outcome 8 Loss to follow‐up.
Figuras y tablas -
Analysis 2.8

Comparison 2 CBT versus control, Outcome 8 Loss to follow‐up.

Comparison 3 Narrative versus control, Outcome 1 Improvement.
Figuras y tablas -
Analysis 3.1

Comparison 3 Narrative versus control, Outcome 1 Improvement.

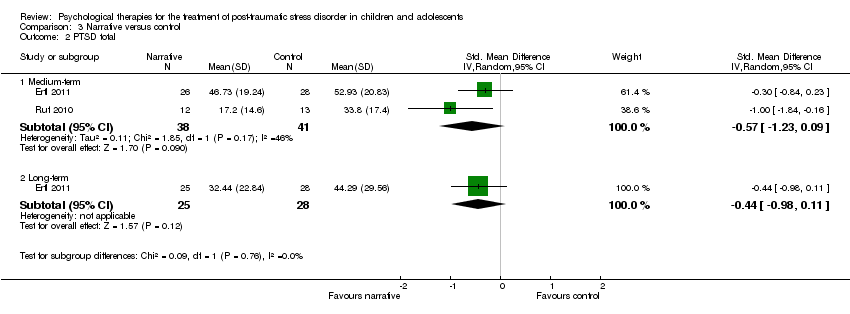
Comparison 3 Narrative versus control, Outcome 2 PTSD total.
Figuras y tablas -
Analysis 3.2

Comparison 3 Narrative versus control, Outcome 2 PTSD total.

Comparison 3 Narrative versus control, Outcome 3 PTSD avoidance.
Figuras y tablas -
Analysis 3.3

Comparison 3 Narrative versus control, Outcome 3 PTSD avoidance.

Comparison 3 Narrative versus control, Outcome 4 PTSD hyperarousal.
Figuras y tablas -
Analysis 3.4

Comparison 3 Narrative versus control, Outcome 4 PTSD hyperarousal.

Comparison 3 Narrative versus control, Outcome 5 PTSD re‐experiencing.
Figuras y tablas -
Analysis 3.5

Comparison 3 Narrative versus control, Outcome 5 PTSD re‐experiencing.

Comparison 3 Narrative versus control, Outcome 6 Depression.
Figuras y tablas -
Analysis 3.6

Comparison 3 Narrative versus control, Outcome 6 Depression.

Comparison 3 Narrative versus control, Outcome 7 Loss to follow‐up.
Figuras y tablas -
Analysis 3.7

Comparison 3 Narrative versus control, Outcome 7 Loss to follow‐up.

Comparison 4 EMDR versus control, Outcome 1 PTSD.
Figuras y tablas -
Analysis 4.1

Comparison 4 EMDR versus control, Outcome 1 PTSD.

Comparison 4 EMDR versus control, Outcome 2 PTSD avoidance.
Figuras y tablas -
Analysis 4.2

Comparison 4 EMDR versus control, Outcome 2 PTSD avoidance.

Comparison 4 EMDR versus control, Outcome 3 PTSD hyperarousal.
Figuras y tablas -
Analysis 4.3

Comparison 4 EMDR versus control, Outcome 3 PTSD hyperarousal.

Comparison 4 EMDR versus control, Outcome 4 PTSD re‐experiencing.
Figuras y tablas -
Analysis 4.4

Comparison 4 EMDR versus control, Outcome 4 PTSD re‐experiencing.

Comparison 4 EMDR versus control, Outcome 5 Anxiety.
Figuras y tablas -
Analysis 4.5

Comparison 4 EMDR versus control, Outcome 5 Anxiety.

Comparison 4 EMDR versus control, Outcome 6 Depression.
Figuras y tablas -
Analysis 4.6

Comparison 4 EMDR versus control, Outcome 6 Depression.

Comparison 4 EMDR versus control, Outcome 7 Loss to follow‐up.
Figuras y tablas -
Analysis 4.7

Comparison 4 EMDR versus control, Outcome 7 Loss to follow‐up.

Comparison 5 Other psychological therapies versus control, Outcome 1 PTSD total.
Figuras y tablas -
Analysis 5.1

Comparison 5 Other psychological therapies versus control, Outcome 1 PTSD total.

Comparison 5 Other psychological therapies versus control, Outcome 2 PTSD avoidance.
Figuras y tablas -
Analysis 5.2

Comparison 5 Other psychological therapies versus control, Outcome 2 PTSD avoidance.

Comparison 5 Other psychological therapies versus control, Outcome 3 PTSD hyperarousal.
Figuras y tablas -
Analysis 5.3

Comparison 5 Other psychological therapies versus control, Outcome 3 PTSD hyperarousal.

Comparison 5 Other psychological therapies versus control, Outcome 4 PTSD re‐experiencing.
Figuras y tablas -
Analysis 5.4

Comparison 5 Other psychological therapies versus control, Outcome 4 PTSD re‐experiencing.

Comparison 5 Other psychological therapies versus control, Outcome 5 Depression.
Figuras y tablas -
Analysis 5.5

Comparison 5 Other psychological therapies versus control, Outcome 5 Depression.

Comparison 5 Other psychological therapies versus control, Outcome 6 Loss to follow‐up.
Figuras y tablas -
Analysis 5.6

Comparison 5 Other psychological therapies versus control, Outcome 6 Loss to follow‐up.

Comparison 6 CBT versus supportive counselling, Outcome 1 Improvement.
Figuras y tablas -
Analysis 6.1

Comparison 6 CBT versus supportive counselling, Outcome 1 Improvement.

Comparison 6 CBT versus supportive counselling, Outcome 2 PTSD avoidance.
Figuras y tablas -
Analysis 6.2

Comparison 6 CBT versus supportive counselling, Outcome 2 PTSD avoidance.

Comparison 6 CBT versus supportive counselling, Outcome 3 PTSD hyperarousal.
Figuras y tablas -
Analysis 6.3

Comparison 6 CBT versus supportive counselling, Outcome 3 PTSD hyperarousal.

Comparison 6 CBT versus supportive counselling, Outcome 4 PTSD re‐experiencing.
Figuras y tablas -
Analysis 6.4

Comparison 6 CBT versus supportive counselling, Outcome 4 PTSD re‐experiencing.

Comparison 6 CBT versus supportive counselling, Outcome 5 Anxiety state.
Figuras y tablas -
Analysis 6.5

Comparison 6 CBT versus supportive counselling, Outcome 5 Anxiety state.

Comparison 6 CBT versus supportive counselling, Outcome 6 Anxiety trait.
Figuras y tablas -
Analysis 6.6

Comparison 6 CBT versus supportive counselling, Outcome 6 Anxiety trait.

Comparison 6 CBT versus supportive counselling, Outcome 7 Depression.
Figuras y tablas -
Analysis 6.7

Comparison 6 CBT versus supportive counselling, Outcome 7 Depression.

Comparison 6 CBT versus supportive counselling, Outcome 8 Behaviour.
Figuras y tablas -
Analysis 6.8

Comparison 6 CBT versus supportive counselling, Outcome 8 Behaviour.

Comparison 6 CBT versus supportive counselling, Outcome 9 Loss to follow‐up.
Figuras y tablas -
Analysis 6.9

Comparison 6 CBT versus supportive counselling, Outcome 9 Loss to follow‐up.

Comparison 7 Narrative versus supportive counselling, Outcome 1 Improvement.
Figuras y tablas -
Analysis 7.1

Comparison 7 Narrative versus supportive counselling, Outcome 1 Improvement.

Comparison 7 Narrative versus supportive counselling, Outcome 2 PTSD total.
Figuras y tablas -
Analysis 7.2

Comparison 7 Narrative versus supportive counselling, Outcome 2 PTSD total.

Comparison 7 Narrative versus supportive counselling, Outcome 3 Depression.
Figuras y tablas -
Analysis 7.3

Comparison 7 Narrative versus supportive counselling, Outcome 3 Depression.

Comparison 7 Narrative versus supportive counselling, Outcome 4 Loss to follow‐up.
Figuras y tablas -
Analysis 7.4

Comparison 7 Narrative versus supportive counselling, Outcome 4 Loss to follow‐up.

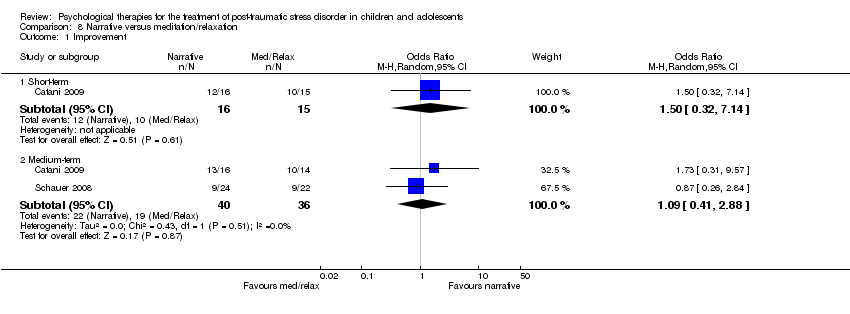
Comparison 8 Narrative versus meditation/relaxation, Outcome 1 Improvement.
Figuras y tablas -
Analysis 8.1

Comparison 8 Narrative versus meditation/relaxation, Outcome 1 Improvement.

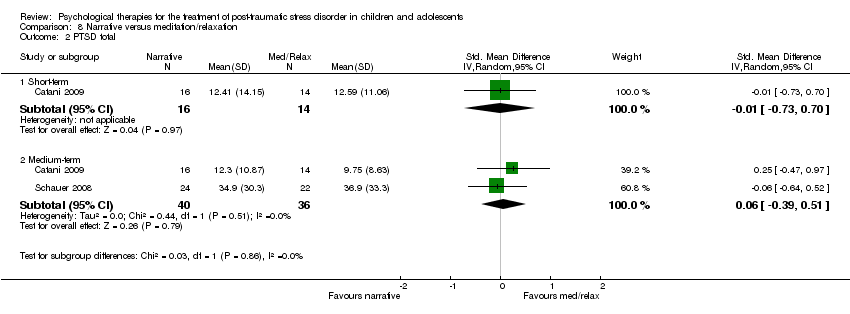
Comparison 8 Narrative versus meditation/relaxation, Outcome 2 PTSD total.
Figuras y tablas -
Analysis 8.2

Comparison 8 Narrative versus meditation/relaxation, Outcome 2 PTSD total.

Comparison 8 Narrative versus meditation/relaxation, Outcome 3 Loss to follow‐up.
Figuras y tablas -
Analysis 8.3

Comparison 8 Narrative versus meditation/relaxation, Outcome 3 Loss to follow‐up.

Comparison 9 Exposure versus interpersonal therapy, Outcome 1 Improvement.
Figuras y tablas -
Analysis 9.1

Comparison 9 Exposure versus interpersonal therapy, Outcome 1 Improvement.

Comparison 9 Exposure versus interpersonal therapy, Outcome 2 PTSD total.
Figuras y tablas -
Analysis 9.2

Comparison 9 Exposure versus interpersonal therapy, Outcome 2 PTSD total.

Comparison 9 Exposure versus interpersonal therapy, Outcome 3 Depression.
Figuras y tablas -
Analysis 9.3

Comparison 9 Exposure versus interpersonal therapy, Outcome 3 Depression.

Comparison 9 Exposure versus interpersonal therapy, Outcome 4 Loss to follow‐up.
Figuras y tablas -
Analysis 9.4

Comparison 9 Exposure versus interpersonal therapy, Outcome 4 Loss to follow‐up.

Comparison 10 Sensitivity analysis: types of therapy, Outcome 1 Improvement.
Figuras y tablas -
Analysis 10.1

Comparison 10 Sensitivity analysis: types of therapy, Outcome 1 Improvement.

Comparison 10 Sensitivity analysis: types of therapy, Outcome 2 PTSD total.
Figuras y tablas -
Analysis 10.2

Comparison 10 Sensitivity analysis: types of therapy, Outcome 2 PTSD total.

Comparison 11 Sensitivity analysis: types of trauma, Outcome 1 Improvement.
Figuras y tablas -
Analysis 11.1

Comparison 11 Sensitivity analysis: types of trauma, Outcome 1 Improvement.

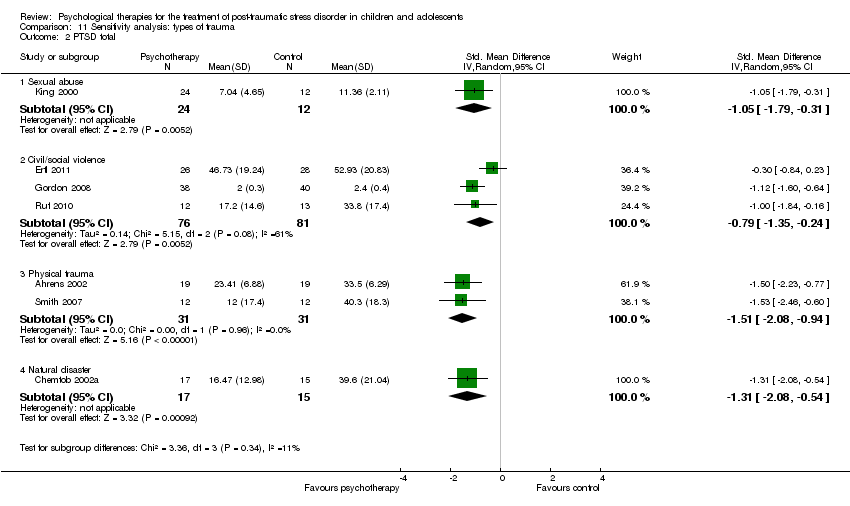
Comparison 11 Sensitivity analysis: types of trauma, Outcome 2 PTSD total.
Figuras y tablas -
Analysis 11.2

Comparison 11 Sensitivity analysis: types of trauma, Outcome 2 PTSD total.

Comparison 12 Sensitivity analysis: allocation concealment, Outcome 1 PTSD total.
Figuras y tablas -
Analysis 12.1

Comparison 12 Sensitivity analysis: allocation concealment, Outcome 1 PTSD total.

Comparison 13 Sensitivity analysis: blinding, Outcome 1 Improvement.
Figuras y tablas -
Analysis 13.1

Comparison 13 Sensitivity analysis: blinding, Outcome 1 Improvement.

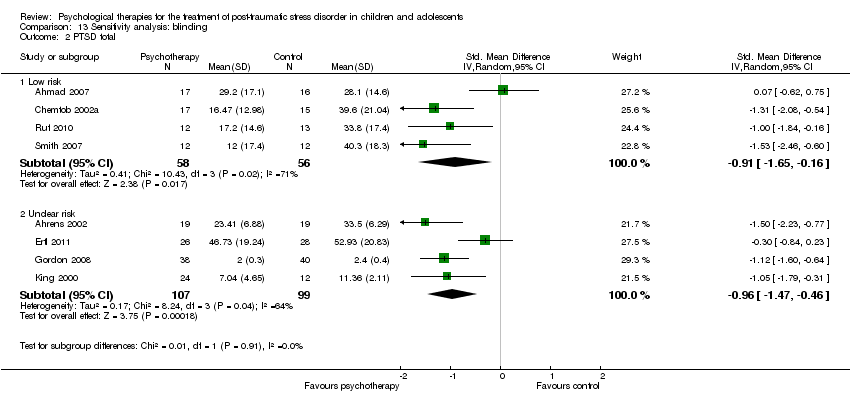
Comparison 13 Sensitivity analysis: blinding, Outcome 2 PTSD total.
Figuras y tablas -
Analysis 13.2

Comparison 13 Sensitivity analysis: blinding, Outcome 2 PTSD total.

Comparison 14 Sensitivity analysis: skewed and non‐skewed data, Outcome 1 PTSD total.
Figuras y tablas -
Analysis 14.1

Comparison 14 Sensitivity analysis: skewed and non‐skewed data, Outcome 1 PTSD total.

Comparison 15 ITT analysis, Outcome 1 Improvement.
Figuras y tablas -
Analysis 15.1

Comparison 15 ITT analysis, Outcome 1 Improvement.

Comparison 1. All psychological therapies versus control

Outcome or subgroup title

No. of studies

No. of participants

Statistical method

Effect size

1 Improvement Show forest plot

4

Odds Ratio (M‐H, Random, 95% CI)

Subtotals only

1.1 Short‐term

2

49

Odds Ratio (M‐H, Random, 95% CI)

8.64 [2.01, 37.14]

1.2 Medium‐term

2

50

Odds Ratio (M‐H, Random, 95% CI)

9.46 [2.46, 36.32]

1.3 Long‐term

1

53

Odds Ratio (M‐H, Random, 95% CI)

1.84 [0.60, 5.65]

2 PTSD total Show forest plot

8

Std. Mean Difference (IV, Random, 95% CI)

Subtotals only

2.1 Short‐term

6

241

Std. Mean Difference (IV, Random, 95% CI)

‐1.05 [‐1.52, ‐0.58]

2.2 Medium‐term

3

115

Std. Mean Difference (IV, Random, 95% CI)

‐0.58 [‐0.97, ‐0.18]

2.3 Long‐term

1

53

Std. Mean Difference (IV, Random, 95% CI)

‐0.44 [‐0.98, 0.11]

3 Anxiety Show forest plot

3

Std. Mean Difference (IV, Random, 95% CI)

Subtotals only

3.1 Short‐term

3

91

Std. Mean Difference (IV, Random, 95% CI)

‐0.57 [1.00, ‐0.13]

3.2 Medium‐term

1

36

Std. Mean Difference (IV, Random, 95% CI)

‐0.63 [‐1.34, 0.08]

4 Depression Show forest plot

6

Std. Mean Difference (IV, Random, 95% CI)

Subtotals only

4.1 Short‐term

5

156

Std. Mean Difference (IV, Random, 95% CI)

‐0.74 [‐1.11, ‐0.36]

4.2 Medium‐term

3

110

Std. Mean Difference (IV, Random, 95% CI)

0.02 [‐0.36, 0.40]

4.3 Long‐term

1

53

Std. Mean Difference (IV, Random, 95% CI)

0.02 [‐0.52, 0.56]

5 Loss to follow‐up Show forest plot

7

Odds Ratio (M‐H, Random, 95% CI)

Subtotals only

5.1 Short‐term

5

208

Odds Ratio (M‐H, Random, 95% CI)

1.59 [0.56, 4.49]

5.2 Medium‐term

3

116

Odds Ratio (M‐H, Random, 95% CI)

1.54 [0.47, 5.04]

5.3 Long‐term

1

57

Odds Ratio (M‐H, Random, 95% CI)

10.06 [0.52, 196.10]

Figuras y tablas -
Comparison 1. All psychological therapies versus control
Comparison 2. CBT versus control

Outcome or subgroup title

No. of studies

No. of participants

Statistical method

Effect size

1 Improvement Show forest plot

2

Odds Ratio (M‐H, Random, 95% CI)

Subtotals only

1.1 Short‐term

2

49

Odds Ratio (M‐H, Random, 95% CI)

8.64 [2.01, 37.14]

1.2 Medium‐term

1

25

Odds Ratio (M‐H, Random, 95% CI)

8.00 [1.21, 52.69]

2 PTSD total Show forest plot

3

Std. Mean Difference (IV, Random, 95% CI)

Subtotals only

2.1 Short‐term

3

98

Std. Mean Difference (IV, Random, 95% CI)

‐1.34 [‐1.79, ‐0.89]

2.2 Medium‐term

1

36

Std. Mean Difference (IV, Random, 95% CI)

‐0.73 [‐1.44, ‐0.01]

3 PTSD avoidance Show forest plot

1

Std. Mean Difference (IV, Random, 95% CI)

Totals not selected

3.1 Short‐term

1

Std. Mean Difference (IV, Random, 95% CI)

0.0 [0.0, 0.0]

3.2 Medium‐term

1

Std. Mean Difference (IV, Random, 95% CI)

0.0 [0.0, 0.0]

4 PTSD hyperarousal Show forest plot

1

Std. Mean Difference (IV, Random, 95% CI)

Totals not selected

4.1 Short‐term

1

Std. Mean Difference (IV, Random, 95% CI)

0.0 [0.0, 0.0]

4.2 Medium‐term

1

Std. Mean Difference (IV, Random, 95% CI)

0.0 [0.0, 0.0]

5 PTSD re‐experiencing Show forest plot

1

Std. Mean Difference (IV, Random, 95% CI)

Totals not selected

5.1 Short‐term

1

Std. Mean Difference (IV, Random, 95% CI)

0.0 [0.0, 0.0]

5.2 Medium‐term

1

Std. Mean Difference (IV, Random, 95% CI)

0.0 [0.0, 0.0]

6 Anxiety Show forest plot

2

Std. Mean Difference (IV, Random, 95% CI)

Subtotals only

6.1 Short‐term

2

59

Std. Mean Difference (IV, Random, 95% CI)

‐0.66 [‐1.33, 0.01]

6.2 Medium‐term

1

36

Std. Mean Difference (IV, Random, 95% CI)

‐0.63 [‐1.34, 0.08]

7 Depression Show forest plot

3

Std. Mean Difference (IV, Random, 95% CI)

Subtotals only

7.1 Short‐term

3

98

Std. Mean Difference (IV, Random, 95% CI)

‐0.80 [‐1.47, ‐0.13]

7.2 Medium‐term

1

36

Std. Mean Difference (IV, Random, 95% CI)

‐0.19 [‐0.88, 0.51]

8 Loss to follow‐up Show forest plot

2

Odds Ratio (M‐H, Random, 95% CI)

Totals not selected

8.1 Short‐term

2

Odds Ratio (M‐H, Random, 95% CI)

0.0 [0.0, 0.0]

Figuras y tablas -
Comparison 2. CBT versus control
Comparison 3. Narrative versus control

Outcome or subgroup title

No. of studies

No. of participants

Statistical method

Effect size

1 Improvement Show forest plot

2

Odds Ratio (M‐H, Random, 95% CI)

Totals not selected

1.1 Medium‐term

1

Odds Ratio (M‐H, Random, 95% CI)

0.0 [0.0, 0.0]

1.2 Long‐term

1

Odds Ratio (M‐H, Random, 95% CI)

0.0 [0.0, 0.0]

2 PTSD total Show forest plot

2

Std. Mean Difference (IV, Random, 95% CI)

Subtotals only

2.1 Medium‐term

2

79

Std. Mean Difference (IV, Random, 95% CI)

‐0.57 [‐1.23, 0.09]

2.2 Long‐term

1

53

Std. Mean Difference (IV, Random, 95% CI)

‐0.44 [‐0.98, 0.11]

3 PTSD avoidance Show forest plot

1

Std. Mean Difference (IV, Random, 95% CI)

Totals not selected

3.1 Medium‐term

1

Std. Mean Difference (IV, Random, 95% CI)

0.0 [0.0, 0.0]

4 PTSD hyperarousal Show forest plot

1

Std. Mean Difference (IV, Random, 95% CI)

Totals not selected

4.1 Medium‐term

1

Std. Mean Difference (IV, Random, 95% CI)

0.0 [0.0, 0.0]

5 PTSD re‐experiencing Show forest plot

1

Std. Mean Difference (IV, Random, 95% CI)

Totals not selected

5.1 Medium‐term

1

Std. Mean Difference (IV, Random, 95% CI)

0.0 [0.0, 0.0]

6 Depression Show forest plot

1

Std. Mean Difference (IV, Random, 95% CI)

Totals not selected

6.1 Medium‐term

1

Std. Mean Difference (IV, Random, 95% CI)

0.0 [0.0, 0.0]

6.2 Long‐term

1

Std. Mean Difference (IV, Random, 95% CI)

0.0 [0.0, 0.0]

7 Loss to follow‐up Show forest plot

2

Odds Ratio (M‐H, Random, 95% CI)

Subtotals only

7.1 Medium‐term

2

83

Odds Ratio (M‐H, Random, 95% CI)

5.13 [0.56, 47.28]

7.2 Long‐term

1

57

Odds Ratio (M‐H, Random, 95% CI)

10.06 [0.52, 196.10]

Figuras y tablas -
Comparison 3. Narrative versus control
Comparison 4. EMDR versus control

Outcome or subgroup title

No. of studies

No. of participants

Statistical method

Effect size

1 PTSD Show forest plot

2

Std. Mean Difference (IV, Random, 95% CI)

Subtotals only

1.1 Short‐term

2

65

Std. Mean Difference (IV, Random, 95% CI)

‐0.61 [‐1.96, 0.74]

2 PTSD avoidance Show forest plot

1

Std. Mean Difference (IV, Random, 95% CI)

Totals not selected

2.1 Short‐term

1

Std. Mean Difference (IV, Random, 95% CI)

0.0 [0.0, 0.0]

3 PTSD hyperarousal Show forest plot

1

Std. Mean Difference (IV, Random, 95% CI)

Totals not selected

3.1 Short‐term

1

Std. Mean Difference (IV, Random, 95% CI)

0.0 [0.0, 0.0]

4 PTSD re‐experiencing Show forest plot

1

Std. Mean Difference (IV, Random, 95% CI)

Totals not selected

4.1 Short‐term

1

Std. Mean Difference (IV, Random, 95% CI)

0.0 [0.0, 0.0]

5 Anxiety Show forest plot

1

Std. Mean Difference (IV, Random, 95% CI)

Totals not selected

5.1 Short‐term

1

Std. Mean Difference (IV, Random, 95% CI)

0.0 [0.0, 0.0]

6 Depression Show forest plot

1

Std. Mean Difference (IV, Random, 95% CI)

Totals not selected

6.1 Short‐term

1

Std. Mean Difference (IV, Random, 95% CI)

0.0 [0.0, 0.0]

7 Loss to follow‐up Show forest plot

1

Odds Ratio (M‐H, Random, 95% CI)

Totals not selected

7.1 Short‐term

1

Odds Ratio (M‐H, Random, 95% CI)

0.0 [0.0, 0.0]

Figuras y tablas -
Comparison 4. EMDR versus control
Comparison 5. Other psychological therapies versus control

Outcome or subgroup title

No. of studies

No. of participants

Statistical method

Effect size

1 PTSD total Show forest plot

1

Std. Mean Difference (IV, Random, 95% CI)

Totals not selected

1.1 Short‐term

1

Std. Mean Difference (IV, Random, 95% CI)

0.0 [0.0, 0.0]

2 PTSD avoidance Show forest plot

1

Odds Ratio (M‐H, Random, 95% CI)

Totals not selected

2.1 Medium‐term

1

Odds Ratio (M‐H, Random, 95% CI)

0.0 [0.0, 0.0]

3 PTSD hyperarousal Show forest plot

1

Odds Ratio (M‐H, Random, 95% CI)

Totals not selected

3.1 Medium‐term

1

Odds Ratio (M‐H, Random, 95% CI)

0.0 [0.0, 0.0]

4 PTSD re‐experiencing Show forest plot

1

Odds Ratio (M‐H, Random, 95% CI)

Totals not selected

4.1 Medium‐term

1

Odds Ratio (M‐H, Random, 95% CI)

0.0 [0.0, 0.0]

5 Depression Show forest plot

1

Std. Mean Difference (IV, Random, 95% CI)

Totals not selected

5.1 Short‐term

1

Std. Mean Difference (IV, Random, 95% CI)

0.0 [0.0, 0.0]

5.2 Medium‐term

1

Std. Mean Difference (IV, Random, 95% CI)

0.0 [0.0, 0.0]

6 Loss to follow‐up Show forest plot

2

Odds Ratio (M‐H, Random, 95% CI)

Subtotals only

6.1 Short‐term

2

115

Odds Ratio (M‐H, Random, 95% CI)

1.38 [0.35, 5.52]

6.2 Medium‐term

1

33

Odds Ratio (M‐H, Random, 95% CI)

0.95 [0.23, 3.88]

Figuras y tablas -
Comparison 5. Other psychological therapies versus control
Comparison 6. CBT versus supportive counselling

Outcome or subgroup title

No. of studies

No. of participants

Statistical method

Effect size

1 Improvement Show forest plot

2

Odds Ratio (M‐H, Random, 95% CI)

Subtotals only

1.1 Short‐term

2

208

Odds Ratio (M‐H, Random, 95% CI)

3.18 [1.76, 5.74]

2 PTSD avoidance Show forest plot

1

Std. Mean Difference (IV, Random, 95% CI)

Totals not selected

2.1 Short‐term

1

Std. Mean Difference (IV, Random, 95% CI)

0.0 [0.0, 0.0]

2.2 Medium‐term

1

Std. Mean Difference (IV, Random, 95% CI)

0.0 [0.0, 0.0]

2.3 Long‐term

1

Std. Mean Difference (IV, Random, 95% CI)

0.0 [0.0, 0.0]

3 PTSD hyperarousal Show forest plot

1

Std. Mean Difference (IV, Random, 95% CI)

Totals not selected

3.1 Short‐term

1

Std. Mean Difference (IV, Random, 95% CI)

0.0 [0.0, 0.0]

3.2 Medium‐term

1

Std. Mean Difference (IV, Random, 95% CI)

0.0 [0.0, 0.0]

3.3 Long‐term

1

Std. Mean Difference (IV, Random, 95% CI)

0.0 [0.0, 0.0]

4 PTSD re‐experiencing Show forest plot

1

Std. Mean Difference (IV, Random, 95% CI)

Totals not selected

4.1 Short‐term

1

Std. Mean Difference (IV, Random, 95% CI)

0.0 [0.0, 0.0]

4.2 Medium‐term

1

Std. Mean Difference (IV, Random, 95% CI)

0.0 [0.0, 0.0]

5 Anxiety state Show forest plot

1

Std. Mean Difference (IV, Random, 95% CI)

Totals not selected

5.1 Short‐term

1

Std. Mean Difference (IV, Random, 95% CI)

0.0 [0.0, 0.0]

5.2 Medium‐term

1

Std. Mean Difference (IV, Random, 95% CI)

0.0 [0.0, 0.0]

5.3 Long‐term

1

Std. Mean Difference (IV, Random, 95% CI)

0.0 [0.0, 0.0]

6 Anxiety trait Show forest plot

1

Std. Mean Difference (IV, Random, 95% CI)

Totals not selected

6.1 Short‐term

1

Std. Mean Difference (IV, Random, 95% CI)

0.0 [0.0, 0.0]

6.2 Medium‐term

1

Std. Mean Difference (IV, Random, 95% CI)

0.0 [0.0, 0.0]

6.3 Long‐term

1

Std. Mean Difference (IV, Random, 95% CI)

0.0 [0.0, 0.0]

7 Depression Show forest plot

1

Std. Mean Difference (IV, Random, 95% CI)

Totals not selected

7.1 Short‐term

1

Std. Mean Difference (IV, Random, 95% CI)

0.0 [0.0, 0.0]

8 Behaviour Show forest plot

1

Std. Mean Difference (IV, Random, 95% CI)

Totals not selected

8.1 Short‐term

1

Std. Mean Difference (IV, Random, 95% CI)

0.0 [0.0, 0.0]

8.2 Medium‐term

1

Std. Mean Difference (IV, Random, 95% CI)

0.0 [0.0, 0.0]

8.3 Long‐term

1

Std. Mean Difference (IV, Random, 95% CI)

0.0 [0.0, 0.0]

9 Loss to follow‐up Show forest plot

1

Odds Ratio (M‐H, Random, 95% CI)

Totals not selected

9.1 Short‐term

1

Odds Ratio (M‐H, Random, 95% CI)

0.0 [0.0, 0.0]

9.2 Medium‐term

1

Odds Ratio (M‐H, Random, 95% CI)

0.0 [0.0, 0.0]

9.3 Long‐term

1

Odds Ratio (M‐H, Random, 95% CI)

0.0 [0.0, 0.0]

Figuras y tablas -
Comparison 6. CBT versus supportive counselling
Comparison 7. Narrative versus supportive counselling

Outcome or subgroup title

No. of studies

No. of participants

Statistical method

Effect size

1 Improvement Show forest plot

1

Odds Ratio (M‐H, Random, 95% CI)

Totals not selected

1.1 Long‐term

1

Odds Ratio (M‐H, Random, 95% CI)

0.0 [0.0, 0.0]

2 PTSD total Show forest plot

1

Std. Mean Difference (IV, Random, 95% CI)

Totals not selected

2.1 Medium‐term

1

Std. Mean Difference (IV, Random, 95% CI)

0.0 [0.0, 0.0]

2.2 Long‐term

1

Std. Mean Difference (IV, Random, 95% CI)

0.0 [0.0, 0.0]

3 Depression Show forest plot

1

Std. Mean Difference (IV, Random, 95% CI)

Totals not selected

3.1 Medium‐term

1

Std. Mean Difference (IV, Random, 95% CI)

0.0 [0.0, 0.0]

3.2 Long‐term

1

Std. Mean Difference (IV, Random, 95% CI)

0.0 [0.0, 0.0]

4 Loss to follow‐up Show forest plot

1

Odds Ratio (M‐H, Random, 95% CI)

Totals not selected

4.1 Medium‐term

1

Odds Ratio (M‐H, Random, 95% CI)

0.0 [0.0, 0.0]

4.2 Long‐term

1

Odds Ratio (M‐H, Random, 95% CI)

0.0 [0.0, 0.0]

Figuras y tablas -
Comparison 7. Narrative versus supportive counselling
Comparison 8. Narrative versus meditation/relaxation

Outcome or subgroup title

No. of studies

No. of participants

Statistical method

Effect size

1 Improvement Show forest plot

2

Odds Ratio (M‐H, Random, 95% CI)

Subtotals only

1.1 Short‐term

1

31

Odds Ratio (M‐H, Random, 95% CI)

1.5 [0.32, 7.14]

1.2 Medium‐term

2

76

Odds Ratio (M‐H, Random, 95% CI)

1.09 [0.41, 2.88]

2 PTSD total Show forest plot

2

Std. Mean Difference (IV, Random, 95% CI)

Subtotals only

2.1 Short‐term

1

30

Std. Mean Difference (IV, Random, 95% CI)

‐0.01 [‐0.73, 0.70]

2.2 Medium‐term

2

76

Std. Mean Difference (IV, Random, 95% CI)

0.06 [‐0.39, 0.51]

3 Loss to follow‐up Show forest plot

2

Odds Ratio (M‐H, Random, 95% CI)

Subtotals only

3.1 Short‐term

1

31

Odds Ratio (M‐H, Random, 95% CI)

0.0 [0.0, 0.0]

3.2 Medium‐term

2

78

Odds Ratio (M‐H, Random, 95% CI)

0.29 [0.03, 2.89]

Figuras y tablas -
Comparison 8. Narrative versus meditation/relaxation
Comparison 9. Exposure versus interpersonal therapy

Outcome or subgroup title

No. of studies

No. of participants

Statistical method

Effect size

1 Improvement Show forest plot

1

Odds Ratio (M‐H, Random, 95% CI)

Totals not selected

1.1 Short‐term

1

Odds Ratio (M‐H, Random, 95% CI)

0.0 [0.0, 0.0]

1.2 Medium‐term

1

Odds Ratio (M‐H, Random, 95% CI)

0.0 [0.0, 0.0]

2 PTSD total Show forest plot

1

Std. Mean Difference (IV, Random, 95% CI)

Totals not selected

2.1 Short‐term

1

Std. Mean Difference (IV, Random, 95% CI)

0.0 [0.0, 0.0]

2.2 Medium‐term

1

Std. Mean Difference (IV, Random, 95% CI)

0.0 [0.0, 0.0]

2.3 Long‐term

1

Std. Mean Difference (IV, Random, 95% CI)

0.0 [0.0, 0.0]

3 Depression Show forest plot

1

Std. Mean Difference (IV, Random, 95% CI)

Totals not selected

3.1 Short‐term

1

Std. Mean Difference (IV, Random, 95% CI)

0.0 [0.0, 0.0]

3.2 Medium‐term

1

Std. Mean Difference (IV, Random, 95% CI)

0.0 [0.0, 0.0]

3.3 Long‐term

1

Std. Mean Difference (IV, Random, 95% CI)

0.0 [0.0, 0.0]

4 Loss to follow‐up Show forest plot

1

Odds Ratio (M‐H, Random, 95% CI)

Totals not selected

4.1 Short‐term

1

Odds Ratio (M‐H, Random, 95% CI)

0.0 [0.0, 0.0]

4.2 Medium‐term

1

Odds Ratio (M‐H, Random, 95% CI)

0.0 [0.0, 0.0]

4.3 Long‐term

1

Odds Ratio (M‐H, Random, 95% CI)

0.0 [0.0, 0.0]

Figuras y tablas -
Comparison 9. Exposure versus interpersonal therapy
Comparison 10. Sensitivity analysis: types of therapy

Outcome or subgroup title

No. of studies

No. of participants

Statistical method

Effect size

1 Improvement Show forest plot

4

Odds Ratio (M‐H, Random, 95% CI)

Subtotals only

1.1 CBT

2

49

Odds Ratio (M‐H, Random, 95% CI)

8.64 [2.01, 37.14]

1.2 Narrative

2

78

Odds Ratio (M‐H, Random, 95% CI)

3.82 [0.67, 21.80]

2 PTSD total Show forest plot

8

Std. Mean Difference (IV, Random, 95% CI)

Subtotals only

2.1 CBT

3

98

Std. Mean Difference (IV, Random, 95% CI)

‐1.34 [‐1.79, ‐0.89]

2.2 Narrative

2

79

Std. Mean Difference (IV, Random, 95% CI)

‐0.57 [‐1.23, 0.09]

2.3 EMDR

2

65

Std. Mean Difference (IV, Random, 95% CI)

‐0.61 [‐1.96, 0.74]

2.4 Other psychological therapies

1

78

Std. Mean Difference (IV, Random, 95% CI)

‐1.12 [‐1.60, ‐0.64]

Figuras y tablas -
Comparison 10. Sensitivity analysis: types of therapy
Comparison 11. Sensitivity analysis: types of trauma

Outcome or subgroup title

No. of studies

No. of participants

Statistical method

Effect size

1 Improvement Show forest plot

4

Odds Ratio (M‐H, Random, 95% CI)

Subtotals only

1.1 Sexual abuse

1

25

Odds Ratio (M‐H, Random, 95% CI)

6.0 [0.93, 38.63]

1.2 Civil/social violence

2

78

Odds Ratio (M‐H, Random, 95% CI)

3.82 [0.67, 21.80]

1.3 Physical trauma

1

24

Odds Ratio (M‐H, Random, 95% CI)

15.40 [1.47, 160.97]

2 PTSD total Show forest plot

7

Std. Mean Difference (IV, Random, 95% CI)

Subtotals only

2.1 Sexual abuse

1

36

Std. Mean Difference (IV, Random, 95% CI)

‐1.05 [‐1.79, ‐0.31]

2.2 Civil/social violence

3

157

Std. Mean Difference (IV, Random, 95% CI)

‐0.79 [‐1.35, ‐0.24]

2.3 Physical trauma

2

62

Std. Mean Difference (IV, Random, 95% CI)

‐1.51 [‐2.08, ‐0.94]

2.4 Natural disaster

1

32

Std. Mean Difference (IV, Random, 95% CI)

‐1.31 [‐2.08, ‐0.54]

Figuras y tablas -
Comparison 11. Sensitivity analysis: types of trauma
Comparison 12. Sensitivity analysis: allocation concealment

Outcome or subgroup title

No. of studies

No. of participants

Statistical method

Effect size

1 PTSD total Show forest plot

8

Std. Mean Difference (IV, Random, 95% CI)

Subtotals only

1.1 Low risk

1

78

Std. Mean Difference (IV, Random, 95% CI)

‐1.12 [‐1.60, ‐0.64]

1.2 Unclear risk

7

242

Std. Mean Difference (IV, Random, 95% CI)

‐0.90 [‐1.38, ‐0.43]

Figuras y tablas -
Comparison 12. Sensitivity analysis: allocation concealment
Comparison 13. Sensitivity analysis: blinding

Outcome or subgroup title

No. of studies

No. of participants

Statistical method

Effect size

1 Improvement Show forest plot

4

Odds Ratio (M‐H, Random, 95% CI)

Subtotals only

1.1 Low risk

2

49

Odds Ratio (M‐H, Random, 95% CI)

12.76 [2.89, 56.44]

1.2 Unclear risk

1

53

Odds Ratio (M‐H, Random, 95% CI)

1.84 [0.60, 5.65]

1.3 High risk

1

25

Odds Ratio (M‐H, Random, 95% CI)

6.0 [0.93, 38.63]

2 PTSD total Show forest plot

8

Std. Mean Difference (IV, Random, 95% CI)

Subtotals only

2.1 Low risk

4

114

Std. Mean Difference (IV, Random, 95% CI)

‐0.91 [‐1.65, ‐0.16]

2.2 Unclear risk

4

206

Std. Mean Difference (IV, Random, 95% CI)

‐0.96 [‐1.47, ‐0.46]

Figuras y tablas -
Comparison 13. Sensitivity analysis: blinding
Comparison 14. Sensitivity analysis: skewed and non‐skewed data

Outcome or subgroup title

No. of studies

No. of participants

Statistical method

Effect size

1 PTSD total Show forest plot

7

Std. Mean Difference (IV, Random, 95% CI)

Subtotals only

1.1 Non‐skewed

4

206

Std. Mean Difference (IV, Random, 95% CI)

‐0.96 [‐1.47, ‐0.46]

1.2 Skewed

3

90

Std. Mean Difference (IV, Random, 95% CI)

‐0.73 [‐1.59, 0.14]

Figuras y tablas -
Comparison 14. Sensitivity analysis: skewed and non‐skewed data
Comparison 15. ITT analysis

Outcome or subgroup title

No. of studies

No. of participants

Statistical method

Effect size

1 Improvement Show forest plot

3

Odds Ratio (M‐H, Random, 95% CI)

Subtotals only

1.1 Best‐case

3

116

Odds Ratio (M‐H, Random, 95% CI)

5.79 [1.66, 20.12]

1.2 Worst‐case

3

116

Odds Ratio (M‐H, Random, 95% CI)

2.02 [0.74, 5.50]

Figuras y tablas -
Comparison 15. ITT analysis