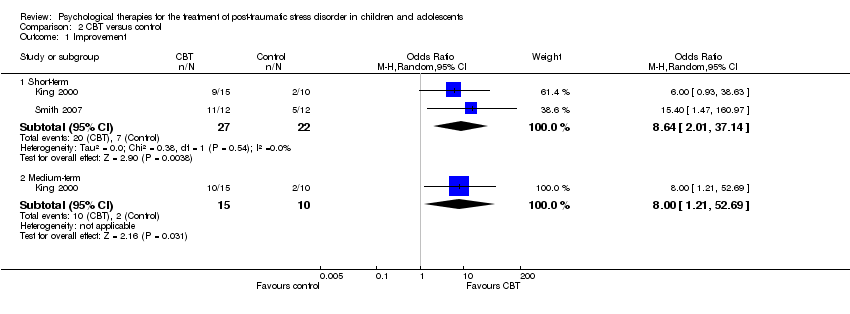
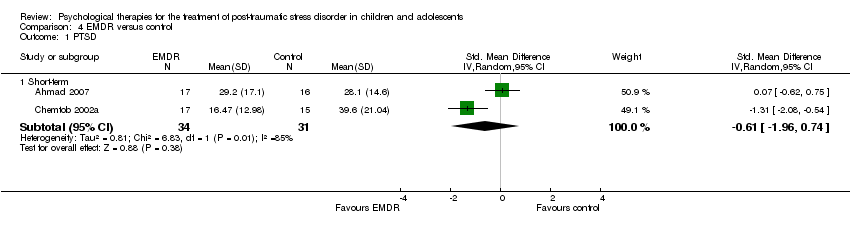
| 1 Improvement Show forest plot | 2 | | Odds Ratio (M‐H, Random, 95% CI) | Subtotals only |
|
| 1.1 Short‐term | 2 | 208 | Odds Ratio (M‐H, Random, 95% CI) | 3.18 [1.76, 5.74] |
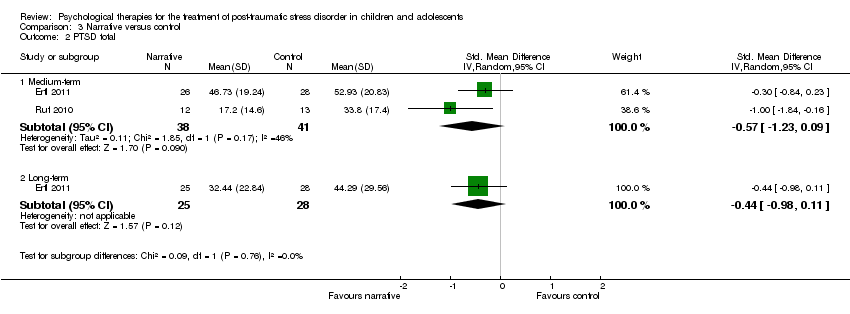
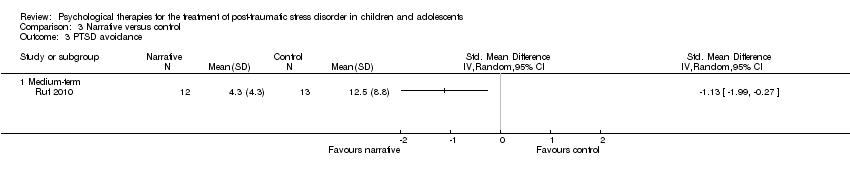
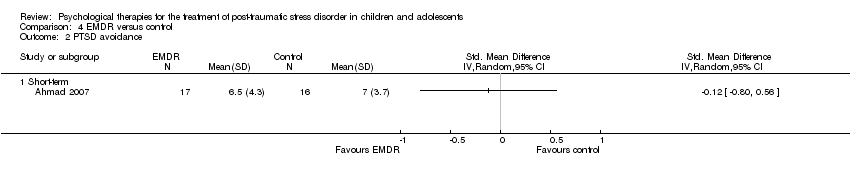
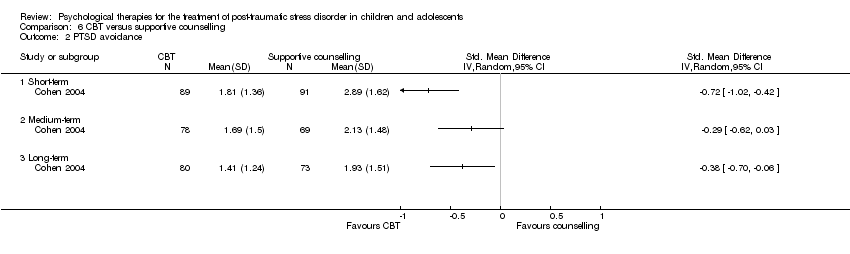
| 2 PTSD avoidance Show forest plot | 1 | | Std. Mean Difference (IV, Random, 95% CI) | Totals not selected |
|
| 2.1 Short‐term | 1 | | Std. Mean Difference (IV, Random, 95% CI) | 0.0 [0.0, 0.0] |
| 2.2 Medium‐term | 1 | | Std. Mean Difference (IV, Random, 95% CI) | 0.0 [0.0, 0.0] |
| 2.3 Long‐term | 1 | | Std. Mean Difference (IV, Random, 95% CI) | 0.0 [0.0, 0.0] |
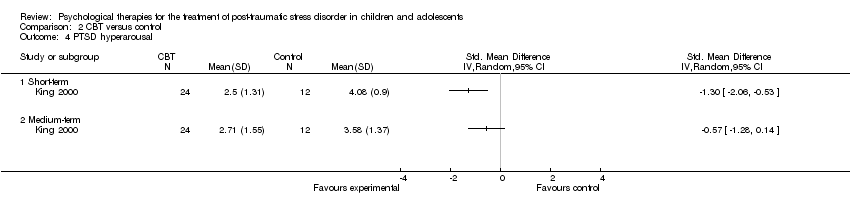
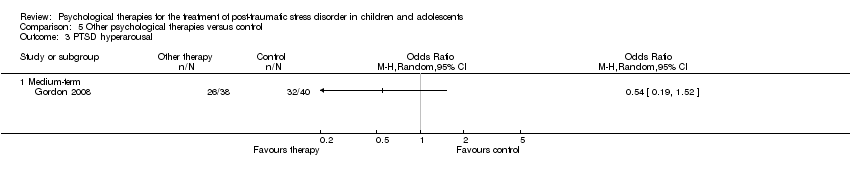
| 3 PTSD hyperarousal Show forest plot | 1 | | Std. Mean Difference (IV, Random, 95% CI) | Totals not selected |
|
| 3.1 Short‐term | 1 | | Std. Mean Difference (IV, Random, 95% CI) | 0.0 [0.0, 0.0] |
| 3.2 Medium‐term | 1 | | Std. Mean Difference (IV, Random, 95% CI) | 0.0 [0.0, 0.0] |
| 3.3 Long‐term | 1 | | Std. Mean Difference (IV, Random, 95% CI) | 0.0 [0.0, 0.0] |
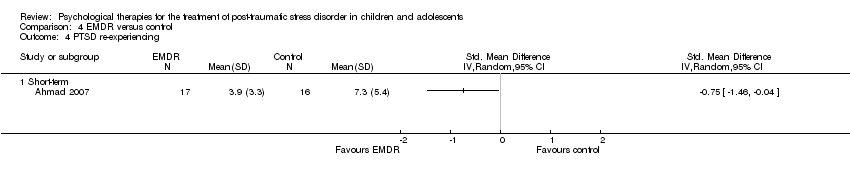
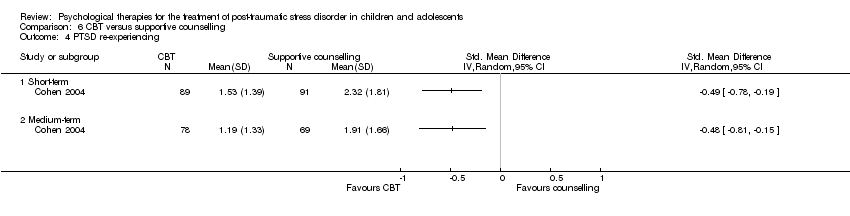
| 4 PTSD re‐experiencing Show forest plot | 1 | | Std. Mean Difference (IV, Random, 95% CI) | Totals not selected |
|
| 4.1 Short‐term | 1 | | Std. Mean Difference (IV, Random, 95% CI) | 0.0 [0.0, 0.0] |
| 4.2 Medium‐term | 1 | | Std. Mean Difference (IV, Random, 95% CI) | 0.0 [0.0, 0.0] |
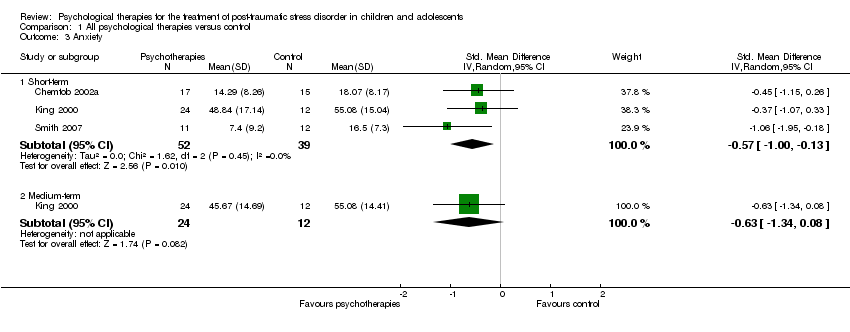
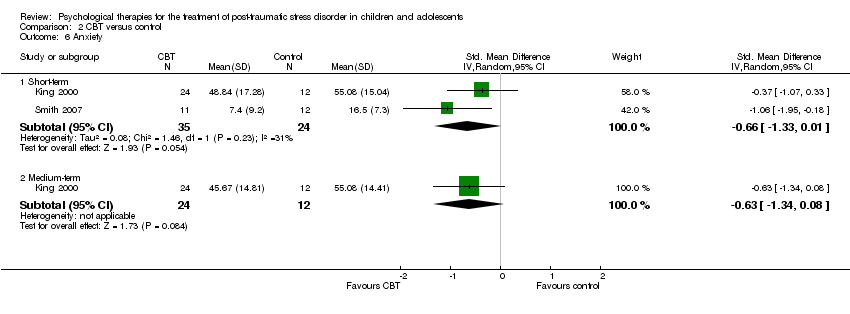
| 5 Anxiety state Show forest plot | 1 | | Std. Mean Difference (IV, Random, 95% CI) | Totals not selected |
|
| 5.1 Short‐term | 1 | | Std. Mean Difference (IV, Random, 95% CI) | 0.0 [0.0, 0.0] |
| 5.2 Medium‐term | 1 | | Std. Mean Difference (IV, Random, 95% CI) | 0.0 [0.0, 0.0] |
| 5.3 Long‐term | 1 | | Std. Mean Difference (IV, Random, 95% CI) | 0.0 [0.0, 0.0] |
| 6 Anxiety trait Show forest plot | 1 | | Std. Mean Difference (IV, Random, 95% CI) | Totals not selected |
|
| 6.1 Short‐term | 1 | | Std. Mean Difference (IV, Random, 95% CI) | 0.0 [0.0, 0.0] |
| 6.2 Medium‐term | 1 | | Std. Mean Difference (IV, Random, 95% CI) | 0.0 [0.0, 0.0] |
| 6.3 Long‐term | 1 | | Std. Mean Difference (IV, Random, 95% CI) | 0.0 [0.0, 0.0] |
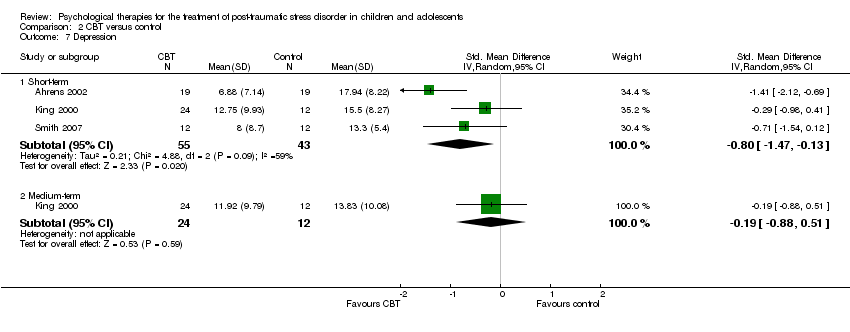
| 7 Depression Show forest plot | 1 | | Std. Mean Difference (IV, Random, 95% CI) | Totals not selected |
|
| 7.1 Short‐term | 1 | | Std. Mean Difference (IV, Random, 95% CI) | 0.0 [0.0, 0.0] |
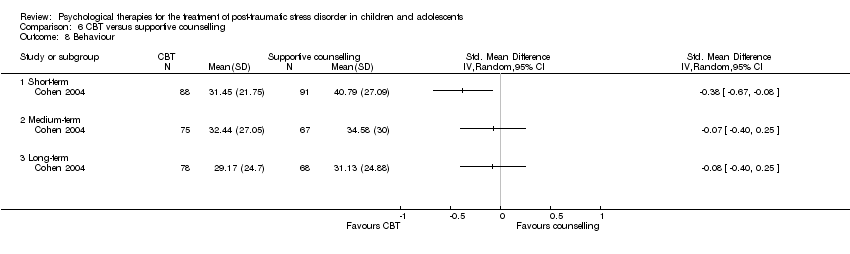
| 8 Behaviour Show forest plot | 1 | | Std. Mean Difference (IV, Random, 95% CI) | Totals not selected |
|
| 8.1 Short‐term | 1 | | Std. Mean Difference (IV, Random, 95% CI) | 0.0 [0.0, 0.0] |
| 8.2 Medium‐term | 1 | | Std. Mean Difference (IV, Random, 95% CI) | 0.0 [0.0, 0.0] |
| 8.3 Long‐term | 1 | | Std. Mean Difference (IV, Random, 95% CI) | 0.0 [0.0, 0.0] |
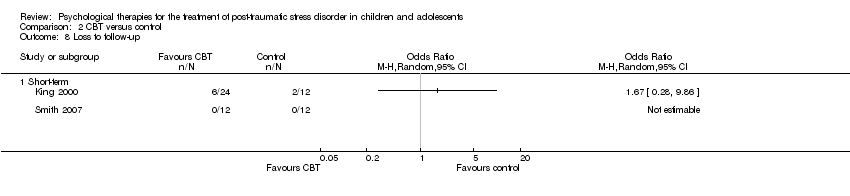
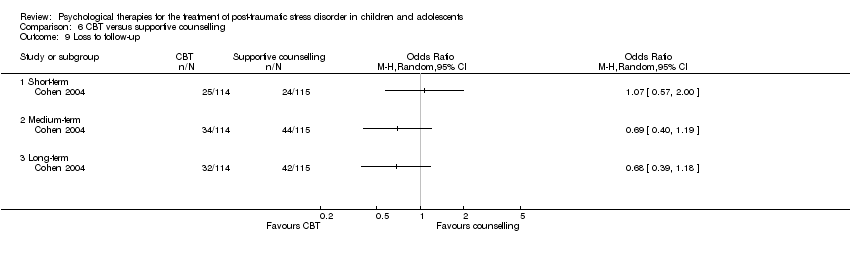
| 9 Loss to follow‐up Show forest plot | 1 | | Odds Ratio (M‐H, Random, 95% CI) | Totals not selected |
|
| 9.1 Short‐term | 1 | | Odds Ratio (M‐H, Random, 95% CI) | 0.0 [0.0, 0.0] |
| 9.2 Medium‐term | 1 | | Odds Ratio (M‐H, Random, 95% CI) | 0.0 [0.0, 0.0] |
| 9.3 Long‐term | 1 | | Odds Ratio (M‐H, Random, 95% CI) | 0.0 [0.0, 0.0] |