| Parameters | Results |
| Different radiotherapy schedules (Eight versus two fractions) | |
| Overall ambulatory rates (short term) | 95/134 (71%) versus 97/142 (68%) RR 1.02; (95% CI 0.90 to 1.15) (n = 276). |
| Pretreatment ambulant participants maintaining ambulation (short term) | 83/91 (91%) versus 83/93 (89%) RR 1.02; (95% CI 0.93 to 1.12) (n = 184). |
| Pretreatment non‐ambulant participants regaining ambulation (short term) | 12/43 (28%) versus 14/49 (29%) RR 0.98; (95% CI 0.51 to 1.88) (n = 92) |
| Median duration of ambulation | 3.5 months in both arms (excluding 17 early deaths) |
| Survival | Four months in both arms (excluding 17 early deaths), five months in pretreatment ambulant participants and three months in pretreatment non‐ambulant participants. |
| Pain relief (short term) | 61/126 (48%) versus 52/136 (38%) RR 1.24; (95% CI 0.94 to 1.64) (n = 262) |
| Urinary continence (short term) | 118/134 (89%) versus 128/142 (90%) RR 0.97; (95% CI 0.93 to 1.02) (n = 275) |
| Participants maintaining urinary continence (short term) | 116/120 (97%) versus 126/126 (100%) RR 0.97; (95% CI 0.93 to 1.00) (n = 246) |
| Participants regaining urinary continence (short term) | 2/13 (15%) versus 2/16 (13%) RR 1.23; (95% CI 0.20 to 7.58) (n = 29) |
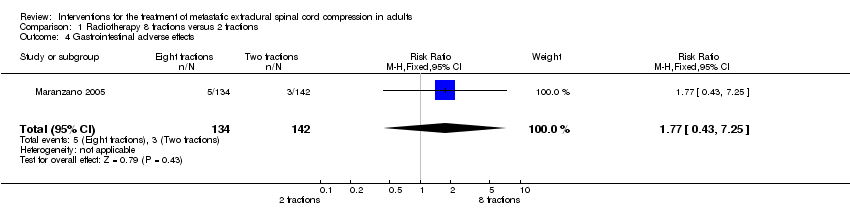
| Adverse effects (early) | Grade three acute gastrointestinal mucositis attributable to radiation ‐ 5/134 (4%) versus 3/142 (2%) RR 1.77; (95% CI 0.43 to 7.25) 6/276 participants had Grade three vomiting; the incidence was similar in both the arms. Grade three nausea was present in 5/276 participants (n = 276). |
| Adverse effects (late) | No documented late radiation myelopathy or serious adverse effects |
| Outcomes not reported | Survival rates, quality of life, participant and caregiver satisfaction. |
| Laminectomy plus radiotherapy versus radiotherapy alone | |
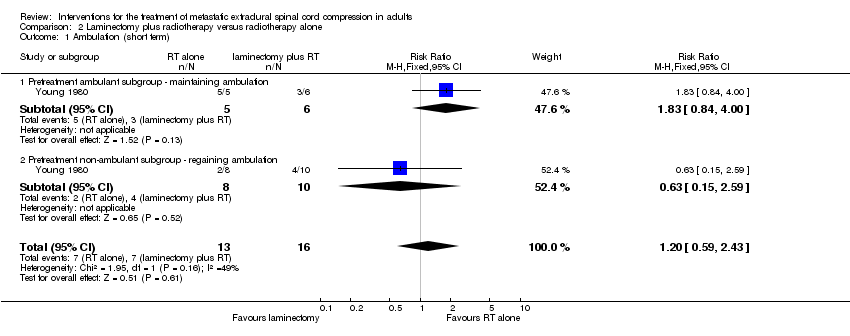
| Overall ambulatory rates (short term) | 7 /16 (44%) versus 7/13 (54%) RR 1.20; (95% CI 0.59 to 2.43) (n = 29) |
| Pretreatment ambulant participants maintaining ambulation (short term) | 3/6 (50%) versus 5/5 (100%) RR 1.83; (95% CI 0.84 to 4.00) (n = 11) |
| Pretreatment non‐ambulant participants regaining ambulation (short term) | 4/10 (40%) versus 2/8 (25%) RR 0.63; (95% CI 0.15 to 2.59) (n = 18) |
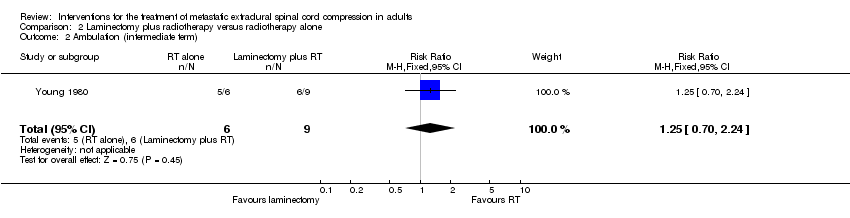
| Overall ambulatory rates (intermediate term) | 6/9 (67%) versus 5/6 (83%) RR 1.25; (95% CI 0.70 to 2.24) (n = 15) |
| Survival (short term) | 16/16 (100%) versus 10/13 (76%) RR 0.77; (95% CI 0.56 to 1.06) (n = 29) |
| Survival (Intermediate term) | 9/16 (56%) versus 6/13 (46%) RR 0.82; (95% CI 0.40 to 1.70) (n = 29) |
| Pain relief | 8/14 (57%) versus 6/12 (50%) RR 0.88; (95% CI 0.42 to 1.81) (n = 26) |
| Overall urinary continence (short term) | 7/16 (44%) versus 7/13 (54%) 95% CI RR 0.94; (95% CI 0.50 to 1.77) (n = 29) |
| Proportion of participants maintaining urinary continence (short term) | 6/8 (75%) versus 6/10 (60%) RR 0.80; (95% CI 0.42 to 1.52) (n = 18) |
| Proportion of participants regaining urinary continence (short term) | 1/8 (13%) versus 1/3 (33%) RR 2.67; (95% CI 0.23 to 30.40) (n = 11) |
| Overall urinary continence (intermediate term) | 6/9 (67%) versus 6/6 (100%) RR 1.43; (95% CI 0.87 to 2.35) (n = 15) |
| Adverse effects | There were no surgery or radiotherapy related complications |
| Outcomes not reported | Quality of life, participant and caregiver satisfaction. |
| Direct decompressive surgery with radiotherapy versus radiotherapy | |
| Overall ambulatory rates (short term) | 29/51 (57%) versus 42/50 (84%), RR 0.67; (95% CI 0.53 to 0.86) (n = 101), NNTB 3.70 (95% CI 2.38 to 7.69) |
| Proportion of pretreatment ambulant participants maintaining ambulation (short term) | 26/35 (74%) versus 32/34 (94%) RR 0.79; (95% CI 0.64 to 0.98) (n = 69), NNTB 5.00 (95% CI 2.78 to 33.33) |
| Proportion of pretreatment non‐ambulant participants regaining ambulation (short term) | 3/16 (19%) versus 10/16 (63%) RR 0.30; (95% CI 0.10 to 0.89) (n = 32), NNTB 2.27 (95% CI 1.35 to 7.69) |
| Median duration of ambulation | The median duration of ambulation was 13 days versus 122 days, (those maintaining ambulation 54 days versus 153 days and regaining ambulation was 0 versus 59 days) |
| Survival (short term) | 44/51 (86%) versus 47/50 (94%) RR 0.92; (95% CI 0.81 to 1.05) (n = 101) |
| Median survival | 100 days versus 126 days |
| Outcomes not reported | Quality of life, participant and care giver satisfaction were not assessed. Participant rated pain relief , adverse effects and dichotomous data for analgesic reduction and urinary continence |
| High dose corticosteroids versus no or moderate dose corticosteroids | |
| Overall ambulatory rates (short term) | RR 0.91; (95% CI 0.68 to 1.23) (n = 105, three trials) |
| Proportion of pretreatment ambulant participants maintaining ambulation (short term) | 17/17 (100%) versus 17/19 (90%) RR 0.90; (95% CI 0.75 to 1.08) (n = 36, one trial) |
| Proportion of pretreatment non‐ambulant participants regaining ambulation (short term) | 5/10 (50%) versus 2/11 (18%) RR 0.36; (95% CI 0.09 to 1.47) (n = 21, one trial) |
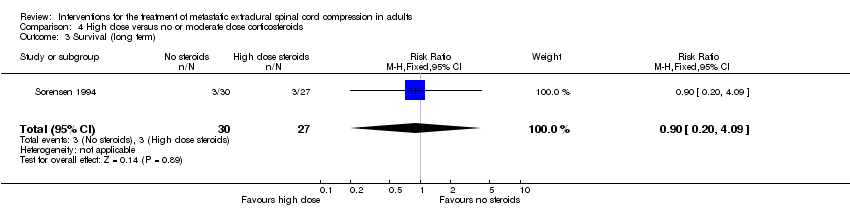
| Survival (long term) | 5/10 (50%) versus 2/11 (18%) RR 0.36; (95% CI 0.09 to 1.47) (n = 21, one trial) |
| Pain relief | 11/14 (79%) versus 10/11(91%) RR 1.16; (95% CI 0.83 to 1.61) (n = 25, one trial) |
| Urinary continence | 12/19 (63%) versus 8/15 (53%) RR 0.84; (95% CI 0.47 to 1.52) (n = 34, one trial) |
| Adverse effects | High dose corticosteroids versus no or moderate dose corticosteroids RR 0.12; (95% CI 0.02 to 0.97) (n = 77, two trials) High dose versus no corticosteroids RR 0.10; (95% CI 0.01 to 1.78) (n = 57, one trial) High dose versus moderate dose corticosteroids RR 0.17; (95% CI 0.01 to 3.08) (n = 20, one trial) |
| Outcomes not reported | Quality of life, participant rated and care giver satisfaction. Intermediate term outcomes from Sorensen 1994 could not be calculated as survival rates were not available. |