| | Poor vision outcome due to MO | Quality of life/patient satisfaction | Central retinal thickness | Adverse effects reported | CMO | Inflammation | BCVA | Additional outcomes |
| Study | Follow‐up | Analysis 1.1 | No analysis; only one study reported this | Analysis 1.2; Analysis 2.1 | Table 7 | Analysis 1.4; Analysis 2.2 | Analysis 1.5; Analysis 1.6; Analysis 2.3 | Analysis 1.7; Analysis 2.4 | Analysis 1.3 |
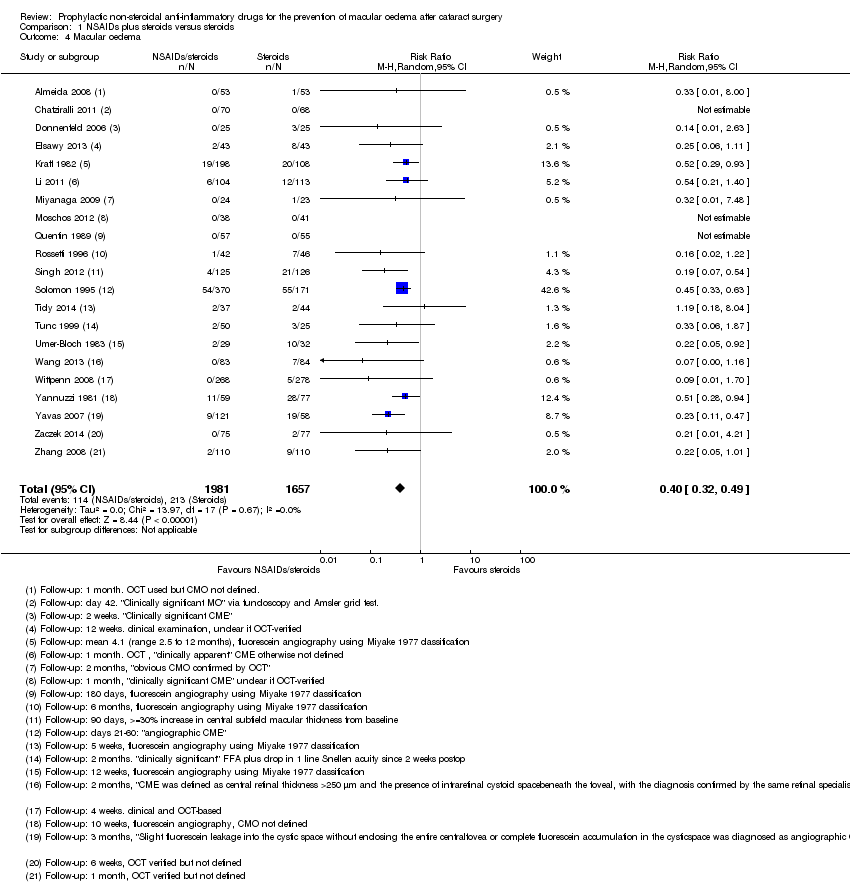
| Almeida 2008 | 1 month | | | | Yes | OCT used but CMO not defined | | | Change in total macular volume |
| Almeida 2012 | 1 month | | COMTOL questionnaire | Mean change reported but not possible to calculate SD | | | | LogMAR | Change in total macular volume; change in average macular cube thickness |
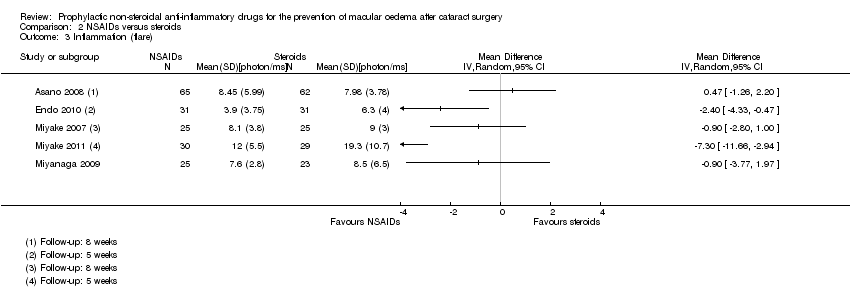
| Asano 2008 | 8 weeks | | | | Yes | Fluorescein angiography using Miyake 1977 classification (at 5 weeks only) | Laser flare‐cell photometry, mean value of anterior chamber flare (photons/millisecond) | LogMAR, final value | |
| Brown 1996 | 1 month | | | | | | Laser flare‐cell photometry, mean value of anterior chamber flare reported (photons) but was not possible to calculate SD | | |
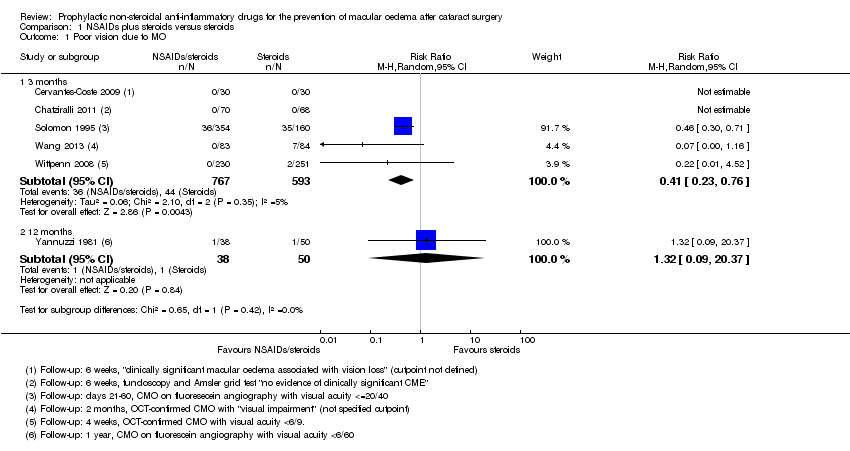
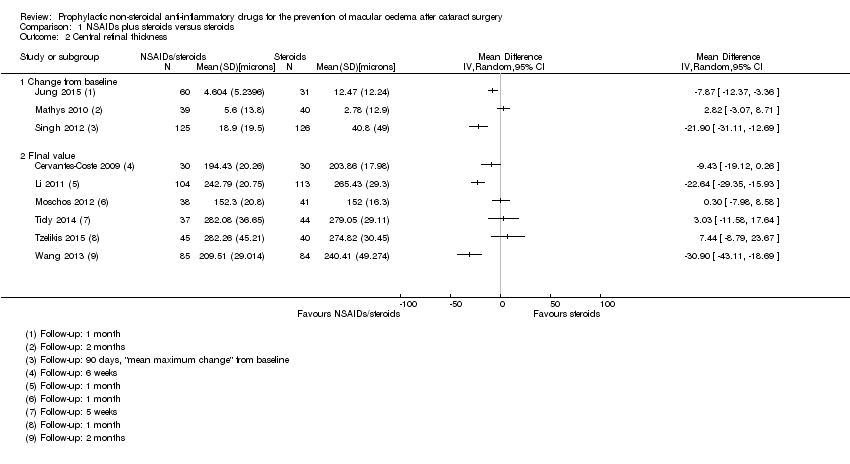
| Cervantes‐Coste 2009 | 6 weeks | Quote: "None of the patients developed clinically significant macular oedema associated with vision loss" | | Final value | Yes | Only reported CMO associated with vision loss | "Inflammatory cells greater than 1+ during first week of postoperative visits" | | Total macular volume |
| Chatziralli 2011 | 6 weeks | Fundoscopy and Amsler grid test Quote: "no evidence of clinically significant CME" | | | Yes | "No evidence of clinically significant CME was detected in any patient via fundoscopy and the Amsler grid test" | Corneal oedema or Tyndall reaction or conjunctival hyperaemia | LogMAR, final value | |
| Donnenfeld 2006 | 3 months | | | | Yes | "Clinically significant CME" but otherwise not defined, at 2 weeks only | "Mean inflammation score" but was not possible to calculate SD | LogMAR, final value but could not extract data on SD | |
| Elsawy 2013 | 12 weeks | | | | | Clinical examination, unclear if OCT‐verified | | | |
| Endo 2010 | 6 weeks | | | Final value | Yes | | Anterior chamber flare values, photon count per millisecond | LogMAR, final value | |
| Italian Diclofenac Study Group 1997 | 140 days | | | | Yes | Fluorescein angiography using Miyake 1977 classification | | | |
| Jung 2015 | 1 month | | | Change | Yes | | "Inflammatory score" (sum of anterior chamber cells and flare grade" | | Change in macular volume |
| Kraff 1982 | Between 2.5 and 12 months | | | | Yes | Fluorescein angiography using Miyake 1977 classification | | Snellen acuity only, not included in analyses | |
| Li 2011 | 1 month | | | Final value | | OCT, "clinically apparent" CME otherwise not defined | | Snellen acuity only, not included in analyses | |
| Mathys 2010 | 2 months | | | Change from baseline | Yes | | | LogMAR | Change in foveal thickness, change in macular volume |
| Miyake 2007 | 5 weeks | | | | | Fluorescein angiography using Miyake 1977 classification | Unit of measurement unclear | Snellen acuity only, not included in analyses | |
| Miyake 2011 | 5 weeks | | | Final value | Yes | Fluorescein angiography using Miyake 1977 classification | Flare (photons/millisec), final value | | Change in logMAR BCVA, categorical 3+, 2, 1 lines increase and no change |
| Miyanaga 2009 | 2 months | | | | Yes | "Obvious CMO confirmed by OCT" | Aqueous flare (photons/millisecond) | LogMAR, final value | |
| Moschos 2012 | 1 month | | | Final value | | | | LogMAR, final value | |
| Quentin 1989 | 180 days | | | | Yes | Fluorescein angiography using Miyake 1977 classification | | Snellen acuity only, not included in analyses | |
| Rossetti 1996 | 6 months | | | | Yes | Fluorescein angiography using Miyake 1977 classification | | Snellen acuity only, not included in analyses | |
| Singh 2012 | 90 days | | | Change from baseline | Yes | ">= 30% increase in central subfield macular thickness from baseline" | Flare mentioned but data not reported | Corrected BCVA loss of more than 5 letters from day 7 postop | |
| Solomon 1995 | 6 months | Days 21 to 60, MO = positive angiography and visual acuity <= 20/40 | | | Yes | Fluorescein angiography using classification*** | | Snellen acuity but not reported by treatment group | |
| Tauber 2006 | 30 days (3 months mentioned but not reported) | | | Reported but no mean/SD | | | | | Proportion with > 10% increase in retinal thickness |
| Ticly 2014 | 5 weeks | | | Final value | Yes | Fluorescein angiography using Miyake 1977 classification | | LogMAR | |
| Tunc 1999 | 2 months | | | | | Fluorescein angiography 0 no leakage (CME absent),1 oedema less than perifoveal, 2 mild perifoveal oedema, 3 moderate perifoveal oedema (approx. 1 disc diameter), 4 severe perifoveal oedema plus drop of 1 line of Snellen acuity since second postoperative week defined as "clinically significant" | | | |
| Tzelikis 2015 | 12 weeks | | | Final value | Yes | | | LogMAR, final value (at 30 days only) | |
| Umer‐Bloch 1983 | 12 weeks | | | | Yes | Fluorescein angiography using Miyake 1977 classification | | Snellen acuity only, not included in analyses | |
| Wang 2013 | 2 months | OCT‐confirmed CMO with "visual impairment" (not specified cutpoint) | | Final value | Yes | "CME was defined as central retinal
thickness > 250 μm and the presence of intraretinal cystoid space
beneath the foveal, with the diagnosis confirmed by the same retinal
specialist" | Mean photon count values | LogMAR, final value | |
| Wittpenn 2008 | 4 weeks | OCT‐confirmed CMO with visual acuity < 6/9 | | | Yes | Clinical and OCT‐based | | | |
| Yannuzzi 1981 | 1 year | CMO on fluorescein angiography with visual acuity < 6/60 | | | Yes | Fluorescein angiography, evidence but not defined | | | |
| Yavas 2007 | 3 months | | | | | "Slight fluorescein leakage
into the cystic space without enclosing the entire central
fovea or complete fluorescein accumulation in the cystic
space was diagnosed as angiographic CME" | | LogMAR, final value | |
| Yung 2007 | 12 weeks | | | | | | | | |
| Zaczek 2014 | 6 weeks | | | | Yes | OCT‐verified but not defined | Mean anterior chamber flare reported in figure but no SD | LogMAR, final value | Change in total macular volume |
| Zhang 2008 | 1 month | | | | | OCT‐verified but not defined | Tyn granule + | | |