Suplementos de hierro por vía oral para niños que viven en zonas de paludismo endémico
Resumen
Antecedentes
La anemia ferropénica es frecuente durante la infancia. Se ha afirmado que la administración de hierro aumenta el riesgo de paludismo.
Objetivos
Evaluar los efectos y la seguridad de la administración de suplementos de hierro, con o sin ácido fólico, a niños que viven en zonas de transmisión hiperendémica u holoendémica del paludismo.
Métodos de búsqueda
Se realizaron búsquedas en el Registro Especializado del Grupo Cochrane de Enfermedades Infecciosas (Cochrane Infectious Diseases Group); en el Registro Cochrane Central de Ensayos Controlados (Cochrane Central Register of Controlled Trials, CENTRAL), publicado en la Cochrane Library, MEDLINE (hasta agosto de 2015) y LILACS (hasta febrero de 2015). También se revisó el metaRegister of Controlled Trials (mRCT) y la World Health Organization International Clinical Trials Registry Platform (WHO ICTRP) hasta febrero de 2015. Se estableció contacto con los investigadores principales de todos los ensayos incluidos, los estudios en curso o los que están en espera de evaluación, para solicitarles datos no publicados y ensayos adicionales. Se examinaron las referencias de los ensayos incluidos, las revisiones pertinentes y los metanálisis anteriores en busca de referencias adicionales.
Criterios de selección
Se incluyeron los ensayos controlados aleatorizados (ECA) individuales y ECA grupales realizados en regiones de paludismo hiperendémico y holoendémico o que informaron sobre cualquier resultado relacionado con el paludismo que incluyera niños menores de 18 años. Se incluyeron los ensayos que compararon el hierro administrado por vía oral, el hierro con ácido fólico y el hierro con tratamiento antipalúdico versus placebo o ningún tratamiento. Se incluyeron los ensayos sobre la administración de suplementos de hierro o intervenciones de fortificación si proporcionaron al menos el 80% de la ración dietética recomendada (RDA) para la prevención de la anemia por edad. Los antihelmínticos se podían administrar a cualquier grupo y los micronutrientes se debían administrar por igual a ambos grupos.
Obtención y análisis de los datos
Los resultados primarios fueron el paludismo clínico, el paludismo grave y la muerte por cualquier causa. El riesgo de sesgo en los ensayos incluidos se evaluó mediante la evaluación basada en dominios y la calidad de la evidencia se evaluó mediante el enfoque Grading of Recommendations Assessment, Development and Evaluation (GRADE). Se realizó un metanálisis de efectos fijos para todos los resultados y un metanálisis de efectos aleatorios para los resultados hematológicos, y se ajustaron los análisis para los ECA grupales. Los análisis de subgrupos se basaron en la anemia al inicio, la edad y los servicios de prevención o tratamiento del paludismo sobre los datos a nivel de ensayo.
Resultados principales
Treinta y cinco ensayos (31 955 niños) cumplieron los criterios de inclusión. En general, el hierro no causa un exceso de paludismo clínico (riesgo relativo [RR] 0,93; intervalos de confianza [IC] del 95%: 0,87 a 1,00; 14 ensayos, 7168 niños, evidencia de calidad alta). Es probable que el hierro no cause un exceso de paludismo clínico en las poblaciones en las que la anemia es frecuente y en las que no lo es. En las zonas donde existen servicios de prevención y tratamiento del paludismo, el hierro (con o sin ácido fólico) puede reducir el paludismo clínico (RR 0,91; IC del 95%: 0,84 a 0,97; siete ensayos, 5586 participantes, evidencia de calidad baja), mientras que en las zonas donde no se dispone de dichos servicios, el hierro (con o sin ácido fólico) puede aumentar la incidencia del paludismo, aunque los IC inferiores no indican diferencias (RR 1,16; IC del 95%: 1,02 a 1,31; nueve ensayos, 19 086 participantes, evidencia de calidad baja). La administración de suplementos de hierro no causa un exceso de paludismo grave (RR 0,90; IC del 95%: 0,81 a 0,98; seis ensayos, 3421 niños, evidencia de calidad alta). No se observaron diferencias en cuanto a las muertes (tasa de eventos control del 1%, evidencia de calidad baja). El tratamiento con hierro y antipalúdicos redujo el paludismo clínico (RR 0,54; IC del 95%: 0,43 a 0,67; tres ensayos, 728 niños, evidencia de calidad alta). En general, el hierro dio lugar a menos niños con anemia en el seguimiento, y el cambio promedio final en la hemoglobina a partir del inicio fue mayor con el hierro.
Conclusiones de los autores
El tratamiento con hierro no aumenta el riesgo de paludismo clínico cuando se proporcionan servicios regulares de prevención o tratamiento del paludismo. Cuando los recursos son limitados, se puede administrar hierro sin necesidad de realizar cribado de la anemia o la deficiencia de hierro, siempre que se proporcionen con eficiencia los servicios de prevención o tratamiento del paludismo.
PICO
Resumen en términos sencillos
Suplementos de hierro para niños que viven en países con paludismo endémico
Por qué es importante la revisión
Los niños que viven en zonas de paludismo suelen desarrollar anemia. Se cree que la anemia a largo plazo retrasa el desarrollo del niño y hace que los niños sean más propensos a contraer infecciones. En las zonas donde la anemia es frecuente, los profesionales sanitarios pueden administrar hierro para prevenir la anemia, pero existe la preocupación entre los investigadores de que esto pueda aumentar el riesgo de paludismo. Se cree que las tabletas de hierro aumentarán los niveles de hierro en sangre, y esto promoverá el crecimiento del parásito Plasmodium que causa el paludismo. El objetivo fue evaluar los efectos de la administración de suplementos de hierro por vía oral a niños que viven en países donde el paludismo es común.
Principales resultados de la revisión
Los investigadores de Cochrane buscaron la evidencia disponible hasta el 30 de agosto de 2015 e incluyeron 35 ensayos (31 955 niños). El hierro no aumentó el riesgo de paludismo, indicado por la fiebre y la presencia de parásitos en la sangre (evidencia de calidad alta). No hubo un mayor riesgo de muerte entre los niños tratados con hierro, aunque la calidad de la evidencia al respecto fue baja. Entre los niños tratados con hierro, no hubo un aumento en el riesgo de paludismo grave (evidencia de calidad alta). Aunque se tiene la hipótesis de que la administración de suplementos de hierro podría perjudicar a los niños que no presentan anemia y que viven en zonas de paludismo, es probable que no aumente el riesgo de paludismo en esos niños (evidencia de calidadmoderada). En las zonas donde los servicios sanitarios son suficientes para ayudar a prevenir y tratar el paludismo, la administración de suplementos de hierro (con o sin ácido fólico) puede reducir el paludismo clínico. En las zonas en que no se dispone de estos servicios, la administración de suplementos de hierro (con o sin ácido fólico) puede aumentar el número de niños con paludismo clínico (evidencia de calidad baja). En general, el hierro dio lugar a menos niños con anemia en el seguimiento, y el cambio promedio final en la hemoglobina a partir del inicio fue mayor con el hierro.
Conclusiones
Las conclusiones son que la administración de suplementos de hierro no afecta negativamente a los niños que viven en zonas de paludismo endémico. Sobre la base de esta revisión, no se debe privar de la administración sistemática de suplementos de hierro a los niños que viven en países en los que el paludismo es prevalente y se dispone de servicios de tratamiento del paludismo.
Authors' conclusions
Summary of findings
| Does iron supplementation or fortification increase malaria and related morbidity and mortality among children in malaria‐endemic areas? | ||||||
| Participant or population: children in malaria‐endemic areas | ||||||
| Subgroup | Anticipated absolute effects* (95% CI) | Relative effect results | Number of participants | Quality of the evidence | Comments | |
| Risk with placebo or no treatment | Risk with iron supplementation | |||||
| Clinical malaria | 27/100 | 25/100 (23 to 27) | RR 0.93 (0.87 to 1.00) | 7168 (14 RCTs) | ⊕⊕⊕⊕ High1 | Overall, among anaemic or non‐anaemic children, iron does not cause an excess of clinical malaria |
| Clinical malaria Subgrouped by population anaemia (trial level) | Anaemic at baseline | RR 0.92 | 7168 (14 RCTs) | ⊕⊕⊕⊝ | In populations where anaemia is common, iron probably does not cause an excess of clinical malaria | |
| 256 per 1000 | 236 per 1000 | |||||
| Not anaemic at baseline | RR 0.97 | 2112 | ⊕⊕⊕⊝ | In populations where anaemia is uncommon, iron probably does not cause an excess of clinical malaria | ||
| 326 per 1000 | 316 per 1000 | |||||
| Severe malaria Defined as clinical malaria with high‐grade parasitaemia or requiring admission | 397 per 1000 | 357 per 1000 | RR 0.90 | 3421 | ⊕⊕⊕⊕ | Iron supplementation does not cause an excess of severe malaria |
| Death | 10 per 10000 | 10 per 1000 (10 to 10) | Not estimated | 7576 (18 RCTs) | ⊕⊕⊝⊝ Low4 | Iron may have no effect on mortality |
| Hospitalization plus clinic visits | 295 per 1000 | 295 per 1000 | RR 0.99 | 12,578 | ⊕⊝⊝⊝ | It is uncertain whether iron affects hospitalizations or clinic visits |
| *The risk in the intervention group (and its 95% CI) is based on the assumed risk in the comparison group and the relative effect of the intervention (and its 95% CI). | ||||||
| GRADE Working Group grades of evidence | ||||||
| 1Funnel plot asymmetry favouring the control arm, publication bias not suspected. The CIs range from important benefits of iron supplementation in reducing clinical malaria to no excess of clinical malaria. | ||||||
| Does iron with or without folic acid increase malaria among children in malaria‐endemic areas? | ||||||
| Participant or population: children in malaria‐endemic areas | ||||||
| Subgroup | Anticipated absolute effects* (95% CI) | Relative effect results | Number of participants | Quality of the evidence | Comments | |
| Risk with placebo or no treatment | Risk with iron supplementation | |||||
| Clinical malaria Subgrouped by presence of malaria prevention or management services | Malaria prevention or management services present | RR 0.91 (0.84 to 0.97) | 5586 | ⊕⊕⊝⊝ | In areas where there are prevention and management services for malaria, iron supplementation may reduce clinical malaria | |
| 24 per 100 | 22 per 1000 | |||||
| Malaria prevention or management services not present | RR 1.16 | 19,086 | ⊕⊕⊝⊝ | In areas where there are no prevention and management services for malaria, iron may increase the number of children with clinical malaria | ||
| 6 per 100 | 7 per 1000 | |||||
| *The risk in the intervention group (and its 95% CI) is based on the assumed risk in the comparison group and the relative effect of the intervention (and its 95% CI). | ||||||
| GRADE Working Group grades of evidence | ||||||
| 1Downgraded by 1 for inconsistency and 1 for funnel plot asymmetry and suspected publication bias. | ||||||
| Is iron supplementation with antimalarial treatment safe and beneficial for children living in malaria‐endemic areas? | ||||||
| Participant or population: children with or without anaemia at baseline | ||||||
| Outcomes | Illustrative comparative risks* (95% CI) | Relative effect | No of participants | Quality of the evidence | Comments | |
| Assumed risk | Corresponding risk | |||||
| Control | Iron supplementation plus antimalarial | |||||
| Clinical malaria | 41 per 100 | 22 per 100 | RR 0.54 | 728 | ⊕⊕⊕⊕ | Iron given together with antimalarial antimicrobials reduce malaria |
| All‐cause mortality | 42 per 1000 | 44 per 1000 (23 to 85) | RR 1.05 | 728 (3 (RCTs) | ⊕⊕⊝⊝ | Iron given together with antimalarial antimicrobials may have no effect on mortality |
| *The basis for the assumed risk (for example, the median control group risk across studies) is provided in the footnotes. The corresponding risk (and its 95% CI) is based on the assumed risk in the comparison group and the relative effect of the intervention (and its 95% CI). | ||||||
| GRADE Working Group grades of evidence | ||||||
| 1All trials were individually randomized, with adequate concealment, double‐blinded, and no loss to follow‐up. | ||||||
Background
Description of the condition
Childhood anaemia and iron deficiency
Childhood anaemia is a major, widespread public health problem in sub‐Saharan Africa and other low‐income areas (WHO 2008a; Kassebaum 2014). The highest prevalence of anaemia is found among children younger than five years of age who are living in low‐income countries (Kassebaum 2014). Causes of anaemia in developing countries are numerous and often multifactorial, and include iron deficiency, infectious diseases (such as malaria, intestinal helminths, and schistosomiasis), haemoglobinopathies, and chronic kidney disease (WHO 2011a; Kassebaum 2014).
Iron is an important mineral needed to produce haemoglobin. It is also a component of many enzymes that are essential for proper cell development and cell growth of the brain, muscle, and the immune system (Beard 2001). It is a component of the peroxidase and nitrous oxide‐generating enzymes that participate in the immune response to infections and is probably involved in regulating the production and action of cytokines (mediators of immune function released during early stages of infection). Since free iron is toxic to cells, it is stored as ferritin, an intracellular protein.
A relatively large amount of iron is required to produce red blood cells (erythropoiesis) in the first few months after birth. This is usually derived from the iron stored by the foetus in the last months of pregnancy. However, by the time a child is four to six months old, these stores become marginal or depleted. A child whose diet does not provide enough iron risks development of iron‐deficiency anaemia. Infants with low total body iron at birth are particularly prone to iron deficiency; this is often exacerbated by the early introduction of cereal‐based weaning food from which iron absorption can be as low as 5% (FAO/WHO 2005). Iron deficiency may be worsened by chronic blood loss from the intestines that results from intestinal parasitic infections (Stoltzfus 1997).
Iron deficiency is common and affects approximately two billion people worldwide, which results in over 500 million cases of anaemia (WHO 2004). In most areas, and specifically in all low‐ and middle‐income regions, the most significant contributor to the onset of anaemia is iron deficiency (WHO 2008a; Kassebaum 2014). In sub‐Saharan Africa, the prevalence of iron‐deficiency anaemia is estimated to be around 60% overall (WHO 2004), with 40% to 50% of all children under five years in developing countries being iron‐deficient (UNICEF 1998).
Based on estimates of iron‐deficiency anaemia as a risk factor for death, iron deficiency has been estimated to cause 726,000 deaths in the perinatal and childhood periods globally, with the greatest toll in Southeast Asia and in Africa (WHO 2004; FAO/WHO 2005). Experimental and observational studies have linked iron deficiency to adverse effects on child development, including impairments of cognitive, emotional, and motor development (Pollitt 1993; Grantham‐McGregor 2001; Gewa 2009), growth (Lawless 1994), immune function, and increased risk of infection (Berger 2000; Beard 2001). The relative risk for mental retardation associated with a 1 g/dL increase in population mean haemoglobin level has been estimated at 0.78 (95% confidence interval (CI) 0.70 to 0.86) (WHO 2004). However, these studies have been criticized for their inability to fully adjust for confounders and to establish causality (Oppenheimer 2001). Systematic reviews of randomized controlled trials (RCTs) on iron supplementation's effect on mental development, intelligence scores, motor development, and growth reported conflicting results (Bhandari 2001; Ramakrishnan 2004; Sachdev 2005; Iannotti 2006; Sachdev 2006; Low 2013; Thompson 2013; Wang 2013). Notably the time frame of many RCTs may not have allowed for a full evaluation of developmental outcomes.
The diagnosis of iron deficiency and iron deficiency anaemia relies mainly on the measurement of a person's haemoglobin, iron, and ferritin (Pasricha 2013). The measurement of haemoglobin alone is not sufficiently sensitive (due to overlapping values in iron‐replete and iron‐deficient individuals) and is not specific because of the numerous causes of anaemia in developing countries. Ferritin is the most commonly accepted measure of iron status (Mei 2005). However, there is a complex interaction between infection, inflammation (even when subclinical), and ferritin. Infection and inflammation increase ferritin, which is an acute phase reactant. The increase is proportional to the baseline ferritin levels and available iron stores (Thurnham 2010). It decreases only slowly after the resolution of infection and remains elevated in the convalescent phases of infection. Thus, in developing countries it is difficult to interpret ferritin levels and their use as a biomarker of iron deficiency may underestimate the true prevalence of iron deficiency (Nyakeriga 2004; Zimmermann 2005). Other biomarkers or combinations of biomarkers have been suggested for the assessment of iron deficiency in locations with a high prevalence of infection. These include the serum transferrin receptor, zinc protoporphyrin, transferrin saturation, and the ratio of serum transferrin receptor to serum ferritin (Lynch 2011), as well as the adjustment of ferritin to C‐reactive protein or alpha1‐acid glycoprotein levels, or both (Mburu 2008; Thurnham 2010). The World Health Organization (WHO) and the Centers for Disease Control and Prevention (CDC) recommend the use of concurrent measurements of haemoglobin, ferritin, and transferrin receptor to assess the iron status of a group (WHO/CDC 2004; WHO 2011b). The concurrent measurement of the inflammatory markers C‐reactive protein and alpha1‐acid glycoprotein facilitates the interpretation of ferritin levels. However, the exclusion of children with elevated markers of inflammation from iron deficiency assessment is not reasonable, since up to 69% of children in malaria‐endemic areas may have elevated markers of inflammation (Darboe 2007).
Malaria and iron deficiency
Malaria is a leading cause of morbidity and mortality in children in sub‐Saharan Africa (Breman 2001; WHO 2008b). Most infections are caused by the most virulent parasite species, Plasmodium falciparum (WHO 2008b), which is transmitted to humans by the bite of an infected female Anopheles mosquito. Trends and general patterns of malaria transmission vary greatly geographically. Children are vulnerable to malaria from the age of approximately three months, when immunity acquired from the mother wanes. Malaria is an important contributor to anaemia in endemic regions through the destruction of parasitized red blood cells (haemolysis), increased clearance of infected and uninfected red blood cells by the spleen, cytokine‐induced dyserythropoiesis (abnormal production of red blood cells), and probably also decreased absorption of dietary iron (Menendez 2000; Ekvall 2003; Glinz 2015).
There is an ongoing debate on whether iron deficiency offers protection from malaria and whether an excess of iron increases the risk of malaria or severe malaria (Oppenheimer 2001; Stoltzfus 2010; Suchdev 2010; Oppenheimer 2012). Iron is required by many pathogens for their survival and pathogenicity (killing ability) (Beard 2001). Removal of free circulating iron seems to be an important part of the host (human) response to infection. The theory that iron deficiency may be an important defence mechanism has been termed "nutritional immunity" (Kochan 1973). The erythrocytic form of the Plasmodium parasite requires free iron (which is lacking in an iron‐deficient person). In one observational study iron deficiency was associated with a small, albeit significant, degree of protection from episodes of clinical malaria in a cohort of young children living on the Kenyan coast (Nyakeriga 2004).
Description of the intervention
In areas where the prevalence of anaemia is 40% or more in young children, guidelines generally recommend that children of normal birthweight receive oral iron (2 mg/kg/day of elemental iron, daily, for three months) between the ages of six months and two years, and that children with a low birthweight receive the same amount of iron starting at two months (Stoltzfus 1998; INACG 1999).
Several meta‐analyses have previously examined the benefits and risks of iron supplementation in children (INACG 1999; Oppenheimer 2001; Gera 2002; Iannotti 2006; Gera 2007). These have shown that iron treatment increases haemoglobin and prevents anaemia. The absolute effects on haemoglobin were larger among children who were anaemic at baseline and smaller in malarial hyperendemic regions compared with non‐endemic regions, and with iron‐fortified food compared with oral medicinal iron (Gera 2007). An increased risk of malaria has been highlighted by several meta‐analyses. Most studies reported parasitaemia (being slide‐positive for P. falciparum at the end of supplementation) rather than clinical malaria (INACG 1999; Oppenheimer 2001; Gera 2002; Iannotti 2006). The effects on parasitaemia were associated with baseline rates of parasitaemia (Gera 2002). In Gera 2002 other infections were also assessed. Overall there was no difference in the incidence rate ratio for all recorded infections. Diarrhoea was more frequent in the iron‐supplemented group.
Why it is important to do this review
In 2006, the results of a large RCT that evaluated the effect of iron and folate supplements in a malaria‐endemic area of Zanzibar (Pemba Island) were published (Sazawal 2006 (C)a). The study was terminated prematurely on the recommendation of the study data safety and management board following the higher proportion of hospitalization or death among participants randomized to treatment with iron and folic acid. A subgroup analysis revealed that the risk was limited to children who were iron‐replete when iron supplementation was started. This trial heightened global concern about the routine, non‐selective iron supplementation policy in areas where malaria is highly prevalent. Before this trial, the WHO guidelines for children living in malaria‐endemic areas were no different than the general recommendations (WHO 2003). In 2007 a consultation convened to consider the recommendations for children living in malaria‐endemic areas (WHO 2007). The trial's subgroup analysis suggested that it might be necessary to screen for iron deficiency and treat only iron‐deficient children. However, such a recommendation is difficult or impossible to implement. There is no consensus on the most appropriate biomarker to assess iron deficiency or monitor iron status during supplementation in regions with a high prevalence of infection (Mburu 2008; Thurnham 2010; Lynch 2011; Pasricha 2013). Furthermore, as a public health intervention, screening of all children before iron supplementation is impractical in most malaria‐endemic areas. Thus, it has become critical to examine the safety and effects of iron supplementation in malaria‐endemic areas considering all the available evidence. In 2013 another large RCT that evaluated the effect of iron added to micronutrient powder was conducted in Ghana. Insecticide‐treated bed nets were provided to all participants and antimalarial treatment was systematically administered when indicated (Zlotkin 2013 (C)). The use of iron in this trial did not result in an increased incidence of malaria among participants.
In view of the newly available data we set to examine the complete evidence in all RCTs that assessed iron supplementation for children in malaria‐endemic areas. In a previous version of the review, we did not observe an increased risk of malaria with iron supplementation overall nor was iron harmful in the treatment of malaria (Ojukwu 2007; Ojukwu 2009; Okebe 2011). Since any theoretical harm of iron administration would be expected to occur in the setting of intense malaria transmission, in the current review version we limited our analysis to areas with hyperendemic or holoendemic transmission of malaria or to trials conducted in other areas, but reported malaria‐related outcomes. We specifically searched for outcomes related to malaria and data for all‐cause mortality, which ultimately combines benefit and harm. Due to the conflicting results of the studies conducted in Pemba Island, Sazawal 2006 (C)a, and in Ghana, Zlotkin 2013 (C), we compared the effect of iron administration on the incidence of clinical malaria in studies in which prevention or management of malaria were offered as an integral part of the study design, with studies in which neither malaria prevention nor malaria management were systematically administered.
Objectives
To evaluate the effects and safety of iron supplementation, with or without folic acid, in children living in areas with hyperendemic or holoendemic malaria transmission.
Methods
Criteria for considering studies for this review
Types of studies
Randomized controlled trials (RCTs) that randomized individuals or clusters, and were conducted in countries defined as hyperendemic or holoendemic for malaria (Hay 2004; Table 1) or reported on any malaria‐related outcome. We excluded studies if the publication specifically stated, or we obtained information from the study authors, that the study was conducted in an area or period without malaria activity. We considered cluster RCTs eligible only if they included at least two units per trial arm. We excluded trials conducted in hypoendemic and mesoendemic areas, unless they reported malaria‐reported outcomes. In addition, we excluded studies that did not report at least one of the review‐defined primary or secondary outcomes.
| Area definition | Parasite rates | Description | Geographical location |
| Hypoendemicity (also called designated unstable malaria) | 10% or fewer children aged 2 to 9 years, but may be higher for part of the year | Areas where there is little transmission and during the average year the effects upon the general population are unimportant | AFRO: Chad |
| Mesoendemicity (also called unstable and stable malaria) | 11 to 50% of children aged 2 to 9 years | Typically found among rural communities in subtropical zones where wide geographical variations in transmission exist | AFRO: Angola, Botswana, Cape Verde, Chad, Eritrea, Ethiopia, Kenya (considered hyper‐ or holoendemic in review, as indicated in most of the trials), Mauritania, Namibia, Niger, Zambia, Zimbabwe |
| Hyperendemicity (also called stable malaria) | Consistently > 50% among children aged 2 to 9 years | Areas where transmission is intense but seasonal; immunity is insufficient in all age groups | AFRO: Angola, Benin, Burkina Faso, Cameroon, Central African Republic, Chad, Congo, Côte d'Ivoire, Equatorial Guinea, Gabon, Gambia, Ghana, Guinea, Guinea‐Bissau, Liberia, Madagascar, Malawi, Mali, Mozambique, Nigeria, Sao Tome and Principe, Senegal, Sierra Leone, Togo, Uganda,Tanzania, Zambia |
| Holoendemicity (also called stable malaria) | Consistently > 75% among infants aged 0 to 11 months | Intense transmission resulting in a considerable degree of immunity after early childhood | AFRO: Central African Republic, Democratic Republic of Congo, Tanzania, Uganda, Burundi, Madagascar, Malawi, Mozambique |
Abbreviations: AFRO: WHO African Regional Office; AMRO: WHO Americas Regional Office; EMRO: WHO Eastern Mediterranean Regional Office; EURO: WHO Europe Regional Office; SEARO: WHO South East Asian Regional Office; WPRO: WHO Western Pacific Regional Office.
Types of participants
Children (less than 18 years of age), with or without anaemia, and with or without malaria or parasitaemia at baseline. We excluded pregnant women.
Types of interventions
Intervention
-
Iron.
-
Iron plus folic acid.
-
Iron plus antimalarial treatment.
Control
-
Placebo.
-
No treatment.
-
Antimalarial (only when the intervention is iron plus antimalarial).
We only included trials that allocated antiparasitics or other micronutrients (for example, zinc, vitamin A, vitamin C) if both trial arms received the same dose and schedule. Iron could be administered orally in any form of tablet, elixir, supplementation, or fortification (including fortification of food, drink, sprinkles, or other modes of iron administration as long as it provided at least 80% of the Recommended Dietary Allowance (RDA) recommended by the World Health Organization (WHO) for prevention of anaemia by age (Table 2; Stoltzfus 1998). Eighty per cent of the RDA would approximate the Estimated Average Requirement (EAR), which is the daily intake value of a nutrient that is estimated to meet the nutrient requirement of half the healthy population, by age (Institute of Medicine 1998). Iron could be administered for any duration or interval of administration.
| Age group | Minimal daily dose |
| < 6 months | 2 mg/kg |
| 6 to 24 months | 12.5 mg or 2 mg/kg |
| 2 to 5 years | 20 mg |
| 6 to 11 years | 30 mg |
| 11 to 18 years | 60 mg |
Abbreviations: WHO: World Health Organization; RDA: recommended dietary allowance.
We constructed the following comparisons:
-
Iron versus placebo or no treatment.
-
Iron plus folic acid versus placebo or no treatment.
-
Iron either with or without folic acid versus placebo or no treatment
Types of outcome measures
Primary outcomes
-
Clinical malaria: uncomplicated malaria, defined as a history of fever with parasitological confirmation (WHO 2010). We included cases of severe malaria if they were not reported separately.
-
Severe malaria: cerebral malaria or acute Plasmodium falciparum malaria with signs of severity, or evidence of vital organ dysfunction, or both (WHO 2010). If it had been defined differently, we extracted the outcome as reported in the trial and used the trial authors' definitions.
-
Death from any cause.
Secondary outcomes
-
Malaria parasitaemia; any level of parasitaemia, and above a specific threshold as used in the study to define high‐grade parasitaemia.
-
Malaria parasite density, as reported in the included trial.
-
Hospitalizations for any cause.
-
Clinic visits.
-
Haemoglobin levels.
-
Prevalence of anaemia, as defined in the trial.
-
Infections other than malaria (including diarrhoea, pneumonia, sepsis, meningitis, measles, and pertussis), expressed as episodes per child‐month.
-
Weight, absolute values.
-
Height, absolute values.
We excluded studies that did not report at least one of the review‐defined primary or secondary outcomes.
Search methods for identification of studies
We attempted to identify all relevant trials regardless of language or publication status (published, unpublished, in press, and in progress).
Electronic searches
Databases
The Information Specialist of the Cochrane Infectious Diseases Group (CIDG) editorial base, Vittoria Lutje, searched the following databases and used the search terms and strategy described in Table 3: the CIDG Specialized Register; the Cochrane Central Register of Controlled Trials (CENTRAL), published in the Cochrane Library (February 2015); MEDLINE (1966 to August 2015); EMBASE (1980 to February 2015); and LILACS (1982 to February 2015). We also searched the metaRegister of Controlled Trials (mRCT) and World Health Organization International Clinical Trials Registry Platform (WHO ICTRP) using 'iron' and 'malaria' as search terms.
| Search set | CIDG SRa | CENTRAL | MEDLINEb | EMBASEb | LILACSb |
| 1 | iron | iron | iron | iron | iron |
| 2 | ferrous | ferrous | ferrous | FERROUS‐SULPHATE | ferrous |
| 3 | 1 or 2 | IRON COMPOUNDS | IRON COMPOUNDS | 1 or 2 | 1 or 2 |
| 4 | malaria | 1 or 2 or 3 | 1 or 2 or 3 | supplem$ | malaria |
| 5 | anaemia | supplem* | supplem* | 3 and 4 | anaemia |
| 6 | anaemia | 4 and 5 | 4 and 5 | malaria | anaemia |
| 7 | 4 or 5 or 6 | malaria | malaria | anaemia | 4 or 5 or 6 |
| 8 | 3 and 7 | anaemia | anaemia | 6 or 7 | 3 and 7 |
| 9 | — | anaemia | anaemia | 5 and 8 | — |
| 10 | — | 7 or 8 or 9 | 7 or 8 or 9 | child$ | — |
| 11 | — | 6 and 10 | 6 and 10 | infant$ | — |
| 12 | — | — | child* | 10 or 11 | — |
| 13 | — | — | infant* | 9 and 12 | — |
| 14 | — | — | 12 or 13 | — | — |
| 15 | — | — | 11 and 14 | — | — |
aCochrane Infectious Diseases Group Specialized Register.
bSearch terms used in combination with the search strategy for retrieving trials developed by The Cochrane Collaboration (Cochrane 2011).
Searching other resources
Researchers, organizations, and pharmaceutical companies
We contacted the primary investigators of all included trials, ongoing trials, and those awaiting assessment to ask for unpublished data and further trials.
Reference lists
We scanned the bibliographies of all included trials, pertinent reviews, and previous meta‐analyses for additional references.
Data collection and analysis
Selection of studies
Several review authors (Juliana Ojukwu, Dafna Yahav (DY), Joseph Okebe (JO), and Mical Paul (MP) for first version of this Cochrane review (Ojukwu 2009); Rana Shbita (RS), DY, JO, and MP for the second version (Okebe 2011); and Ami Neuberger (AN), JO, and MP for this review update) independently inspected the abstract of each identified reference and obtained the full text of relevant articles. Two review authors independently reviewed the articles and applied the inclusion criteria. If needed, we contacted the study authors to clarify study eligibility. We resolved any areas of disagreement by discussion with a third review author. Each trial was scrutinized to identify multiple publications from the same data set. We documented the justification for exclusion of studies from the review. We named studies by the first author and year of publication (with the addition of a, and b, for different studies from the same author and year of publication). The addition of (C) to the trial's identification denotes that the trial was cluster randomized.
Data extraction and management
Two review authors independently extracted data into a prepiloted data‐extraction spreadsheet which detailed relevant epidemiologic and clinical data. We resolved any differences in the data extracted by discussion. One review author entered data into Review Manager (RevMan) (RevMan 2014).
For individually RCTs, we recorded the number of participants that experienced the event and the number of participants analysed in each treatment group or the effect estimate reported (for example, risk ratio (RR)) for dichotomous outcome measures. For count data, we recorded the number of events and the number of child‐months of follow‐up in each group. Whenever a trial did not report the number of child‐months, we used the product of the duration of follow‐up and the number of children evaluated to estimate this figure. For continuous data, we extracted means (arithmetic or geometric) and a measure of variance (standard deviation (SD), standard error (SE), or confidence interval (CI)) and the numbers analysed in each group. We calculated haemoglobin values in g/dL by multiplying hematocrit or packed cell volume values by 0.34, when a trial did not report haemoglobin values.
In cluster RCTs, we recorded the unit of randomization (for example, household, compound, sector, or village), the number of clusters in the trial, and the average cluster size. We documented the statistical methods used to analyse the trial alongside details that described whether these methods adjusted for clustering or other covariates. We extracted estimates of the intracluster correlation coefficient (ICC) for each outcome whenever possible. Where results had been adjusted for clustering, we extracted the treatment effect estimate and the SD or CI. If we did not adjust the results for clustering, we extracted the data reported (see adjustment below).
Assessment of risk of bias in included studies
Two review authors independently assessed the risk of bias. For all included trials we assessed the following.
-
Generation of randomization sequence.
-
Allocation concealment.
-
Blinding: participants, investigators, or outcome assessors.
-
Incomplete outcome data: we recorded the number of participants randomized and number of participants evaluated per outcome.
-
Selective reporting bias.
-
Other biases: premature discontinuation or other biases.
We graded the generation of randomization sequence and allocation concealment as at either low, high, or unclear risk of bias, as recommended in the Cochrane Handbook for Systematic Reviews of Interventions (Higgins 2011).
For cluster RCTs we also assessed the following.
-
Recruitment bias.
-
Baseline imbalance.
-
Loss of clusters.
-
Incorrect analysis.
-
Comparability with individually RCTs.
Measures of treatment effect
For dichotomous data we calculated RRs and for continuous data absolute mean differences, with 95% CIs. We computed SDs from SEs or 95% CIs, and assumed a normal distribution of the values. We calculated risk difference for the outcome of all‐cause mortality to allow the inclusion of the large number of trials with no deaths in both trial arms in the analysis. For count data, we calculated the rate ratio and SE for each study. We replaced zero events by 0.5. When the original included trials reported covariate‐adjusted incidence rate ratios, we used these data with SEs. We analysed infectious episodes, hospitalizations, and clinic visits as count data, and reported rate ratios per child‐months. We calculated standardized mean differences for the outcomes of weight and height, since we combined absolute values with weight/height for age Z scores.
Unit of analysis issues
-
When cluster RCTs reported results as if they were individually randomized, we extracted the data reported in the trial and used estimated ICCs and design effects (DE) to adjust for clustering (Higgins 2011). When one or more of the cluster RCTs reported RRs adjusted for clustering, we computed cluster‐adjusted SEs for the other trials (unadjusted SE of the log RR [SE(lnRR)] * DE0.5 = adjusted SE(lnRR)). When none of the cluster RCTs provided cluster‐adjusted RRs, we adjusted the sample size for clustering. We divided by the estimated DE the number of events and number evaluated for dichotomous outcomes and the number evaluated for continuous outcomes, where DE = 1 + [(average cluster size ‐ 1) * ICC]. We have provided the derivation of the estimated ICCs and DEs in Appendix 1.
-
In several outcomes a child might have experienced more than one outcome event during the trial period. For all outcomes we extracted the number of children with at least one event, except for infectious episodes other than malaria, hospitalizations, and clinic visits where repeated episodes were counted.
-
Trials with several trial arms could be included more than once for different comparisons. We did not include a trial arm more than once in the same meta‐analysis. In trials with an even number of arms, we included the trial for each pair of arms, as relevant. For trials with an odd number of arms, we summed up arms with the same intervention, as relevant.
Dealing with missing data
We contacted the trial authors if the available data were unclear, missing, or reported in a format that was different from the one required.
We aimed to perform an intention‐to‐treat analysis, where the trial authors accounted for all randomized participants; otherwise we performed a complete case analysis.
Assessment of heterogeneity
We assessed heterogeneity in the included trials by visual examination of the forest plot to detect non‐overlapping CIs, using the Chi² test of heterogeneity (P < 0.1 indicating statistical significance) and the I² statistic of inconsistency (with a value > 50% denoting moderate levels of heterogeneity). When statistical heterogeneity was present, we investigated the reasons for it using subgroup analysis.
Assessment of reporting biases
We constructed a funnel plot to assess the effect of small trials on the main outcome (when we included more than 10 trials).
Data synthesis
We conducted analyses using RevMan (RevMan 2014). We included cluster RCTs in the main analysis after adjustment for clustering (see above). We performed the meta‐analysis using the Mantel Haenszel (M‐H) fixed‐effect model or the generic inverse variance method (when adjustment for clustering was performed by adjusting SEs). Regarding the outcomes of haemoglobin and anaemia, we used a random‐effects model where we expected a priori heterogeneity to be displayed due to different mean baseline haemoglobin values and definitions of anaemia in different studies.
We assessed the quality of the evidence using the Grading of Recommendations Assessment, Development and Evaluation (GRADE) approach and constructed 'Summary of findings' tables using GRADEpro Guideline Development Tool (GDT) (www.gradepro.org). We presented 'Summary of findings' tables for the primary outcomes and hospital admissions.
Subgroup analysis and investigation of heterogeneity
When we detected heterogeneity, we attempted the following subgroup analyses. We defined subgroups by trial (or trial arm) level and not at the level of individual participants, since most trials targeted the participant subgroup of interest as the main study (for example, trials were conducted on anaemic or non‐anaemic children, and recruited children within a narrow age range). Moreover, trials most commonly did not present all outcomes for children subgroups.
-
Anaemia at baseline (representing prevention versus treatment of anaemia): mean haemoglobin of children in trial at baseline below 10 g/dL or 10 g/dL and above. If the trial did not report mean haemoglobin we used the hematinic values reported or the local population's prevalence of anaemia to subgroup the trial.
-
Age groups: children under two years of age; children aged two to five years old; and children aged over five years old. We classified trials that recruited children whose ages spanned more than one subgroup into the age group of most children.
-
Malaria management strategy: trials in which at least one of the following were reported as being in place. This was in comparison to other trials where such infrastructure was not available:
-
treated bed nets were supplied to all participants;
-
prophylactic antimalarials were administered to all trial groups;
-
standardized diagnosis of malaria among febrile children was performed;
-
standardized treatment offered to children diagnosed with malaria as an integral part of the study intervention.
-
We primarily stratified analyses by the presence of anaemia at baseline or malaria endemicity (selected by relevance to the outcome assessed), regardless of the presence or absence of heterogeneity to address clinically relevant populations. Similarly, for the outcomes related to malaria we assessed the effects of age. We performed comparisons between subgroups with RevMan (RevMan 2014).
Sensitivity analysis
We conducted sensitivity analyses by methods of allocation concealment to assess the effect of risk of bias on primary outcomes. We restricted the analysis of malaria‐related outcomes to P. falciparum. When we assessed all malaria species together, we included in this analysis trials where over 85% of malaria spp. diagnosed were P. falciparum. We excluded trials that counted multiple episodes of the outcome in individuals and trials whose outcome assessment occurred at a different point in time from that used in other included trials.
Results
Description of studies
Results of the search
After the filtration of publications that were irrelevant or clearly incompatible with the inclusion criteria, we initially considered in full 120 studies that were conducted in hyperendemic or holoendemic malaria areas or that reported on malaria. Of these we excluded 83 publications for the reasons we have detailed in the 'Characteristics of excluded studies' tables. Overall, we included 52 publications, which represent 35 individual RCTs. Eleven trials were multi‐armed, which led to 51 comparisons included in the review. We added five new trials in this current review update (Hop 2005; Giovannini 2006; Thi 2006; Esan 2013; Zlotkin 2013 (C)). We excluded 17 trials that assessed iron for the prevention or treatment of anaemia, which were included in the previous review version (Okebe 2011) from the current review update since they were conducted in hypoendemic or mesoendemic areas for malaria or provided an insufficient iron dose. Similarly, we excluded four trials that assessed iron as part of the treatment of malaria, as we dropped this analysis from the current version of this review.
Where the full publication did not provide enough information, we attempted to contact the authors of included and potentially relevant trials. We requested data primarily on malaria and all‐cause mortality. We established correspondence with 26 trial authors, of whom 21 supplied further information.
Included studies
We have provided a description of the included trials in the 'Characteristics of included studies' tables. The trials were published between the years 1973 and 2013. Overall the included trials recruited 31,955 children: 7953 in 26 individually RCTs and 24,002 (73%) in nine cluster RCTs. The largest cluster RCT included two separate, independent cohorts: the main trial, Sazawal 2006 (C)a, and an independent substudy, Sazawal 2006 (C)b. We only included two arms of this trial in the review (iron, folic acid, and vitamin A versus vitamin A alone), totaling 15,956 children in the main study and 1619 children in the substudy (analysed as separate trials in the review). We included unpublished data supplied by the trial authors on the outcomes of malaria and death from the substudy. Our attempts to obtain data on the two trial arms that compared iron and folic acid and vitamin A and zinc versus zinc and vitamin A (Sazawal 2007) at the time the iron trial arm had been stopped (August 2014) were unsuccessful. This analysis could have been a major contribution to the evidence. Twenty trials reported adherence, and the average overall adherence to all trial drugs was good (89%).
All trials assessed the administration of iron or iron plus folic acid for the prevention or treatment of anaemia among children without an acute illness. The mean iron supplementation dose was 2 mg/kg/day, and the mean duration of treatment was 4.5 months (one to 12 months). Twenty‐seven trials added the antimalarial treatment to the iron arm or both trial arms, 12 trials added anthelminthics to both trial arms, and eight trials added micronutrients to both trial arms. Twenty‐three trials reported one or more of the review‐defined malaria‐related outcomes (65.7% of trials included in the review. We have described the types of outcomes and their definitions in Table 4. Severe malaria, as defined per protocol, was reported in a single trial and its substudy that reported on cerebral malaria (Sazawal 2006 (C)a; Sazawal 2006 (C)b). Five trials reported clinical malaria with high‐grade parasitaemia (Smith 1989 (C); Adam 1997 (C); Massaga 2003; Ayoya 2009; Zlotkin 2013 (C)). Twelve trials reported only or mostly (over 80%) on P. falciparum malaria (Table 4). Most trials that reported malaria‐related outcomes performed regular surveillance for malaria using blood smears at baseline and during treatment (either at regular intervals or whenever children were febrile), and offered trial participants treatment when they were symptomatic (Table 4). Notably, no surveillance or treatment outside the hospital was offered in the main trial (Sazawal 2006 (C)a , unlike its substudy (Sazawal 2006 (C)b), where monitoring was performed and treatment was offered to children at their home. The baseline rate of malaria parasitaemia (reported in 11 of 19 trials) ranged from 0% to 70% of children (mean 45%). The mean baseline haemoglobin was lower than 10 g/dL in 17 trials (when iron was most commonly administered for the treatment of anaemia) and 10 g/dL or higher in 22 (when iron was administered for the prevention of anaemia). The trial population consisted of children aged less than two years of age in 12 trials, two to five years of age in 11 trials, and over five years of age in 16 trials. The respective number of trials that reported on malaria‐related outcomes in the three age groups were eight, nine, and six trials.
| Trial ID | Clinical definition | Laboratory definition | Malaria‐related outcomes reported | Time of assessment | Malaria prevention or management strategies | Malaria prevention or management |
| Physician's diagnosis of malaria | Any parasitaemia (all malaria species, assumed most Plasmodium falciparum since trial conducted in same region as Gebreselassie 1996) | Clinical malaria; any parasitaemia; malaria necessitating hospitalization (used as severe malaria); parasite density (all N events/N individuals, unadjusted for clustering) | 3 months to end of treatment | Blood smears for malaria obtained before, during and after treatment. Children with clinical malaria referred to local hospital and treated | No | |
| Fever > 37.5°C (axillary) | Any parasitaemia (P. falciparum) | Clinical malaria; clinical malaria with parasitaemia ≥ 5000/μL (used as severe malaria); parasite density | 3 months to end of treatment | Malaria screening was done at baseline for all children and repeated throughout the study in children who had fever. Children infected with P. falciparum also were treated with sulfadoxine‐pyrimethamine | Yes | |
| Isolated fever | Parasite density > 3000 (P. falciparum, Plasmodium malariae and Plasmodium ovale assessed. Over 97% were P. falciparum) | Parasite index (%, used as parasitaemia); parasitaemia above 3000 /µL (used as severe malaria) and 10,000 / µL (%); parasite density | 3 months to end of treatment 9 months to end of follow‐up (FU) | Blood smears for malaria obtained at baseline, end of treatment (3 months) and end of FU (6 months). Chloroquine treatment given for all isolated fevers | Yes | |
| Fever ≥37.5°C | Any parasitaemia (P. falciparum) with fever or parasitaemia > 5000/mm3 alone | Clinical malaria; any parasitaemia; hazard ratios for these; parasite density | 3 months to end of treatment | Blood smears at baseline and every 4 weeks. Oral quinine given for any fever with parasitaemia and cases of severe malaria referred for further treatment | Yes | |
| No clinical definition | Any parasitaemia | All cause sick visits (including malaria), | 3 months to end of treatment 6 months to end of FU | Routine trimethoprim ‐ sulfamethoxazole prophylaxis | Yes | |
| Not stated | Not stated | Participants with "malaria" (used primarily as clinical malaria) | 6 months to end of treatment | Not stated | No | |
| Fever ≥ 37.5°C with signs and symptoms suggestive of malaria and other diagnoses ruled out | Presence of parasites in blood (all species, P. falciparum 88.9%) | Children with at least one episode of clinical malaria; cumulative incidence of parasitaemia; parasite density > 5000 µL (used as severe malaria); parasite density | 3 months to end of treatment 6 months to end of FU | Blood smears negative at baseline and repeated weekly. Chloroquine with or without primaquine given for any positive smear | Yes | |
| Fever and headache at the same time | Any parasitaemia (P. falciparum 67%, P. vivax 26.4%, P. malariae 6.6%) | First episodes of clinically suspected malaria (used primarily as clinical malaria); any parasitaemia | 4 months to end of treatment 6 months to end of FU | Blood smears for malaria obtained at 0, 6, 16, and 24 weeks. Chloroquine given for any illness reported as fever or headache, or both | Yes | |
| Not assessed | Any positive smear (malaria species not stated) | Any positive smear; parasite density | 8 months to end of FU | Blood smears for malaria obtained at baseline and end of treatment. Treatment not stated | Yes | |
| Child's recall of clinical illness | Any positive blood smear (malaria species not stated) | Malaria is not defined (used as clinical malaria) | 3.5 months to end of treatment | No blood smears at baseline or during the trial (only at end of treatment). Treatment not stated | No | |
| Fever ≥ 37.5°C | Positive blood smear (malaria species not stated) | Episodes of clinical malaria and RRs adjusted for school; episodes of malaria parasitaemia and parasitaemia > 500 parasites/mm3 (used as severe malaria) and RRs adjusted for school, age, and baseline parasitaemia | 5 months to end of treatment | Blood smears for malaria at baseline (1/4 of participants positive) and monthly during the trial. No treatment offered for positive smears; symptomatic cases referred to physician | Yes | |
| History of fever in the previous 24 to 72 hours or measured temperature of ≥ 37.5°C | Any level of parasitaemia (P. falciparum only) | Clinical malaria as first or only episode per participant (used as clinical malaria) and episodes of clinical malaria; episodes of clinical malaria associated with parasitaemia > 5000 parasites/μL (used as severe malaria) | 6 months to end of treatment | Blood smears for malaria at baseline and every 2 weeks. Sulfadoxine‐pyrimethamine treatment given for uncomplicated cases; complicated and severe malaria referred to the hospital | Yes | |
| Not assessed | Any positive smear (P. falciparum only) | Parasitaemia as OR (95% CI) adjusted for repeated measurements in each child | 12 months to end of treatment | Blood smears for malaria at baseline and end of treatment. In addition, monthly smears from a random sample (50% of randomized). Treatment not stated | Yes | |
| Fever ≥ 37.5°C | Parasitaemia of any density (P. falciparum only) | First or only episode of clinical malaria | 1 year (6 months after end of treatment) | Blood smears for malaria at baseline, week 8 and for any fever. Chloroquine treatment given for clinical malaria | Yes | |
| Any fever within the previous 72 hours | P. falciparum (29%) or P. vivax (71%), any density | Episodes of falciparum or vivax malaria, or both (used primarily as clinical malaria) | 7 months to end of treatment | Blood smears for malaria at baseline and whenever febrile. Treatment given for all clinical cases | Yes | |
| Fever > 38°C and | Parasitaemia > 1000 or history of fever and parasitaemia > 3000 or parasitaemia > 10,000 parasites/mm3 regardless of fever (mostly P. falciparum) | Malaria‐related adverse events, defined as hospital admission or death due to malaria (used primarily as clinical malaria). RRs with 95% CI adjusted for multiple events per child and clustering; cerebral malaria (used as severe malaria) | Not fixed. End of treatment about 1 year and end of FU about 18 months | No baseline or routine surveillance for malaria during the trial. Treatment given only if admitted to the hospital and malaria diagnosed | No | |
| Fever > 38°C | Parasitaemia > 1000 or history of fever and parasitaemia > 3000 or parasitaemia > 10,000 parasites/mm3 regardless of fever (mostly P. falciparum) | Malaria‐related adverse events, defined as hospital admission or death due to malaria (used primarily as clinical malaria). RRs with 95% CI adjusted for multiple events per child and clustering; cerebral malaria (used as severe malaria) | Not fixed. End of treatment about 1 year and end of FU about 18 months | Blood smear for malaria at baseline, and at 6 and 12 months. Sulfadoxine‐pyrimethamine treatment delivered to home to all slide‐confirmed malaria participants or clinical disease presenting during the study | Yes | |
| Fever > 37.5°C | > 500 parasites/mm3 (mostly P. falciparum) | Visits for clinical malaria; parasitaemia > 500/µL; fever with parasitaemia > 5000 parasites/mm3 (used as severe malaria (all N events/N individuals, unadjusted for clustering) | 3 months to end of treatment | Blood smear for malaria at baseline, 2 weeks and end of treatment. No treatment at baseline; clinical malaria referred to local healthcare services | No | |
| Axillary temperature ≥ 37.5°C | Dipstick test for P. falciparum | Number of children with malaria infection (used primarily as clinical malaria) | 3 months to end of treatment | Dipstick for P. falciparum tested at baseline, 4, 8, and 12 weeks. Confirmed with blood smear if febrile and treated with sulfadoxine‐pyrimethamine, amodiaquine or halofantrine | Yes | |
| Axillary temperature ≥ 37.5°C | Parasitaemia of any density (mostly P. falciparum) | Incidence of clinical malaria, malaria with parasite density > 5000/µL, cerebral malaria | 5 months to end of treatment 6 months to end of FU | Insecticide‐treated bed nets supplied with instructions for use. Children with malaria treated with artemisinin combination therapy | Yes |
Time of assessment: refers to time from randomization.
Abbreviations: FU, follow‐up.
Excluded studies
We have detailed the specific reasons for exclusion in the 'Characteristics of excluded studies' tables. The major reasons for exclusion of studies were the following.
-
The trials were conducted in non‐malaria‐endemic, mesoendemic, or hypoendemic areas, including studies in which it was explicitly stated or the study authors confirmed that there was no malaria activity in the study location at the time of the trial.
-
The administration of iron fortification in a dose lower than at 80% of the Recommended Dietary Allowance (RDA) recommended by the World Health Organization (WHO) for prevention of anaemia by age (Types of interventions; Table 2).
-
The interventions were incompatible with the inclusion criteria, such as the administration of iron together with other micronutrients or the administration of iron to both trial arms.
-
Four trials assessed the intervention of iron during an acute attack of malaria (van Hensbroek 1995; Nwanyanwu 1996; van den Hombergh 1996; Gara 2010) among children under five years of age, all of whom were anaemic at baseline (haemoglobin range 4.1 to 9.6 g/dL).
Risk of bias in included studies
We have detailed the risk of bias in the included trials in the 'Risk of bias' tables and presented these assessments overall in Figure 1 and by study in Figure 2.

Methodological quality graph: review authors' judgements about each methodological quality item presented as percentages across all included trials. The unclear category for incomplete outcome data represents trials that did not report this outcome.

Methodological quality summary: review authors' judgements about each methodological quality item for each included trial.
Allocation
We judged 20 of the 35 trials (57.1%) as at low risk of bias related to allocation concealment. One trial was at a high risk of bias (Smith 1989 (C)). All the remaining trials either did not describe their methods clearly or did not provide a description of them. We judged the generation of randomization sequence to be at low risk of bias in 26/35 (74.3%) trials, at a high risk for bias in the one trial using alternation, and at unclear risk in all the others. Overall, we considered the allocation procedure (both allocation concealment and generation) as at low risk of bias in 18 (51.4%) trials.
Blinding
Twenty‐seven trials out of 35 trials (77.1%) described double‐blinding or stated that the trial was double‐blind, but gave no description of the blinding techniques; we considered all of these trials to be at low risk of bias (see the 'Risk of bias' tables). We considered six trials to be at high risk, and three trials at an unclear risk of bias.
Incomplete outcome data
The included trials explained the reasons for exclusion of participants from malaria‐related and haemoglobin outcome reporting and related it to an inability to obtain blood samples from the participants. The reasons for the exclusion of randomized children from mortality assessments were unclear and we considered this to be a serious risk for bias since deaths could have occurred among the excluded children. We have provided the details of the number of participants randomized and evaluated in the 'Risk of bias' tables.
Selective reporting
We did not have access to protocols to compare planned outcomes with those reported in the final publication.
One trial specified methods for assessment of malaria throughout the trial (without defining these as study outcomes), but did not report the results per trial arm (Olsen 2006). We could not contact the authors of this trial. We contacted authors of trials that did not report on malaria in their methods or result sections; the authors of one trial reported that data had been collected in the trial but were no longer available (Powers 1983), while the authors of seven trials replied that malaria‐related outcomes were not collected in their trials (Greisen 1986 (C); Latham 1990; Dossa 2001a; Dossa 2001b; Hall 2002 (C); Hess 2002; Zlotkin 2003). Thus, selective reporting bias is unlikely with regard to the outcomes related to malaria.
Only one trial defined death as an outcome (Sazawal 2006 (C)a; Sazawal 2006 (C)b), although 16 trials reported these results and we obtained these results from authors of another 14 trials. Thus, it is not possible to discuss reporting bias in relation to the outcome of mortality.
Cluster RCTs
Nine of the included RCTs were cluster randomized.
-
Recruitment bias: one trial randomized households. It was clear that children could be born and added to the cluster after randomization (Sazawal 2006 (C)a; Sazawal 2006 (C)b), one trial was at low risk of bias, and none of the other trials described clearly whether children could be recruited into the trial after the clusters had been randomized.
-
Basline imbalance: no differences in main baseline characteristics of different trial groups existed in any included trial.
-
Loss of clusters: none of the included trials provided data on the loss of clusters.
-
Incorrect analysis: only Sazawal 2006 (C)a, its substudy (Sazawal 2006 (C)b), and Zlotkin 2013 (C) adjusted the main outcomes for clustering. The other trials reported results per individual only and did not provide data regarding the ICC. We could usually calculate the average cluster size from the number of clusters and individuals included in the trial. We have provided the crude results reported in the publication, the DE used for adjustment, and the adjusted results used in the meta‐analyses for the main outcomes in Table 5 (for outcomes pooled with the use of adjusted SEs) and Table 6 (for outcomes pooled using effective sample size).
-
Comparability with individually RCTs: cluster RCTs were larger than individually RCTs (see above); the percentage of children excluded from outcome assessment was higher (10.2% versus 5.9% respectively), and adherence to study medications was lower (84.2% versus 91.3% respectively). The average dose of iron used was lower in cluster RCTs (1.6 versus 2.7 mg/kg/day), and the median treatment duration was longer (4.3 versus 3.3 months), both without statistical significance. Baseline haemoglobin levels were similar (10.5 versus 10.2 g/dL, but fewer children were defined as anaemic at baseline (median 55% versus 84.5%).
| Trial ID | Outcome | n Int reported | N Int reported | n Cont reported | N Cont reported | Average cluster size | DE | Unadjusted RR (95% CI) | ln(RR) | Unadjusted SE(lnRR) | Adjusted SE(lnRR)/ sample size |
| Clinical malaria | 72 | 366 | 49 | 372 | Household (used 1.5) | 1.34 | 1.49 (1.07 to 2.08) | 0.40 | 0.17 | 0.20 | |
| Parasitaemia | 127 | 368 | 101 | 372 | Household (used 1.5) | 1.34 | 1.27 (1.02 to 1.58) | 0.24 | 0.11 | 0.13 | |
| Clinical malaria necessitating hospitalization | 41 | 405 | 32 | 382 | Household (used 1.5) | 1.34 | 1.21 (0.78 to 1.88) | 0.19 | 0.22 | 0.26 | |
| Parasitaemia | — | 307 | — | 307 | 1.5 | 1.34 | OR 0.9 (0.72 to 1.19) Converted to RR 0.98 | 0.47 | 0.28 | 0.32 | |
| High‐grade parasitaemia | — | 307 | — | 307 | 1.5 | 1.34 | OR 1.04 (0.82 to 1.34) Converted to RR 1.03 | 0.03 | 0.12 | 0.14 | |
| Clinical malaria | 467 | 7950 | 411 | 8006 | 1.4 | — | 1.16 (1.00 to 1.34) | 0.15 | — | 0.07 | |
| Severe malaria (cerebral) | — | 7950 | — | 8006 | 1.4 | — | 1.32 (1.02 to 1.70) | 0.28 | — | 0.13 | |
| Clinical malaria | 14 | 815 | 30 | 804 | 1.2 | — | 0.46 (0.24 to 0.88) | ‐0.78 | — | 0.33 | |
| Severe malaria (cerebral) | 4 | 815 | 15 | 804 | 1.2 | — | 0.26 (0.09 to 0.81) | ‐1.35 | — | 0.56 | |
| Clinical malaria | 14 | 97 | 8 | 89 | Household (used 1.5) | 1.34 | 1.60 (0.42 to 0.71) | 0.47 | 0.42 | 0.48 | |
| Parasitaemia | 28 | 97 | 16 | 89 | Household (used 1.5) | 1.34 | 1.61 (0.93 to 2.76) | 0.47 | 0.28 | 0.32 | |
| High‐grade parasitaemia | 17 | 97 | 11 | 89 | Household (used 1.5) | 1.34 | 1.42 (0.70 to 2.86) | 0.35 | 0.13 | 0.15 | |
| Clinical malaria | 338 | 966 | 392 | 989 | Compounds | — | 0.87 (0.79 to 0.97) | ‐0.14 | — | 0.05 | |
| Clinical malaria with high grade parasitaemia | 273 | 966 | 308 | 989 | Compounds | — | 0.89 (0.80 to 1.00) | ‐0.12 | — | 0.06 |
Text in bold;results provided in publication or from authors adjusted for clustering.
Abbreviations: cont: control; DE: design effect used for adjustment (see methods for derivation of design effect and ICC used per outcome); Int: intervention; n: number of outcomes; N: number evaluated; OR: odds ratio; RR: risk ratio.
| Study ID | Outcome | n Int reported | N Int reported | n Cont reported | N Cont reported | Average cluster size | DE | n Int adjusted | N Int adjusted | n Cont adjusted | N Cont adjusted |
| Anaemia | 364 | 368 | 357 | 374 | Household (used 1.5) | 1.4 | 260 | 263 | 255 | 267 | |
| Anaemia | 273 | 551 | 356 | 562 | 20 | 2.77 | 99 | 199 | 129 | 203 | |
| All‐cause mortality | 0 | 340 | 2 | 344 | 1.5 | 1.001 | 0 | 340 | 2 | 344 | |
| Anaemia | 180 | 232 | 172 | 272 | 1.5 | 1.4 | 129 | 166 | 123 | 194 | |
| Anaemia | 133 | 224 | 110 | 203 | 30 | 3.70 | 36 | 61 | 30 | 55 | |
| All‐cause mortality | 149 | 7950 | 130 | 8006 | 1.4 | 1.001 | 149 | 7941 | 130 | 7996 | |
| All‐cause mortality | 8 | 815 | 9 | 804 | 1.2 | 1.0004 | 8 | 815 | 9 | 804 | |
| Anaemia | 4 | 308 | 7 | 327 | 1.2 | 1.4 | 3 | 220 | 5 | 234 | |
| All‐cause mortality | 3 | 967 | 2 | 991 | Compound | 1.001 | 3 | 966 | 2 | 990 |
None of the trials provided results adjusted for clustering for the outcomes reported in the table.
Abbreviations: cont: control; DE: design effect used for adjustment (see methods for derivation of design effect and ICC used per outcome); Int: intervention; n: number of outcomes; N: number evaluated.
Other potential sources of bias
One trial was discontinued prematurely on the recommendation of the data‐ and safety‐monitoring board, when it reached a predefined difference in mortality of P = 0.2 (Sazawal 2006 (C)a; Sazawal 2006 (C)b).
Effects of interventions
See: Summary of findings for the main comparison Oral iron versus placebo or no treatment for children in malaria‐endemic areas; Summary of findings 2 Effects of oral iron with or without folic acid on malaria among children in malaria‐endemic areas; Summary of findings 3 Oral iron with antimalarial prophylaxis versus placebo or no treatment for children in malaria‐endemic areas
1. Iron versus placebo/no treatment for the treatment or prevention of anaemia (31 trials, 12,963 children)
We included trials or trial arms that compared iron plus antimalarial versus antimalarial alone in this comparison. We did not separate the comparisons of iron versus placebo/no treatment and iron plus antimalarial versus antimalarial, unless there was significant heterogeneity in results explained by this factor. Four‐armed trials including both comparisons appear twice in the analyses (Menendez 1997; Verhoef 2002; Massaga 2003), once for the comparison of iron versus placebo/no treatment and once for the comparison of iron plus antimalarial versus antimalarial (each arm included different children).
Primary outcomes
Clinical and severe malaria
All trials defined clinical malaria as fever (usually greater than 37.5°C) and parasitaemia (any density). Overall, there was no significant difference in the risk ratio (RR) for clinical malaria between iron treatment and placebo or no treatment, with a trend in favour of iron treatment (RR 0.93, 95% CI 0.87 to 1.00; 14 trials, 7168 children). Specifically, there was no difference in the risk for clinical malaria between iron treatment versus placebo or no treatment in the subgroup of trials including non‐anaemic children (RR 0.97, 95% CI 0.86 to 1.09; five trials, 2112 children) without heterogeneity, Analysis 1.1). Significant heterogeneity was present in the subgroup analysis with anaemia (P = 0.01, I² statistic = 56%) and in the overall analysis. We rated the quality of the evidence as high for the overall analysis and moderate for the subgroups of anaemic and non‐anaemic children (summary of findings Table for the main comparison).
The RR of malaria was lower for children younger than two years of age (RR 0.89, 95% CI 0.82 to 0.97), and this result was largely driven by the recent study conducted in Ghana (Zlotkin 2013 (C)). In children aged between two and five years, and among children older than five years, we did not observe any effect of iron treatment on the relative risk of clinical malaria (Analysis 1.2).
The results favoured iron treatment when we only included trials that described malaria caused solely or primarily by P. falciparum (RR 0.91, 95% CI 0.84 to 0.99; nine trials, 5503 children, Analysis 1.3). Similarly, in six trials that reported malaria with high‐grade parasitaemia as an outcome, the RR was lower among children treated with iron when compared to children receiving placebo or no treatment (RR 0.90, 95% CI 0.81 to 0.98; Analysis 1.6) and we rated the quality of this evidence as high (summary of findings Table for the main comparison).
Ten of the 17 trials included in the analysis were at low risk of bias with respect to allocation concealment, and all but two of the trials were double blinded. Sensitivity analysis restricted to trials at low risk of bias for allocation concealment did not affect results. The funnel plot was asymmetrical, which indicated that small studies that favour iron could be missing (Figure 3). Three trials reported either on episodes of malaria (Richard 2006; Leenstra 2009) or clinic visits for malaria (Smith 1989 (C)) rather than participants with their first or only episode. The exclusion of these trials did not affect the pooled RR for this comparison. One trial reported on children with clinical malaria only at end of follow‐up, which was six months after completion of iron supplementation (Menendez 1997). Its exclusion did not affect the results.

Funnel plot of comparison: 1. Iron versus placebo or no treatment, outcome: 1.1 Clinical malaria (grouped by presence of anaemia).
Deaths
15/17 trials reported mortality, and in most trials no deaths occurred among the evaluable children (control event rate 1%). Overall, there was no difference between the iron and placebo/no treatment groups, without heterogeneity (Analysis 1.5). We assessed the quality of the evidence for this outcome as low due to imprecision (very low event rate) and incomplete outcome assessment in most of the trials (a drop‐out range of 2% to 62% of participants), as deaths might have occurred among the people lost to follow up (summary of findings Table for the main comparison).
Secondary outcomes
Parasite prevalence and density
There was no statistically significant difference in the prevalence of parasitaemia of any level, with a trend favouring placebo or no treatment (RR 1.11, 95% CI 1.0 to 1.23; nine trials, 3393 children, without significant heterogeneity;Analysis 1.4). We converted odds ratios to RRs to allow for the use of data on parasitaemia from one trial (Mebrahtu 2004 (C)). This outcome was not affected by age, anaemia at baseline, or Plasmodium species assessed (Analysis 1.4; Analysis 1.7; Analysis 1.8). Despite the lack of heterogeneity overall, there was a significant difference between trials that described adequate allocation concealment (RR 0.98, 95% CI 0.83 to 1.15, four trials, 1727 children, Analysis 1.9) and trials with unclear or inadequate methods that showed significantly higher rate of parasitaemia with iron treatment (RR 1.22, 95% CI 1.06 to 1.40, five trials, 1666 children; P = 0.04 for the difference between subgroups; Analysis 1.9). All of the trials included in the comparison of parasitaemia were double blinded. There was no statistically significant difference in the occurrence of high‐grade asymptomatic parasitaemia, most commonly defined as > 5000 parasites/μL (RR 1.13, 95% CI 0.93 to 1.37; five trials, 2565 children Analysis 1.10). In trials that continued follow‐up after the cessation of iron administration, there was a higher prevalence of any level of parasitaemia at the end of follow‐up among participants treated with iron (RR 1.23, 95% CI 1.09 to 1.40; five trials, 1150 children; Analysis 1.11).
It was difficult to establish whether the trials reported on children with parasitaemia or on parasitaemia episodes. Gebreselassie 1996 clearly reported on cumulative incidence and Leenstra 2009 included repeated episodes. Leenstra 2009 reported incidence rate ratios with 95% CIs adjusted for age, baseline parasitaemia, and school. We used these in our analysis as relative risks. The exclusion of these trials did not affect the results.
The trials reported parasite density differently, with differences that referred both to the unit of measurement and the denominator (Table 7). A meta‐analysis was therefore not possible; we have shown the results in Table 7 for each trial. Qualitatively, parasite density was higher in the iron supplemented group in four trials, lower in one, and similar in one of the six trials that reported on parasite density at the end of treatment.
| Trial ID | Intervention | Unit of measurement | Iron | Control | No. iron | No. control | Favours |
| For prevention or treatment of anaemia | |||||||
| Iron versus placebo | Geometric mean, parasites/μL | 15,059 | 8225 | 368 slides | 372 slides | Control | |
| Iron versus placebo | Geometric mean, parasites/μL ± SD | 2733 ± 1459 | 2648 ± 1562 | 105 children | 97 children | Control | |
| Iron versus placebo | Geometric mean, RBC/mm3 | 61.2 | 25.7 | 49 children with malarial index | 39 children with malarial index | Controlor similar | |
| Iron plus antimalaria versus antimalaria Iron versus placebo (with single‐dose antimalarial treatment) | Geometric mean, parasites/mm3 | 1705 2569 | 2485 3778 | 129 children 127 children | 127 children 108 children | Iron | |
| Iron versus placebo | Average parasite density class (parasite density classified in ascending order from 1 to 10) | 5.2 | 5.0 | 239 children | 241 children | Control or similar | |
| Iron versus placebo | Geometric mean, infected RBCs/100 WBC | 4.8 | 1.9 | 28 children | 26 children | Control | |
| Iron versus placebo | Geometric mean, parasites/μL (counting against 200 to 500 WBC, assuming 8000 WBC/μL | Age < 30 months 3402 Age > 30 months 2188 | Age < 30 months 3422 Age > 30 months 2046 | 273 children (225 households) | 265 children (225 households) | Similar | |
| For treatment of malaria | |||||||
| Iron daily plus antimalarial versus iron weekly plus antimalarial versus antimalarial | Mean, parasites/μL (counting against 300 WBC, assuming 6000 WBC/μL | 4927 (daily) 2207 (weekly) | 1812 | 77 (daily) 63 (weekly) children | 75 children | Control | |
| Iron plus antimalarial plus folic acid versus antimalarial plus folic acid | Geometric mean, parasites/μL | 5308 | 9302 | 48 children | 47 children | Iron (at baseline groups unbalanced favouring placebo) | |
Abbreviations: RBC: red blood cell; WBC: white blood cell.
Admissions to hospital and clinic visits
Six trials reported hospitalizations or clinic visits. Overall, there was no difference between iron and placebo or no treatment (Analysis 1.12); these results were not affected by the administration of antimalarial medications. We assessed the quality of the evidence as very low due to inconsistency and indirectness of this outcome ('Summary of findings' table 1).
Haemoglobin and anaemia
Analyses for haemoglobin were highly heterogeneous, since the absolute magnitude of treatment effect in trials differed, and the 95% CIs were narrow. However, the heterogeneity stemmed from different magnitudes of increase in haemoglobin with iron supplementation and not in the direction of the result. Overall, at the end of treatment there was a mean difference of haemoglobin level of 0.75 g/dL (95% CI 0.48 to 1.01; 16 trials, 5261 children; I² statistic = 93%; Analysis 1.13). In trials with anaemic children at baseline, the children gained 0.95 g/dL haemoglobin (95% CI 0.38 to 1.51; seven trials, 2481 participants) with iron supplementation, while in trials including mostly children without anaemia the end haemoglobin was higher than control by 0.61 g/dL (95% CI 0.38 to 0.85; nine trials, 2780 participants; P = 0.28 for subgroup difference). The mean change of haemoglobin from the baseline at end of treatment was 0.67 g/dL (95% CI 0.42 to 0.92; 12 trials, 2462 children; I² statistic = 82%; Analysis 1.19).
The RR for anaemia at the end of treatment, as defined in the trial, was 0.63 (95% CI 0.49 to 0.82; 15 trials, 3784 children; Analysis 1.15), with similar substantial heterogeneity mainly in the magnitude of benefit.
We did not observe any differences when we analysed the effect of iron on haemoglobin by age groups, or by the addition of antimalarial medications or multinutrients to both study arms (analyses not shown). Heterogeneity was maintained in all these subgroup analyses.
Other outcomes
Six studies provided data on respiratory infections. There was no difference between iron and placebo overall (rate ratio 0.99, 95% CI 0.85 to 1.15; six trials, 21,767 child‐months; I² statistic = 0%; Analysis 1.20). Trials usually reported diarrhoea as 'infectious diarrhoea', although we could not clearly differentiate the symptoms from diarrhoea related to iron or iron/zinc supplementation. We stratified this analysis by zinc co‐administration (Analysis 1.17). Overall, treatment was associated with an increased risk of diarrhoea (rate ratio 1.15, 95% CI 1.06 to 1.26; eight trials, 23,912 child‐months; I² statistic = 40%). This association was driven by the effect of the iron‐zinc combination (rate ratio 1.29, 95% CI 1.15 to 1.44; three trials, 6346 children), and not by iron treatment alone (rate ratio 0.99, 95% CI 0.87 to 1.13; seven trials, 17566 children). Six trials reported the number of febrile episodes; there was no difference between iron treatment and control arm (RR 1.03, 95% CI 0.93 to 1.14; 15531 children). One trial reported more days with fever among iron‐treated participants, and one trial reported more infectious episodes among participants randomized to the iron treatment arm. Definitions and reporting methods were highly variable; results are shown per outcome (Analysis 1.18).
Results for height and weight were inconsistently reported as end values or as the change from baseline and absolute values or z‐scores matched for age, height, or weight. The analyses shown are based on absolute weight in kg and height in cm at the end of treatment or weight/height for age z‐scores. For end of treatment weight, there was no statistically significant difference between iron and placebo/no treatment study arms (Analysis 1.14), while the change from baseline favoured iron (Analysis 1.16). The latter analysis was heterogenous and the heterogeneity was not explained by the review‐defined subgroups. There were no significant differences in end values or change from baseline of height, with similar heterogeneity in the change from baseline analysis (Analysis 1.21; Analysis 1.22).
2. Iron plus folic acid versus placebo for treatment or prevention of anaemia (6 trials, 19,456 children)
Primary outcomes
Clinical and severe malaria
The only trial that reported on malaria‐related outcomes was the Pemba study (Sazawal 2006 (C)a; Sazawal 2006 (C)b). Malaria‐related outcomes reported were admissions for malaria (Analysis 2.1) and cerebral malaria (Analysis 2.2). The results for the main study and the substudy were significantly different, and the main study showed a higher risk for severe malaria with iron plus folic acid and the substudy showed a lower risk. Therefore we did not pool the results. Children in the substudy were older than children in the main trial (mean age of 22.5 versus 18.3 months) and the baseline haemoglobin for the substudy cohort was probably higher than that of the main trial, because children with severe anaemia (haemoglobin < 7 g/dL) were excluded only from the substudy. However the main difference, as described by the trial authors, was that children in the substudy were monitored and offered treatment for malaria at home throughout the trial period. In the main trial, Sazawal 2006 (C)a, there was no organized infrastructure for the diagnosis and treatment of uncomplicated malaria.
Deaths
The pooled risk difference for mortality was 0.00 per 1000 children (95% CI −0.00 to 0.01; five trials, 18,034 children, Analysis 2.3), and Sazawal 2006 (C)a contributed 88.4% of the weight of this analysis.
Secondary outcomes
Hospital admissions were reported only in Sazawal 2006 (C)a (RR 1.08, 95% CI 0.96 to 1.22; 22,959 children). Haemoglobin at end of treatment was similarly reported in a single study, Giovannini 2006, and was higher with iron and folate, mean difference 0.90 g/dL (95% CI 0.51 to 1.29; 124 children Analysis 2.5). The RR for anaemia at end of treatment was 0.49 (0.25 to 0.99; three trials, 633 children, Analysis 2.6). No consistent data were reported for respiratory infections, other febrile episodes, and diarrhoea. There were no significant differences in the absolute end values of weight (Analysis 2.7) and height (Analysis 2.8).
We did not create any 'Summary of findings' tables for this comparison, as malaria‐related outcome were based on a single trial. The risk of bias for the trial was low, except for the fact that it was discontinued for harm (Sazawal 2006 (C)a; Sazawal 2006 (C)b).
3. Iron with or without folic acid versus placebo for treatment or prevention of anaemia (15 trials, 24,743 children for the outcome of malaria)
We analysed a single outcome for this comparison to enable the compilation of malaria in all trials that administered iron versus placebo or no treatment. We subgrouped the analysis by the presence of malaria prevention and management services in the trial setting and showed a significant lower risk of malaria with iron with or without folic acid when services were present (RR 0.91, 95% CI 0.84 to 0.97; seven trials, 5586 children), and a significantly higher risk of malaria when such services were absent (RR 1.16, 95% CI 1.02 to 1.31; nine trials, 19,086 children, analysis 3.1, P < 0.001 for subgroup difference). We assessed the quality of the evidence as low for both subgroups, due to inconsistency and suspected publication bias when malaria prevention and management services were present and indirectness in the analysis without malaria prevention and management services, as the latter was dominated was the Sazawal 2006 (C)a study that assessed only admissions due to malaria rather than all events of malaria ('Summary of findings' table 2).
4. Iron plus antimalarial versus placebo for treatment or prevention of anaemia (four trials, 1915 children)
Primary outcomes
Clinical malaria
Three trials reported on clinical malaria and all were individually RCTs. The trials uniformly showed that the intervention was protective for clinical malaria (pooled RR 0.54, 95% CI 0.43 to 0.67; three trials, 728 children, I² statistic = 0%; Analysis 4.1), high quality evidence ('Summary of findings' table 3). These trials did not assess severe malaria.
Deaths
There was no difference in the risk of death for the three trials combined (RR 1.05, 95% CI 0.52 to 2.11; three trials, 728 participants, Analysis 4.2). The quality of the evidence was low due to imprecision ('Summary of findings' table 3).
Secondary outcomes
Both the number of hospitalizations and the number of clinic visits were significantly reduced in two trials (Analysis 4.3). Iron plus antimalarial significantly improved haemoglobin in one trial and decreased the prevalence of anaemia in two trials (Analysis 4.4; Analysis 4.5). Respiratory infections, diarrhoea, and other infections were not reported in these studies.
The trials included in this comparison were four‐armed trials that assessed iron, placebo, iron with an antimalarial, and an antimalarial alone. The comparison of antimalarial treatment alone versus placebo showed identical results to the comparison of iron plus antimalarial versus placebo, except for the outcomes of haemoglobin/anaemia where the addition of iron conferred a higher benefit (analysis not shown). This observation strengthens the lack of effect of iron on malaria or other adverse outcome.
Discussion
Summary of main results
Oral iron supplementation alone did not increase the risk for clinical malaria, and the upper level of the 95% CI indicated no harm (risk ratio (RR) 0.93, 95% CI 0.87 to 1.00). The risk was probably not increased in trials that recruited children who were not anaemic at baseline (RR 0.97, 95% CI 0.86 to 1.09). There was no increased risk of P. falciparum malaria or malaria with high‐grade parasitaemia, and pooled results favoured iron treatment. The combination of iron and folate resulted in a higher rate of admissions for malaria and cerebral malaria in one large trial, Sazawal 2006 (C)a, but a substudy pointed at the opposite direction. The difference in malaria surveillance and management strategies in the two parts of this trial led to an analysis of all iron supplementation trials by malaria management infrastructure. Overall, iron treatment, with or without folate, was safe and may be protective in settings where malaria prevention or management programmes were implemented (RR 0.91, 95% CI 0.84 to 0.97). Conversley, it might be associated with an increased risk of clinical malaria when neither prevention nor antimalarial treatment were available (RR 1.16, 95% CI 1.02 to 1.31; P < 0.001 for the difference between subgroups). This finding agrees with the analysis of iron with an antimalarial drug as the intervention, which significantly decreased the occurrence of clinical malaria compared to placebo or no treatment. In all analyses, mortality was low in general and not different between iron‐treated participants, and those that received placebo or no treatment.
There were no effects of iron administration alone on infections, hospitalizations and clinic visits, and parasitaemia at the end of treatment. Iron treatment alone resulted in higher rates of parasitaemia at the end of follow‐up in trials with unclear allocation concealment methods. The combination of iron and antimalarial medication resulted in fewer clinic visits and hospitalizations, which probably reflected the effect of the antimalarial drug. The combination of zinc and iron was associated with more episodes of diarrhoea, while iron monotherapy was not. In all comparisons, iron supplementation increased haemoglobin and decreased anaemia. All analyses were highly heterogenous, which precluded a precise pooled estimate of effect, but the increase in haemoglobin was substantial in most individual trials and the prevalence of anaemia was reduced by 40% to 50% in most comparisons. We did not observe a clear beneficial or adverse effect of iron supplementation on weight or height.
In this current review update we applied more stringent inclusion criteria to focus on the question of iron's safety and beneficial effect in areas where these are doubtful. Firstly, since the debate that concerned iron administration centred around its effect in areas with significant burden of malaria, we chose to include only trials conducted in hyperendemic or holoendemic areas for malaria transmission, or trials that reported malaria outcomes. Secondly, we included trials of iron fortification and for all included trials we excluded trials that administered low‐dose iron that is not expected to result in iron repletion. Of the five trials that we added to the current review update, one large trial had a large impact on the pooled malaria outcome results (Zlotkin 2013 (C)). Thirdly, we omitted from this update an analysis of iron administration during proven malaria episodes. We included four trials in the 2011 version of this review, Okebe 2011, that assessed this intervention and no new trials have been published in recent years.
In the 2011 version of this review, Okebe 2011, we deemed that iron treatment not harmful regarding clinical malaria. In the current analysis, we found a trend towards a favourable effect of iron treatment on clinical malaria, with a statistically significant benefit in several subgroup analyses: children younger than two years of age, children infected primarily or exclusively by P. falciparum, and children included in trials in which malaria prevention or management strategies were implemented as an integral part of the trial's design. These results strengthen our conclusions from the previous versions of this Cochrane review (Ojukwu 2009; Okebe 2011); iron administration for the prevention or treatment of anaemia is safe in malaria‐endemic areas if malaria is adequately prevented, diagnosed, and treated.
Overall completeness and applicability of evidence
We have provided the results and the quality of evidence assessments in the 'Summary of findings' tables. There were several main reasons that led to downgrading of the evidence. We downgraded the quality of the evidence for imprecision whenever the 95% confidence intervals (CIs) showed possible harm with iron. Some of the important patient‐relevant outcomes assessed, including hospital admissions, clinical visits, and deaths, can obviously be triggered by causes other than malaria and the difference between arms is probably not only explained by malaria. Thus, we downgraded these outcomes for indirectness. For deaths, a serious concern of missing data with or without publication bias led to downgrading of the evidence; mortality data were reported in 26/39 of the trials included in the analyses and most of the trials that reported on mortality referred only to children available for analysis at the end of treatment or follow‐up. Deaths should be assessed among all children randomized, mainly those lost to follow‐up. Inconsistency was apparent in the outcome definitions, mainly with the large Pemba trial that reported only on malaria requiring hospital admission, while all other trials reported on fever with parasitaemia (Sazawal 2006 (C)a; Sazawal 2006 (C)b). Some degree of imprecision might exist in the latter outcome, as asymptomatic parasitaemia is common in malaria‐endemic regions and fever with parasitaemia may be caused by infections other than malaria. Funnel plot asymmetry was present in the analyses of iron versus placebo or no treatment, with an excess of small trials that favoured the control arm. However, we did not consider this as a reflection of publication bias since malaria was not the primary outcome assessed in most trials (specifically, it was not the primary outcome in all small trials) and the direction of the small trials' effect was against the safety of iron.
For the intervention of iron with folic acid, the large Pemba trial reported a significantly increased risk for death or hospital admission (Sazawal 2006 (C)a; Sazawal 2006 (C)b), but the relative contributions of the addition of folic acid and the poor infrastructure for diagnosis and surveillance of malaria to the adverse effects of iron in this trial are unclear. Thus, data on the safety of iron and folate supplementation are unclear.
Potential biases in the review process
There is an interest in the assessment of the effect of iron supplementation on malaria by iron status and iron‐deficiency anaemia at baseline. We could not conduct a subgroup analysis by individual children's iron status or haemoglobin at baseline due to the lack of subgroup data reported in the included trials for the outcomes of deaths and malaria. Our analyses stratified by anaemia are based on the study groups' mean haemoglobin level. Most of the trials recruited a uniform population of anaemic or non‐anaemic children, and thus enabled this stratification in the meta‐analysis. Although this analysis could mask an adverse effect in individual iron‐replete, non‐anaemic children compensated by benefit in iron‐deplete, anaemic children, the lack of heterogeneity in the analyses for malaria and deaths makes this possibility unlikely. This possibility is not supported by a trial‐level stratified analysis restricted to trials that recruited only anaemic or non‐anaemic children (data not shown). However, we could not conduct an analysis by true iron status or iron‐deficiency anaemia at baseline. Since all trials of non‐anaemic children had malaria prevention and management services, we could not assess iron supplementation in non‐anaemic populations where malaria prevention and management services were not present.
There was heterogeneity regarding the management of children identified as anaemic during the trial and after its conclusion. Some trials supplied iron to all children identified as anaemic below a certain threshold during the trial. After treatment, during a follow‐up period, children who remained anaemic were all given iron per protocol, were offered the possibility of treatment, or the issue was not addressed specifically. We could not assess the effects of this variable due to the large heterogeneity in trial protocols and poor reporting. This factor could underlie some of the unexplained heterogeneity observed in our analyses for haemoglobin and anaemia.
Much of the evidence relies on cluster RCTs. Naturally, these were the largest trials and thus carried a large weight in the meta‐analysis. However, the major outcomes assessed in these trials are probably correlated within clusters, including anaemia, iron status, malaria, and other infectious complications. In classes or schools, the correlation between individuals may be smaller than among families, but the large cluster size increases the cluster effect. Ideally, we would want these trials to be planned and analyzed accordingly. The trial should report on the unit of randomization, the average cluster size (number of children in household or class), the number of clusters and individuals randomized, the intracluster correlation coefficient (ICC) value for each outcome (denoting the degree of similarity between individuals in the same cluster) and an effect estimate adjusted for clustering. Unadjusted effect estimates, calculated as if the trial was individually randomized, may result in an exaggerated precision of the effect estimate, thus inflating the weight of the trial in the meta‐analysis. Out of the nine cluster RCTs included in our review, only Sazawal 2006 (C)a, Sazawal 2006 (C)b, and Zlotkin 2013 (C) reported adjusted analyses for the primary outcomes. In our analyses we used estimated ICCs to adjust the weight of the cluster RCTs in the meta‐analysis. We cannot be sure that the contribution of these trials to the compiled analysis is correct.
Other analyses or outcomes lacking from our Cochrane review include an assessment of the effect of children’s nutritional status at baseline on the results; analyses stratified by the schedule of iron supplementation (daily versus weekly); psychomotor and cognitive outcomes assessed in another Cochrane review (Wang 2013); tuberculosis, and age/weight/height‐adjusted Z scores for growth. Finally, we do not have the data from Sazawal 2006 (C)a on malaria‐related events, hospital admissions, and deaths for the two trial arms: iron plus folic acid plus vitamin A plus zinc versus zinc plus vitamin A. These data could add 16,196 more children to the analyses of iron plus folic acid versus placebo treatment. Similarly, we cannot exclude the existence of more unpublished RCTs that could contribute to the evidence on iron supplementation and malaria, such as those identified in PhD theses (Gebreselassie 1996; Adam 1997 (C)) or others (Roschnik 2003 (C)).
Agreements and disagreements with other studies or reviews
Sazawal 2006 (C)a is by far the largest trial to date, and probably the only trial to date, powered to assess the effect of iron supplementation on severe malaria. It showed a significantly increased risk for the composite outcome of death or hospitalization among children, most of whom who were younger than two years of age. The risk of death was increased, but without statistical significance. In a stratified analysis of an independent substudy, we observed adverse effects of iron supplementation among children who were iron‐replete and non‐anaemic at baseline, while among children who were iron‐deficient and anaemic there were fewer adverse events. At the time there was no malaria control programme in Zanzibar, and the main trial's protocol did not offer children special malaria prevention or management services. In the substudy, Sazawal 2006 (C)b, surveillance for parasitaemia was performed and children received treatment according to the study protocol in their homes. The main trial showed that iron is harmful, while the substudy showed that iron supplementation is protective for severe malaria. Our analysis, which included all trials that assessed iron supplementation, concords with this conclusion (Analysis 3.1).
In 2007, based on Sazawal 2006 (C)a, the World Health Organization (WHO) released a statement that recommended that iron supplementation should be prescribed only after screening for iron deficiency (WHO 2007). Universal screening for anaemia and iron status places a significant burden on healthcare systems in low‐income countries. This Cochrane review was originally published in 2009, Ojukwu 2009, and added further debate into the conundrum of iron supplementation for children in malaria‐endemic areas (Roth 2010; Stoltzfus 2010; Suchdev 2010; Oppenheimer 2012). The previous versions of this systematic review, Ojukwu 2009 and Okebe 2011, challenged the recommendations for universal screening, and placed the Sazawal 2006 (C)a trial in the context of the complete evidence. In 2011 the WHO amended its recommendation to state that “In malaria‐endemic areas, the provision of iron should be implemented in conjunction with measures to prevent, diagnose and treat malaria" (WHO 2011c). In 2013 the results of the Zlotkin 2013 (C) trial became available, with no harm observed for iron‐treated children. Children included in the latter trial underwent initial screening for malaria, received insecticide‐treated bed nets, and were provided with first‐line antimalarial treatment if ill. The results of the Zlotkin 2013 (C) trial and this current analysis further shift the emphasis of decision making prior to iron supplementation on malaria prevention and management rather than on the assessment of iron status.

Methodological quality graph: review authors' judgements about each methodological quality item presented as percentages across all included trials. The unclear category for incomplete outcome data represents trials that did not report this outcome.

Methodological quality summary: review authors' judgements about each methodological quality item for each included trial.

Funnel plot of comparison: 1. Iron versus placebo or no treatment, outcome: 1.1 Clinical malaria (grouped by presence of anaemia).

Comparison 1 Iron versus placebo or no treatment, Outcome 1 Clinical malaria (grouped by presence of anaemia).

Comparison 1 Iron versus placebo or no treatment, Outcome 2 Clinical malaria (grouped by age).

Comparison 1 Iron versus placebo or no treatment, Outcome 3 Clinical malaria (P. falciparum only).

Comparison 1 Iron versus placebo or no treatment, Outcome 4 Any parasitaemia, end of treatment (by anaemia at baseline).

Comparison 1 Iron versus placebo or no treatment, Outcome 5 All‐cause mortality.

Comparison 1 Iron versus placebo or no treatment, Outcome 6 Clinical malaria with high‐grade parasitaemia or requiring admission.

Comparison 1 Iron versus placebo or no treatment, Outcome 7 Any parasitaemia, end of treatment ( by age).

Comparison 1 Iron versus placebo or no treatment, Outcome 8 Any parasitaemia, end of treatment (P. falciparum only).

Comparison 1 Iron versus placebo or no treatment, Outcome 9 Any parasitaemia, end of treatment (by allocation concealment).

Comparison 1 Iron versus placebo or no treatment, Outcome 10 High‐grade parasitaemia.

Comparison 1 Iron versus placebo or no treatment, Outcome 11 Any parasitaemia, end of follow‐up.

Comparison 1 Iron versus placebo or no treatment, Outcome 12 Hospitalizations and clinic visits.
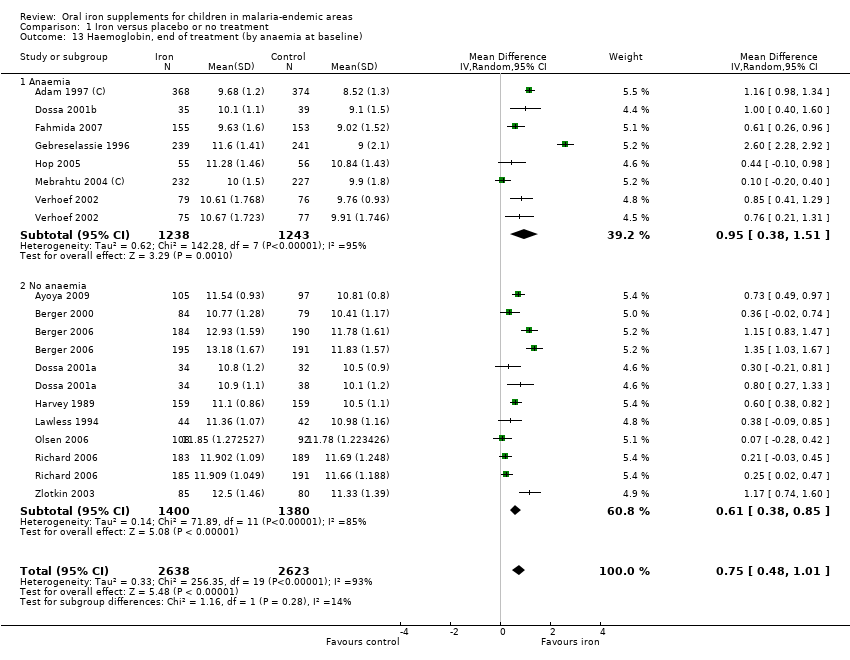
Comparison 1 Iron versus placebo or no treatment, Outcome 13 Haemoglobin, end of treatment (by anaemia at baseline).

Comparison 1 Iron versus placebo or no treatment, Outcome 14 Weight, end value.

Comparison 1 Iron versus placebo or no treatment, Outcome 15 Anaemia, end of treatment.

Comparison 1 Iron versus placebo or no treatment, Outcome 16 Weight, change from baseline.
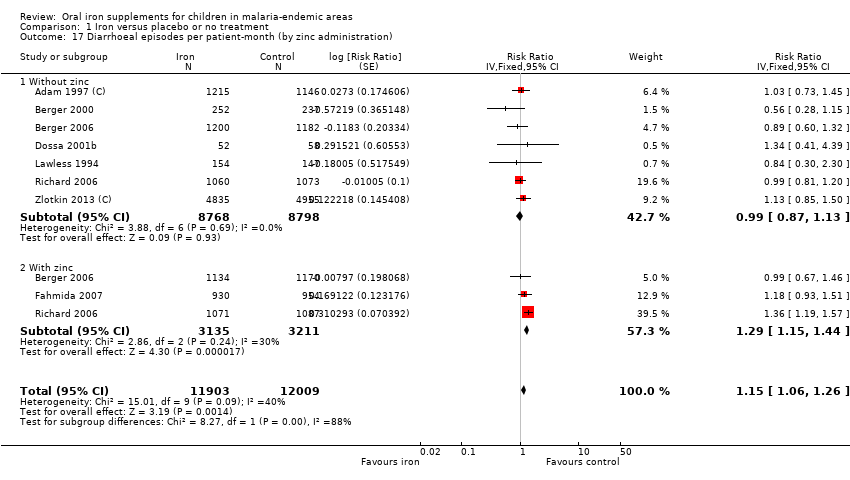
Comparison 1 Iron versus placebo or no treatment, Outcome 17 Diarrhoeal episodes per patient‐month (by zinc administration).

Comparison 1 Iron versus placebo or no treatment, Outcome 18 Infections per patient‐month.

Comparison 1 Iron versus placebo or no treatment, Outcome 19 Haemoglobin, change from baseline, end of treatment.

Comparison 1 Iron versus placebo or no treatment, Outcome 20 URTI/pneumonia episodes per patient‐month.
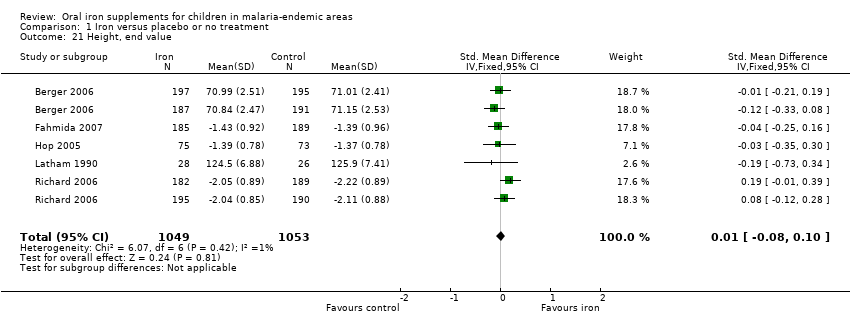
Comparison 1 Iron versus placebo or no treatment, Outcome 21 Height, end value.

Comparison 1 Iron versus placebo or no treatment, Outcome 22 Height, change from baseline.
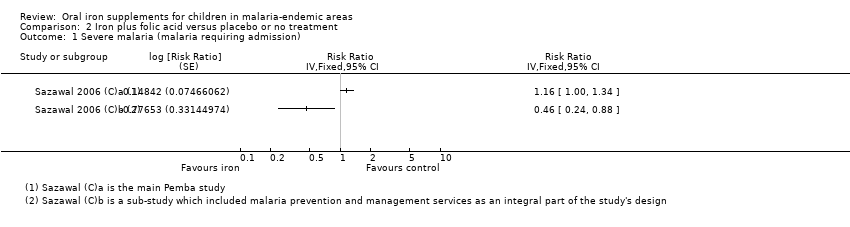
Comparison 2 Iron plus folic acid versus placebo or no treatment, Outcome 1 Severe malaria (malaria requiring admission).

Comparison 2 Iron plus folic acid versus placebo or no treatment, Outcome 2 Severe malaria (cerebral malaria).

Comparison 2 Iron plus folic acid versus placebo or no treatment, Outcome 3 All‐cause mortality.

Comparison 2 Iron plus folic acid versus placebo or no treatment, Outcome 4 Any hospitalization.

Comparison 2 Iron plus folic acid versus placebo or no treatment, Outcome 5 Haemoglobin, end of treatment.

Comparison 2 Iron plus folic acid versus placebo or no treatment, Outcome 6 Anaemia, end of treatment.

Comparison 2 Iron plus folic acid versus placebo or no treatment, Outcome 7 Weight, end value.

Comparison 2 Iron plus folic acid versus placebo or no treatment, Outcome 8 Height, end value.
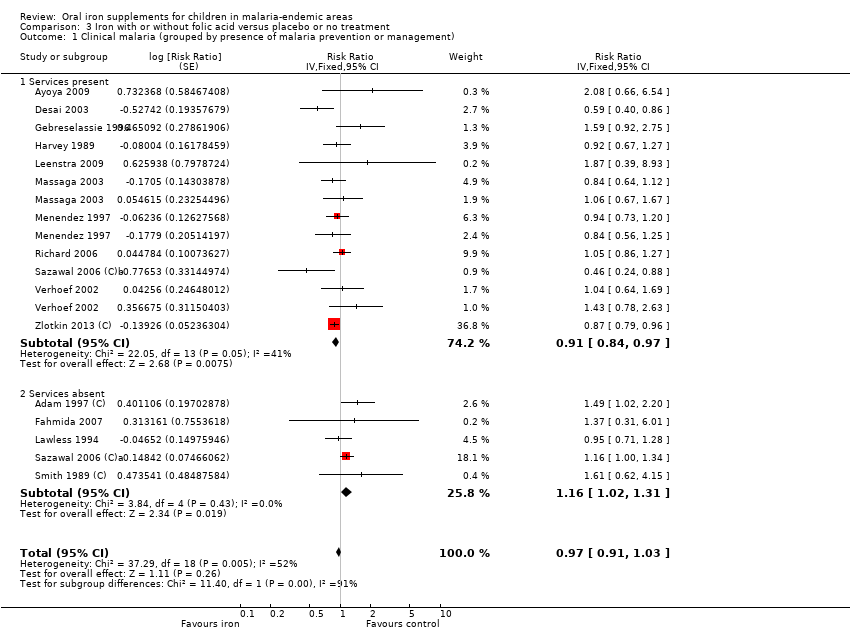
Comparison 3 Iron with or without folic acid versus placebo or no treatment, Outcome 1 Clinical malaria (grouped by presence of malaria prevention or management).
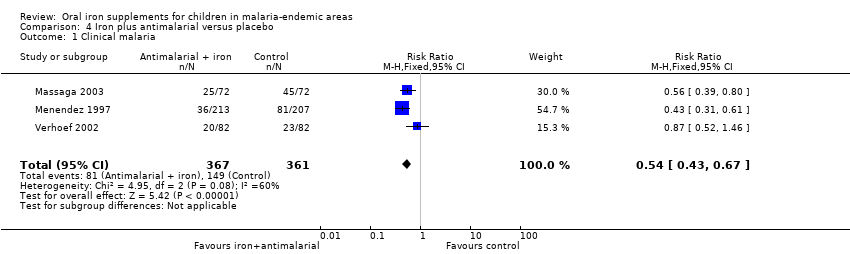
Comparison 4 Iron plus antimalarial versus placebo, Outcome 1 Clinical malaria.
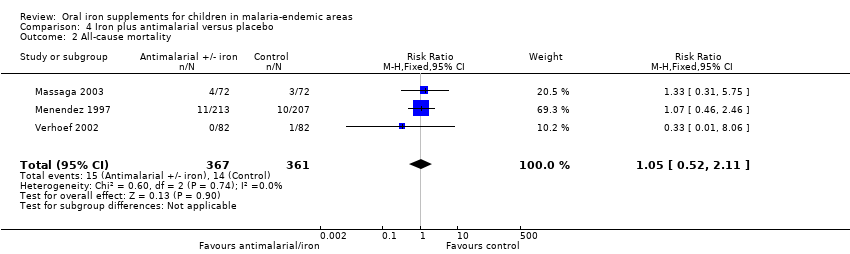
Comparison 4 Iron plus antimalarial versus placebo, Outcome 2 All‐cause mortality.
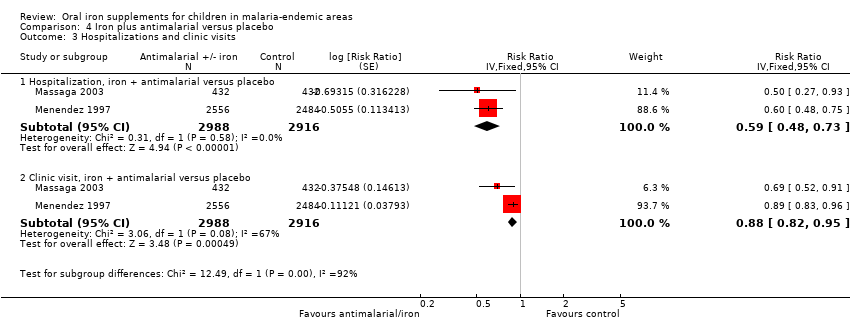
Comparison 4 Iron plus antimalarial versus placebo, Outcome 3 Hospitalizations and clinic visits.

Comparison 4 Iron plus antimalarial versus placebo, Outcome 4 Haemoglobin at end of treatment.
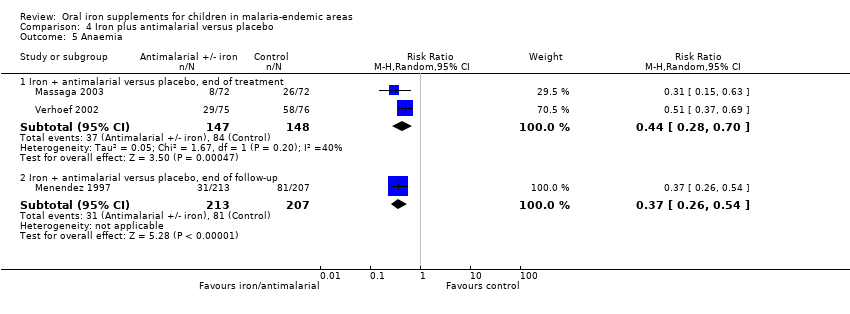
Comparison 4 Iron plus antimalarial versus placebo, Outcome 5 Anaemia.
| Does iron supplementation or fortification increase malaria and related morbidity and mortality among children in malaria‐endemic areas? | ||||||
| Participant or population: children in malaria‐endemic areas | ||||||
| Subgroup | Anticipated absolute effects* (95% CI) | Relative effect results | Number of participants | Quality of the evidence | Comments | |
| Risk with placebo or no treatment | Risk with iron supplementation | |||||
| Clinical malaria | 27/100 | 25/100 (23 to 27) | RR 0.93 (0.87 to 1.00) | 7168 (14 RCTs) | ⊕⊕⊕⊕ High1 | Overall, among anaemic or non‐anaemic children, iron does not cause an excess of clinical malaria |
| Clinical malaria Subgrouped by population anaemia (trial level) | Anaemic at baseline | RR 0.92 | 7168 (14 RCTs) | ⊕⊕⊕⊝ | In populations where anaemia is common, iron probably does not cause an excess of clinical malaria | |
| 256 per 1000 | 236 per 1000 | |||||
| Not anaemic at baseline | RR 0.97 | 2112 | ⊕⊕⊕⊝ | In populations where anaemia is uncommon, iron probably does not cause an excess of clinical malaria | ||
| 326 per 1000 | 316 per 1000 | |||||
| Severe malaria Defined as clinical malaria with high‐grade parasitaemia or requiring admission | 397 per 1000 | 357 per 1000 | RR 0.90 | 3421 | ⊕⊕⊕⊕ | Iron supplementation does not cause an excess of severe malaria |
| Death | 10 per 10000 | 10 per 1000 (10 to 10) | Not estimated | 7576 (18 RCTs) | ⊕⊕⊝⊝ Low4 | Iron may have no effect on mortality |
| Hospitalization plus clinic visits | 295 per 1000 | 295 per 1000 | RR 0.99 | 12,578 | ⊕⊝⊝⊝ | It is uncertain whether iron affects hospitalizations or clinic visits |
| *The risk in the intervention group (and its 95% CI) is based on the assumed risk in the comparison group and the relative effect of the intervention (and its 95% CI). | ||||||
| GRADE Working Group grades of evidence | ||||||
| 1Funnel plot asymmetry favouring the control arm, publication bias not suspected. The CIs range from important benefits of iron supplementation in reducing clinical malaria to no excess of clinical malaria. | ||||||
| Does iron with or without folic acid increase malaria among children in malaria‐endemic areas? | ||||||
| Participant or population: children in malaria‐endemic areas | ||||||
| Subgroup | Anticipated absolute effects* (95% CI) | Relative effect results | Number of participants | Quality of the evidence | Comments | |
| Risk with placebo or no treatment | Risk with iron supplementation | |||||
| Clinical malaria Subgrouped by presence of malaria prevention or management services | Malaria prevention or management services present | RR 0.91 (0.84 to 0.97) | 5586 | ⊕⊕⊝⊝ | In areas where there are prevention and management services for malaria, iron supplementation may reduce clinical malaria | |
| 24 per 100 | 22 per 1000 | |||||
| Malaria prevention or management services not present | RR 1.16 | 19,086 | ⊕⊕⊝⊝ | In areas where there are no prevention and management services for malaria, iron may increase the number of children with clinical malaria | ||
| 6 per 100 | 7 per 1000 | |||||
| *The risk in the intervention group (and its 95% CI) is based on the assumed risk in the comparison group and the relative effect of the intervention (and its 95% CI). | ||||||
| GRADE Working Group grades of evidence | ||||||
| 1Downgraded by 1 for inconsistency and 1 for funnel plot asymmetry and suspected publication bias. | ||||||
| Is iron supplementation with antimalarial treatment safe and beneficial for children living in malaria‐endemic areas? | ||||||
| Participant or population: children with or without anaemia at baseline | ||||||
| Outcomes | Illustrative comparative risks* (95% CI) | Relative effect | No of participants | Quality of the evidence | Comments | |
| Assumed risk | Corresponding risk | |||||
| Control | Iron supplementation plus antimalarial | |||||
| Clinical malaria | 41 per 100 | 22 per 100 | RR 0.54 | 728 | ⊕⊕⊕⊕ | Iron given together with antimalarial antimicrobials reduce malaria |
| All‐cause mortality | 42 per 1000 | 44 per 1000 (23 to 85) | RR 1.05 | 728 (3 (RCTs) | ⊕⊕⊝⊝ | Iron given together with antimalarial antimicrobials may have no effect on mortality |
| *The basis for the assumed risk (for example, the median control group risk across studies) is provided in the footnotes. The corresponding risk (and its 95% CI) is based on the assumed risk in the comparison group and the relative effect of the intervention (and its 95% CI). | ||||||
| GRADE Working Group grades of evidence | ||||||
| 1All trials were individually randomized, with adequate concealment, double‐blinded, and no loss to follow‐up. | ||||||
| Area definition | Parasite rates | Description | Geographical location |
| Hypoendemicity (also called designated unstable malaria) | 10% or fewer children aged 2 to 9 years, but may be higher for part of the year | Areas where there is little transmission and during the average year the effects upon the general population are unimportant | AFRO: Chad |
| Mesoendemicity (also called unstable and stable malaria) | 11 to 50% of children aged 2 to 9 years | Typically found among rural communities in subtropical zones where wide geographical variations in transmission exist | AFRO: Angola, Botswana, Cape Verde, Chad, Eritrea, Ethiopia, Kenya (considered hyper‐ or holoendemic in review, as indicated in most of the trials), Mauritania, Namibia, Niger, Zambia, Zimbabwe |
| Hyperendemicity (also called stable malaria) | Consistently > 50% among children aged 2 to 9 years | Areas where transmission is intense but seasonal; immunity is insufficient in all age groups | AFRO: Angola, Benin, Burkina Faso, Cameroon, Central African Republic, Chad, Congo, Côte d'Ivoire, Equatorial Guinea, Gabon, Gambia, Ghana, Guinea, Guinea‐Bissau, Liberia, Madagascar, Malawi, Mali, Mozambique, Nigeria, Sao Tome and Principe, Senegal, Sierra Leone, Togo, Uganda,Tanzania, Zambia |
| Holoendemicity (also called stable malaria) | Consistently > 75% among infants aged 0 to 11 months | Intense transmission resulting in a considerable degree of immunity after early childhood | AFRO: Central African Republic, Democratic Republic of Congo, Tanzania, Uganda, Burundi, Madagascar, Malawi, Mozambique |
| Abbreviations: AFRO: WHO African Regional Office; AMRO: WHO Americas Regional Office; EMRO: WHO Eastern Mediterranean Regional Office; EURO: WHO Europe Regional Office; SEARO: WHO South East Asian Regional Office; WPRO: WHO Western Pacific Regional Office. | |||
| Age group | Minimal daily dose |
| < 6 months | 2 mg/kg |
| 6 to 24 months | 12.5 mg or 2 mg/kg |
| 2 to 5 years | 20 mg |
| 6 to 11 years | 30 mg |
| 11 to 18 years | 60 mg |
| Abbreviations: WHO: World Health Organization; RDA: recommended dietary allowance. | |
| Search set | CIDG SRa | CENTRAL | MEDLINEb | EMBASEb | LILACSb |
| 1 | iron | iron | iron | iron | iron |
| 2 | ferrous | ferrous | ferrous | FERROUS‐SULPHATE | ferrous |
| 3 | 1 or 2 | IRON COMPOUNDS | IRON COMPOUNDS | 1 or 2 | 1 or 2 |
| 4 | malaria | 1 or 2 or 3 | 1 or 2 or 3 | supplem$ | malaria |
| 5 | anaemia | supplem* | supplem* | 3 and 4 | anaemia |
| 6 | anaemia | 4 and 5 | 4 and 5 | malaria | anaemia |
| 7 | 4 or 5 or 6 | malaria | malaria | anaemia | 4 or 5 or 6 |
| 8 | 3 and 7 | anaemia | anaemia | 6 or 7 | 3 and 7 |
| 9 | — | anaemia | anaemia | 5 and 8 | — |
| 10 | — | 7 or 8 or 9 | 7 or 8 or 9 | child$ | — |
| 11 | — | 6 and 10 | 6 and 10 | infant$ | — |
| 12 | — | — | child* | 10 or 11 | — |
| 13 | — | — | infant* | 9 and 12 | — |
| 14 | — | — | 12 or 13 | — | — |
| 15 | — | — | 11 and 14 | — | — |
| aCochrane Infectious Diseases Group Specialized Register. | |||||
| Trial ID | Clinical definition | Laboratory definition | Malaria‐related outcomes reported | Time of assessment | Malaria prevention or management strategies | Malaria prevention or management |
| Physician's diagnosis of malaria | Any parasitaemia (all malaria species, assumed most Plasmodium falciparum since trial conducted in same region as Gebreselassie 1996) | Clinical malaria; any parasitaemia; malaria necessitating hospitalization (used as severe malaria); parasite density (all N events/N individuals, unadjusted for clustering) | 3 months to end of treatment | Blood smears for malaria obtained before, during and after treatment. Children with clinical malaria referred to local hospital and treated | No | |
| Fever > 37.5°C (axillary) | Any parasitaemia (P. falciparum) | Clinical malaria; clinical malaria with parasitaemia ≥ 5000/μL (used as severe malaria); parasite density | 3 months to end of treatment | Malaria screening was done at baseline for all children and repeated throughout the study in children who had fever. Children infected with P. falciparum also were treated with sulfadoxine‐pyrimethamine | Yes | |
| Isolated fever | Parasite density > 3000 (P. falciparum, Plasmodium malariae and Plasmodium ovale assessed. Over 97% were P. falciparum) | Parasite index (%, used as parasitaemia); parasitaemia above 3000 /µL (used as severe malaria) and 10,000 / µL (%); parasite density | 3 months to end of treatment 9 months to end of follow‐up (FU) | Blood smears for malaria obtained at baseline, end of treatment (3 months) and end of FU (6 months). Chloroquine treatment given for all isolated fevers | Yes | |
| Fever ≥37.5°C | Any parasitaemia (P. falciparum) with fever or parasitaemia > 5000/mm3 alone | Clinical malaria; any parasitaemia; hazard ratios for these; parasite density | 3 months to end of treatment | Blood smears at baseline and every 4 weeks. Oral quinine given for any fever with parasitaemia and cases of severe malaria referred for further treatment | Yes | |
| No clinical definition | Any parasitaemia | All cause sick visits (including malaria), | 3 months to end of treatment 6 months to end of FU | Routine trimethoprim ‐ sulfamethoxazole prophylaxis | Yes | |
| Not stated | Not stated | Participants with "malaria" (used primarily as clinical malaria) | 6 months to end of treatment | Not stated | No | |
| Fever ≥ 37.5°C with signs and symptoms suggestive of malaria and other diagnoses ruled out | Presence of parasites in blood (all species, P. falciparum 88.9%) | Children with at least one episode of clinical malaria; cumulative incidence of parasitaemia; parasite density > 5000 µL (used as severe malaria); parasite density | 3 months to end of treatment 6 months to end of FU | Blood smears negative at baseline and repeated weekly. Chloroquine with or without primaquine given for any positive smear | Yes | |
| Fever and headache at the same time | Any parasitaemia (P. falciparum 67%, P. vivax 26.4%, P. malariae 6.6%) | First episodes of clinically suspected malaria (used primarily as clinical malaria); any parasitaemia | 4 months to end of treatment 6 months to end of FU | Blood smears for malaria obtained at 0, 6, 16, and 24 weeks. Chloroquine given for any illness reported as fever or headache, or both | Yes | |
| Not assessed | Any positive smear (malaria species not stated) | Any positive smear; parasite density | 8 months to end of FU | Blood smears for malaria obtained at baseline and end of treatment. Treatment not stated | Yes | |
| Child's recall of clinical illness | Any positive blood smear (malaria species not stated) | Malaria is not defined (used as clinical malaria) | 3.5 months to end of treatment | No blood smears at baseline or during the trial (only at end of treatment). Treatment not stated | No | |
| Fever ≥ 37.5°C | Positive blood smear (malaria species not stated) | Episodes of clinical malaria and RRs adjusted for school; episodes of malaria parasitaemia and parasitaemia > 500 parasites/mm3 (used as severe malaria) and RRs adjusted for school, age, and baseline parasitaemia | 5 months to end of treatment | Blood smears for malaria at baseline (1/4 of participants positive) and monthly during the trial. No treatment offered for positive smears; symptomatic cases referred to physician | Yes | |
| History of fever in the previous 24 to 72 hours or measured temperature of ≥ 37.5°C | Any level of parasitaemia (P. falciparum only) | Clinical malaria as first or only episode per participant (used as clinical malaria) and episodes of clinical malaria; episodes of clinical malaria associated with parasitaemia > 5000 parasites/μL (used as severe malaria) | 6 months to end of treatment | Blood smears for malaria at baseline and every 2 weeks. Sulfadoxine‐pyrimethamine treatment given for uncomplicated cases; complicated and severe malaria referred to the hospital | Yes | |
| Not assessed | Any positive smear (P. falciparum only) | Parasitaemia as OR (95% CI) adjusted for repeated measurements in each child | 12 months to end of treatment | Blood smears for malaria at baseline and end of treatment. In addition, monthly smears from a random sample (50% of randomized). Treatment not stated | Yes | |
| Fever ≥ 37.5°C | Parasitaemia of any density (P. falciparum only) | First or only episode of clinical malaria | 1 year (6 months after end of treatment) | Blood smears for malaria at baseline, week 8 and for any fever. Chloroquine treatment given for clinical malaria | Yes | |
| Any fever within the previous 72 hours | P. falciparum (29%) or P. vivax (71%), any density | Episodes of falciparum or vivax malaria, or both (used primarily as clinical malaria) | 7 months to end of treatment | Blood smears for malaria at baseline and whenever febrile. Treatment given for all clinical cases | Yes | |
| Fever > 38°C and | Parasitaemia > 1000 or history of fever and parasitaemia > 3000 or parasitaemia > 10,000 parasites/mm3 regardless of fever (mostly P. falciparum) | Malaria‐related adverse events, defined as hospital admission or death due to malaria (used primarily as clinical malaria). RRs with 95% CI adjusted for multiple events per child and clustering; cerebral malaria (used as severe malaria) | Not fixed. End of treatment about 1 year and end of FU about 18 months | No baseline or routine surveillance for malaria during the trial. Treatment given only if admitted to the hospital and malaria diagnosed | No | |
| Fever > 38°C | Parasitaemia > 1000 or history of fever and parasitaemia > 3000 or parasitaemia > 10,000 parasites/mm3 regardless of fever (mostly P. falciparum) | Malaria‐related adverse events, defined as hospital admission or death due to malaria (used primarily as clinical malaria). RRs with 95% CI adjusted for multiple events per child and clustering; cerebral malaria (used as severe malaria) | Not fixed. End of treatment about 1 year and end of FU about 18 months | Blood smear for malaria at baseline, and at 6 and 12 months. Sulfadoxine‐pyrimethamine treatment delivered to home to all slide‐confirmed malaria participants or clinical disease presenting during the study | Yes | |
| Fever > 37.5°C | > 500 parasites/mm3 (mostly P. falciparum) | Visits for clinical malaria; parasitaemia > 500/µL; fever with parasitaemia > 5000 parasites/mm3 (used as severe malaria (all N events/N individuals, unadjusted for clustering) | 3 months to end of treatment | Blood smear for malaria at baseline, 2 weeks and end of treatment. No treatment at baseline; clinical malaria referred to local healthcare services | No | |
| Axillary temperature ≥ 37.5°C | Dipstick test for P. falciparum | Number of children with malaria infection (used primarily as clinical malaria) | 3 months to end of treatment | Dipstick for P. falciparum tested at baseline, 4, 8, and 12 weeks. Confirmed with blood smear if febrile and treated with sulfadoxine‐pyrimethamine, amodiaquine or halofantrine | Yes | |
| Axillary temperature ≥ 37.5°C | Parasitaemia of any density (mostly P. falciparum) | Incidence of clinical malaria, malaria with parasite density > 5000/µL, cerebral malaria | 5 months to end of treatment 6 months to end of FU | Insecticide‐treated bed nets supplied with instructions for use. Children with malaria treated with artemisinin combination therapy | Yes | |
| Time of assessment: refers to time from randomization. | ||||||
| Trial ID | Outcome | n Int reported | N Int reported | n Cont reported | N Cont reported | Average cluster size | DE | Unadjusted RR (95% CI) | ln(RR) | Unadjusted SE(lnRR) | Adjusted SE(lnRR)/ sample size |
| Clinical malaria | 72 | 366 | 49 | 372 | Household (used 1.5) | 1.34 | 1.49 (1.07 to 2.08) | 0.40 | 0.17 | 0.20 | |
| Parasitaemia | 127 | 368 | 101 | 372 | Household (used 1.5) | 1.34 | 1.27 (1.02 to 1.58) | 0.24 | 0.11 | 0.13 | |
| Clinical malaria necessitating hospitalization | 41 | 405 | 32 | 382 | Household (used 1.5) | 1.34 | 1.21 (0.78 to 1.88) | 0.19 | 0.22 | 0.26 | |
| Parasitaemia | — | 307 | — | 307 | 1.5 | 1.34 | OR 0.9 (0.72 to 1.19) Converted to RR 0.98 | 0.47 | 0.28 | 0.32 | |
| High‐grade parasitaemia | — | 307 | — | 307 | 1.5 | 1.34 | OR 1.04 (0.82 to 1.34) Converted to RR 1.03 | 0.03 | 0.12 | 0.14 | |
| Clinical malaria | 467 | 7950 | 411 | 8006 | 1.4 | — | 1.16 (1.00 to 1.34) | 0.15 | — | 0.07 | |
| Severe malaria (cerebral) | — | 7950 | — | 8006 | 1.4 | — | 1.32 (1.02 to 1.70) | 0.28 | — | 0.13 | |
| Clinical malaria | 14 | 815 | 30 | 804 | 1.2 | — | 0.46 (0.24 to 0.88) | ‐0.78 | — | 0.33 | |
| Severe malaria (cerebral) | 4 | 815 | 15 | 804 | 1.2 | — | 0.26 (0.09 to 0.81) | ‐1.35 | — | 0.56 | |
| Clinical malaria | 14 | 97 | 8 | 89 | Household (used 1.5) | 1.34 | 1.60 (0.42 to 0.71) | 0.47 | 0.42 | 0.48 | |
| Parasitaemia | 28 | 97 | 16 | 89 | Household (used 1.5) | 1.34 | 1.61 (0.93 to 2.76) | 0.47 | 0.28 | 0.32 | |
| High‐grade parasitaemia | 17 | 97 | 11 | 89 | Household (used 1.5) | 1.34 | 1.42 (0.70 to 2.86) | 0.35 | 0.13 | 0.15 | |
| Clinical malaria | 338 | 966 | 392 | 989 | Compounds | — | 0.87 (0.79 to 0.97) | ‐0.14 | — | 0.05 | |
| Clinical malaria with high grade parasitaemia | 273 | 966 | 308 | 989 | Compounds | — | 0.89 (0.80 to 1.00) | ‐0.12 | — | 0.06 | |
| Text in bold;results provided in publication or from authors adjusted for clustering. | |||||||||||
| Study ID | Outcome | n Int reported | N Int reported | n Cont reported | N Cont reported | Average cluster size | DE | n Int adjusted | N Int adjusted | n Cont adjusted | N Cont adjusted |
| Anaemia | 364 | 368 | 357 | 374 | Household (used 1.5) | 1.4 | 260 | 263 | 255 | 267 | |
| Anaemia | 273 | 551 | 356 | 562 | 20 | 2.77 | 99 | 199 | 129 | 203 | |
| All‐cause mortality | 0 | 340 | 2 | 344 | 1.5 | 1.001 | 0 | 340 | 2 | 344 | |
| Anaemia | 180 | 232 | 172 | 272 | 1.5 | 1.4 | 129 | 166 | 123 | 194 | |
| Anaemia | 133 | 224 | 110 | 203 | 30 | 3.70 | 36 | 61 | 30 | 55 | |
| All‐cause mortality | 149 | 7950 | 130 | 8006 | 1.4 | 1.001 | 149 | 7941 | 130 | 7996 | |
| All‐cause mortality | 8 | 815 | 9 | 804 | 1.2 | 1.0004 | 8 | 815 | 9 | 804 | |
| Anaemia | 4 | 308 | 7 | 327 | 1.2 | 1.4 | 3 | 220 | 5 | 234 | |
| All‐cause mortality | 3 | 967 | 2 | 991 | Compound | 1.001 | 3 | 966 | 2 | 990 | |
| None of the trials provided results adjusted for clustering for the outcomes reported in the table. | |||||||||||
| Trial ID | Intervention | Unit of measurement | Iron | Control | No. iron | No. control | Favours |
| For prevention or treatment of anaemia | |||||||
| Iron versus placebo | Geometric mean, parasites/μL | 15,059 | 8225 | 368 slides | 372 slides | Control | |
| Iron versus placebo | Geometric mean, parasites/μL ± SD | 2733 ± 1459 | 2648 ± 1562 | 105 children | 97 children | Control | |
| Iron versus placebo | Geometric mean, RBC/mm3 | 61.2 | 25.7 | 49 children with malarial index | 39 children with malarial index | Controlor similar | |
| Iron plus antimalaria versus antimalaria Iron versus placebo (with single‐dose antimalarial treatment) | Geometric mean, parasites/mm3 | 1705 2569 | 2485 3778 | 129 children 127 children | 127 children 108 children | Iron | |
| Iron versus placebo | Average parasite density class (parasite density classified in ascending order from 1 to 10) | 5.2 | 5.0 | 239 children | 241 children | Control or similar | |
| Iron versus placebo | Geometric mean, infected RBCs/100 WBC | 4.8 | 1.9 | 28 children | 26 children | Control | |
| Iron versus placebo | Geometric mean, parasites/μL (counting against 200 to 500 WBC, assuming 8000 WBC/μL | Age < 30 months 3402 Age > 30 months 2188 | Age < 30 months 3422 Age > 30 months 2046 | 273 children (225 households) | 265 children (225 households) | Similar | |
| For treatment of malaria | |||||||
| Iron daily plus antimalarial versus iron weekly plus antimalarial versus antimalarial | Mean, parasites/μL (counting against 300 WBC, assuming 6000 WBC/μL | 4927 (daily) 2207 (weekly) | 1812 | 77 (daily) 63 (weekly) children | 75 children | Control | |
| Iron plus antimalarial plus folic acid versus antimalarial plus folic acid | Geometric mean, parasites/μL | 5308 | 9302 | 48 children | 47 children | Iron (at baseline groups unbalanced favouring placebo) | |
| Abbreviations: RBC: red blood cell; WBC: white blood cell. | |||||||
| Outcome or subgroup title | No. of studies | No. of participants | Statistical method | Effect size |
| 1 Clinical malaria (grouped by presence of anaemia) Show forest plot | 14 | Risk Ratio (Fixed, 95% CI) | 0.93 [0.87, 1.00] | |
| 1.1 Anaemia | 9 | Risk Ratio (Fixed, 95% CI) | 0.92 [0.84, 1.00] | |
| 1.2 No anaemia | 5 | Risk Ratio (Fixed, 95% CI) | 0.97 [0.86, 1.09] | |
| 2 Clinical malaria (grouped by age) Show forest plot | 14 | Risk Ratio (Fixed, 95% CI) | 0.93 [0.87, 1.00] | |
| 2.1 < 2 years | 5 | Risk Ratio (Fixed, 95% CI) | 0.89 [0.82, 0.97] | |
| 2.2 2 to 5 years | 3 | Risk Ratio (Fixed, 95% CI) | 0.97 [0.75, 1.26] | |
| 2.3 > 5 years | 6 | Risk Ratio (Fixed, 95% CI) | 1.04 [0.91, 1.20] | |
| 3 Clinical malaria (P. falciparum only) Show forest plot | 9 | Risk Ratio (Fixed, 95% CI) | 0.91 [0.84, 0.99] | |
| 4 Any parasitaemia, end of treatment (by anaemia at baseline) Show forest plot | 9 | Risk Ratio (Fixed, 95% CI) | 1.11 [1.00, 1.23] | |
| 4.1 Anaemia | 6 | Risk Ratio (Fixed, 95% CI) | 1.07 [0.94, 1.23] | |
| 4.2 No anaemia | 3 | Risk Ratio (Fixed, 95% CI) | 1.17 [0.99, 1.40] | |
| 5 All‐cause mortality Show forest plot | 18 | 7576 | Risk Difference (M‐H, Fixed, 95% CI) | 0.00 [‐0.00, 0.01] |
| 6 Clinical malaria with high‐grade parasitaemia or requiring admission Show forest plot | 5 | Risk Ratio (Fixed, 95% CI) | 0.90 [0.81, 0.98] | |
| 7 Any parasitaemia, end of treatment ( by age) Show forest plot | 9 | Risk Ratio (Fixed, 95% CI) | 1.11 [1.00, 1.23] | |
| 7.1 < 2 years | 2 | Risk Ratio (Fixed, 95% CI) | 1.28 [0.98, 1.68] | |
| 7.2 2 to 5 years | 4 | Risk Ratio (Fixed, 95% CI) | 1.06 [0.91, 1.23] | |
| 7.3 > 5 years | 3 | Risk Ratio (Fixed, 95% CI) | 1.12 [0.93, 1.34] | |
| 8 Any parasitaemia, end of treatment (P. falciparum only) Show forest plot | 7 | Risk Ratio (Fixed, 95% CI) | 1.09 [0.97, 1.23] | |
| 8.1 Iron versus placebo/no treatment | 5 | Risk Ratio (Fixed, 95% CI) | 1.09 [0.96, 1.24] | |
| 8.2 Iron + antimalarial versus antimalarial | 2 | Risk Ratio (Fixed, 95% CI) | 1.10 [0.76, 1.59] | |
| 9 Any parasitaemia, end of treatment (by allocation concealment) Show forest plot | 9 | Risk Ratio (Fixed, 95% CI) | 1.11 [1.00, 1.23] | |
| 9.1 Adequate | 4 | Risk Ratio (Fixed, 95% CI) | 0.98 [0.83, 1.15] | |
| 9.2 Unclear | 5 | Risk Ratio (Fixed, 95% CI) | 1.22 [1.06, 1.40] | |
| 10 High‐grade parasitaemia Show forest plot | 5 | Risk Ratio (Fixed, 95% CI) | 1.13 [0.93, 1.37] | |
| 11 Any parasitaemia, end of follow‐up Show forest plot | 5 | 1150 | Risk Ratio (M‐H, Fixed, 95% CI) | 1.23 [1.09, 1.40] |
| 12 Hospitalizations and clinic visits Show forest plot | 7 | Risk Ratio (Fixed, 95% CI) | 0.99 [0.95, 1.04] | |
| 12.1 Hospitalization, iron versus placebo | 5 | Risk Ratio (Fixed, 95% CI) | 0.94 [0.82, 1.08] | |
| 12.2 Hospitalization, iron + antimalarial versus antimalarial | 3 | Risk Ratio (Fixed, 95% CI) | 1.23 [0.97, 1.56] | |
| 12.3 Clinic visit, iron versus placebo | 2 | Risk Ratio (Fixed, 95% CI) | 0.95 [0.88, 1.02] | |
| 12.4 Clinic visit, iron + antimalarial versus antimalarial | 4 | Risk Ratio (Fixed, 95% CI) | 1.03 [0.96, 1.10] | |
| 13 Haemoglobin, end of treatment (by anaemia at baseline) Show forest plot | 16 | 5261 | Mean Difference (IV, Random, 95% CI) | 0.75 [0.48, 1.01] |
| 13.1 Anaemia | 7 | 2481 | Mean Difference (IV, Random, 95% CI) | 0.95 [0.38, 1.51] |
| 13.2 No anaemia | 9 | 2780 | Mean Difference (IV, Random, 95% CI) | 0.61 [0.38, 0.85] |
| 14 Weight, end value Show forest plot | 5 | 1830 | Std. Mean Difference (IV, Fixed, 95% CI) | ‐0.03 [‐0.12, 0.06] |
| 15 Anaemia, end of treatment Show forest plot | 15 | 3784 | Risk Ratio (M‐H, Random, 95% CI) | 0.63 [0.49, 0.82] |
| 16 Weight, change from baseline Show forest plot | 4 | 486 | Std. Mean Difference (IV, Fixed, 95% CI) | 0.31 [0.13, 0.49] |
| 17 Diarrhoeal episodes per patient‐month (by zinc administration) Show forest plot | 8 | 23912 | Risk Ratio (Fixed, 95% CI) | 1.15 [1.06, 1.26] |
| 17.1 Without zinc | 7 | 17566 | Risk Ratio (Fixed, 95% CI) | 0.99 [0.87, 1.13] |
| 17.2 With zinc | 3 | 6346 | Risk Ratio (Fixed, 95% CI) | 1.29 [1.15, 1.44] |
| 18 Infections per patient‐month Show forest plot | 8 | Risk Ratio (Fixed, 95% CI) | Subtotals only | |
| 18.1 Febrile episodes | 6 | 15531 | Risk Ratio (Fixed, 95% CI) | 1.03 [0.93, 1.14] |
| 18.2 Days with fever | 1 | 110 | Risk Ratio (Fixed, 95% CI) | 8.37 [1.91, 36.58] |
| 18.3 All disease episodes | 1 | 1395 | Risk Ratio (Fixed, 95% CI) | 1.15 [0.91, 1.46] |
| 19 Haemoglobin, change from baseline, end of treatment Show forest plot | 12 | 2462 | Mean Difference (IV, Random, 95% CI) | 0.67 [0.42, 0.92] |
| 20 URTI/pneumonia episodes per patient‐month Show forest plot | 6 | 21767 | Risk Ratio (Fixed, 95% CI) | 0.99 [0.85, 1.15] |
| 21 Height, end value Show forest plot | 5 | 2102 | Std. Mean Difference (IV, Fixed, 95% CI) | 0.01 [‐0.08, 0.10] |
| 22 Height, change from baseline Show forest plot | 4 | 486 | Std. Mean Difference (IV, Fixed, 95% CI) | 0.09 [‐0.09, 0.27] |
| Outcome or subgroup title | No. of studies | No. of participants | Statistical method | Effect size |
| 1 Severe malaria (malaria requiring admission) Show forest plot | 2 | Risk Ratio (Fixed, 95% CI) | Totals not selected | |
| 2 Severe malaria (cerebral malaria) Show forest plot | 2 | Risk Ratio (Fixed, 95% CI) | Totals not selected | |
| 3 All‐cause mortality Show forest plot | 5 | 18034 | Risk Difference (M‐H, Fixed, 95% CI) | 0.00 [‐0.00, 0.01] |
| 4 Any hospitalization Show forest plot | 1 | Risk Ratio (Fixed, 95% CI) | Subtotals only | |
| 5 Haemoglobin, end of treatment Show forest plot | 1 | 124 | Mean Difference (IV, Random, 95% CI) | 0.90 [0.51, 1.29] |
| 6 Anaemia, end of treatment Show forest plot | 3 | 633 | Risk Ratio (M‐H, Random, 95% CI) | 0.49 [0.25, 0.99] |
| 7 Weight, end value Show forest plot | 2 | 1080 | Std. Mean Difference (IV, Fixed, 95% CI) | ‐0.06 [‐0.18, 0.06] |
| 8 Height, end value Show forest plot | 2 | 1082 | Std. Mean Difference (IV, Fixed, 95% CI) | ‐0.00 [‐0.12, 0.12] |
| Outcome or subgroup title | No. of studies | No. of participants | Statistical method | Effect size |
| 1 Clinical malaria (grouped by presence of malaria prevention or management) Show forest plot | 16 | Risk Ratio (Fixed, 95% CI) | 0.97 [0.91, 1.03] | |
| 1.1 Services present | 11 | Risk Ratio (Fixed, 95% CI) | 0.91 [0.84, 0.97] | |
| 1.2 Services absent | 5 | Risk Ratio (Fixed, 95% CI) | 1.16 [1.02, 1.31] | |
| Outcome or subgroup title | No. of studies | No. of participants | Statistical method | Effect size |
| 1 Clinical malaria Show forest plot | 3 | 728 | Risk Ratio (M‐H, Fixed, 95% CI) | 0.54 [0.43, 0.67] |
| 2 All‐cause mortality Show forest plot | 3 | 728 | Risk Ratio (M‐H, Fixed, 95% CI) | 1.05 [0.52, 2.11] |
| 3 Hospitalizations and clinic visits Show forest plot | 2 | Risk Ratio (Fixed, 95% CI) | Subtotals only | |
| 3.1 Hospitalization, iron + antimalarial versus placebo | 2 | 5904 | Risk Ratio (Fixed, 95% CI) | 0.59 [0.48, 0.73] |
| 3.2 Clinic visit, iron + antimalarial versus placebo | 2 | 5904 | Risk Ratio (Fixed, 95% CI) | 0.88 [0.82, 0.95] |
| 4 Haemoglobin at end of treatment Show forest plot | 1 | Mean Difference (IV, Random, 95% CI) | Totals not selected | |
| 5 Anaemia Show forest plot | 3 | Risk Ratio (M‐H, Random, 95% CI) | Subtotals only | |
| 5.1 Iron + antimalarial versus placebo, end of treatment | 2 | 295 | Risk Ratio (M‐H, Random, 95% CI) | 0.44 [0.28, 0.70] |
| 5.2 Iron + antimalarial versus placebo, end of follow‐up | 1 | 420 | Risk Ratio (M‐H, Random, 95% CI) | 0.37 [0.26, 0.54] |