| Trial ID | Clinical definition | Laboratory definition | Malaria‐related outcomes reported | Time of assessment | Malaria prevention or management strategies | Malaria prevention or management |
| Adam 1997 (C) | Physician's diagnosis of malaria | Any parasitaemia (all malaria species, assumed most Plasmodium falciparum since trial conducted in same region as Gebreselassie 1996) | Clinical malaria; any parasitaemia; malaria necessitating hospitalization (used as severe malaria); parasite density (all N events/N individuals, unadjusted for clustering) | 3 months to end of treatment | Blood smears for malaria obtained before, during and after treatment. Children with clinical malaria referred to local hospital and treated | No |
| Ayoya 2009 | Fever > 37.5°C (axillary) | Any parasitaemia (P. falciparum) | Clinical malaria; clinical malaria with parasitaemia ≥ 5000/μL (used as severe malaria); parasite density | 3 months to end of treatment | Malaria screening was done at baseline for all children and repeated throughout the study in children who had fever. Children infected with P. falciparum also were treated with sulfadoxine‐pyrimethamine | Yes |
| Berger 2000 | Isolated fever | Parasite density > 3000 (P. falciparum, Plasmodium malariae and Plasmodium ovale assessed. Over 97% were P. falciparum) | Parasite index (%, used as parasitaemia); parasitaemia above 3000 /µL (used as severe malaria) and 10,000 / µL (%); parasite density | 3 months to end of treatment 9 months to end of follow‐up (FU) | Blood smears for malaria obtained at baseline, end of treatment (3 months) and end of FU (6 months). Chloroquine treatment given for all isolated fevers | Yes |
| Desai 2003 | Fever ≥37.5°C | Any parasitaemia (P. falciparum) with fever or parasitaemia > 5000/mm3 alone | Clinical malaria; any parasitaemia; hazard ratios for these; parasite density | 3 months to end of treatment | Blood smears at baseline and every 4 weeks. Oral quinine given for any fever with parasitaemia and cases of severe malaria referred for further treatment | Yes |
| Esan 2013 | No clinical definition | Any parasitaemia | All cause sick visits (including malaria), | 3 months to end of treatment 6 months to end of FU | Routine trimethoprim ‐ sulfamethoxazole prophylaxis | Yes |
| Fahmida 2007 | Not stated | Not stated | Participants with "malaria" (used primarily as clinical malaria) | 6 months to end of treatment | Not stated | No |
| Gebreselassie 1996 | Fever ≥ 37.5°C with signs and symptoms suggestive of malaria and other diagnoses ruled out | Presence of parasites in blood (all species, P. falciparum 88.9%) | Children with at least one episode of clinical malaria; cumulative incidence of parasitaemia; parasite density > 5000 µL (used as severe malaria); parasite density | 3 months to end of treatment 6 months to end of FU | Blood smears negative at baseline and repeated weekly. Chloroquine with or without primaquine given for any positive smear | Yes |
| Harvey 1989 | Fever and headache at the same time | Any parasitaemia (P. falciparum 67%, P. vivax 26.4%, P. malariae 6.6%) | First episodes of clinically suspected malaria (used primarily as clinical malaria); any parasitaemia | 4 months to end of treatment 6 months to end of FU | Blood smears for malaria obtained at 0, 6, 16, and 24 weeks. Chloroquine given for any illness reported as fever or headache, or both | Yes |
| Latham 1990 | Not assessed | Any positive smear (malaria species not stated) | Any positive smear; parasite density | 8 months to end of FU | Blood smears for malaria obtained at baseline and end of treatment. Treatment not stated | Yes |
| Lawless 1994 | Child's recall of clinical illness | Any positive blood smear (malaria species not stated) | Malaria is not defined (used as clinical malaria) | 3.5 months to end of treatment | No blood smears at baseline or during the trial (only at end of treatment). Treatment not stated | No |
| Leenstra 2009 | Fever ≥ 37.5°C | Positive blood smear (malaria species not stated) | Episodes of clinical malaria and RRs adjusted for school; episodes of malaria parasitaemia and parasitaemia > 500 parasites/mm3 (used as severe malaria) and RRs adjusted for school, age, and baseline parasitaemia | 5 months to end of treatment | Blood smears for malaria at baseline (1/4 of participants positive) and monthly during the trial. No treatment offered for positive smears; symptomatic cases referred to physician | Yes |
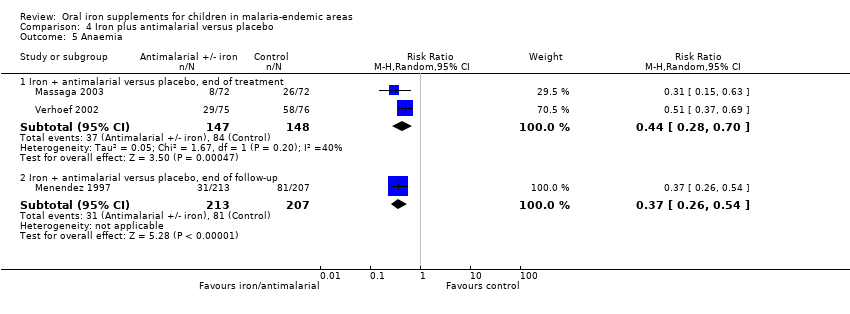
| Massaga 2003 | History of fever in the previous 24 to 72 hours or measured temperature of ≥ 37.5°C | Any level of parasitaemia (P. falciparum only) | Clinical malaria as first or only episode per participant (used as clinical malaria) and episodes of clinical malaria; episodes of clinical malaria associated with parasitaemia > 5000 parasites/μL (used as severe malaria) | 6 months to end of treatment | Blood smears for malaria at baseline and every 2 weeks. Sulfadoxine‐pyrimethamine treatment given for uncomplicated cases; complicated and severe malaria referred to the hospital | Yes |
| Mebrahtu 2004 (C) | Not assessed | Any positive smear (P. falciparum only) | Parasitaemia as OR (95% CI) adjusted for repeated measurements in each child | 12 months to end of treatment | Blood smears for malaria at baseline and end of treatment. In addition, monthly smears from a random sample (50% of randomized). Treatment not stated | Yes |
| Menendez 1997 | Fever ≥ 37.5°C | Parasitaemia of any density (P. falciparum only) | First or only episode of clinical malaria | 1 year (6 months after end of treatment) | Blood smears for malaria at baseline, week 8 and for any fever. Chloroquine treatment given for clinical malaria | Yes |
| Richard 2006 | Any fever within the previous 72 hours | P. falciparum (29%) or P. vivax (71%), any density | Episodes of falciparum or vivax malaria, or both (used primarily as clinical malaria) | 7 months to end of treatment | Blood smears for malaria at baseline and whenever febrile. Treatment given for all clinical cases | Yes |
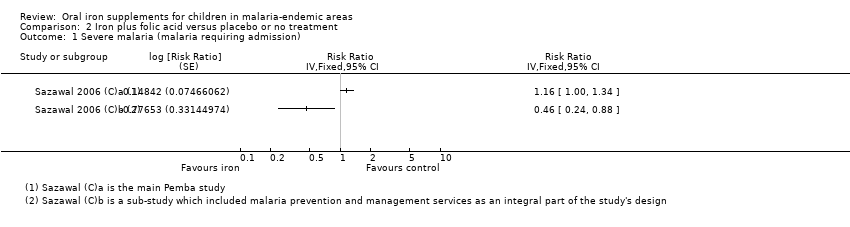
| Sazawal 2006 (C)a | Fever > 38°C and | Parasitaemia > 1000 or history of fever and parasitaemia > 3000 or parasitaemia > 10,000 parasites/mm3 regardless of fever (mostly P. falciparum) | Malaria‐related adverse events, defined as hospital admission or death due to malaria (used primarily as clinical malaria). RRs with 95% CI adjusted for multiple events per child and clustering; cerebral malaria (used as severe malaria) | Not fixed. End of treatment about 1 year and end of FU about 18 months | No baseline or routine surveillance for malaria during the trial. Treatment given only if admitted to the hospital and malaria diagnosed | No |
| Sazawal 2006 (C)b | Fever > 38°C | Parasitaemia > 1000 or history of fever and parasitaemia > 3000 or parasitaemia > 10,000 parasites/mm3 regardless of fever (mostly P. falciparum) | Malaria‐related adverse events, defined as hospital admission or death due to malaria (used primarily as clinical malaria). RRs with 95% CI adjusted for multiple events per child and clustering; cerebral malaria (used as severe malaria) | Not fixed. End of treatment about 1 year and end of FU about 18 months | Blood smear for malaria at baseline, and at 6 and 12 months. Sulfadoxine‐pyrimethamine treatment delivered to home to all slide‐confirmed malaria participants or clinical disease presenting during the study | Yes |
| Smith 1989 (C) | Fever > 37.5°C | > 500 parasites/mm3 (mostly P. falciparum) | Visits for clinical malaria; parasitaemia > 500/µL; fever with parasitaemia > 5000 parasites/mm3 (used as severe malaria (all N events/N individuals, unadjusted for clustering) | 3 months to end of treatment | Blood smear for malaria at baseline, 2 weeks and end of treatment. No treatment at baseline; clinical malaria referred to local healthcare services | No |
| Verhoef 2002 | Axillary temperature ≥ 37.5°C | Dipstick test for P. falciparum | Number of children with malaria infection (used primarily as clinical malaria) | 3 months to end of treatment | Dipstick for P. falciparum tested at baseline, 4, 8, and 12 weeks. Confirmed with blood smear if febrile and treated with sulfadoxine‐pyrimethamine, amodiaquine or halofantrine | Yes |
| Zlotkin 2013 (C) | Axillary temperature ≥ 37.5°C | Parasitaemia of any density (mostly P. falciparum) | Incidence of clinical malaria, malaria with parasite density > 5000/µL, cerebral malaria | 5 months to end of treatment 6 months to end of FU | Insecticide‐treated bed nets supplied with instructions for use. Children with malaria treated with artemisinin combination therapy | Yes |