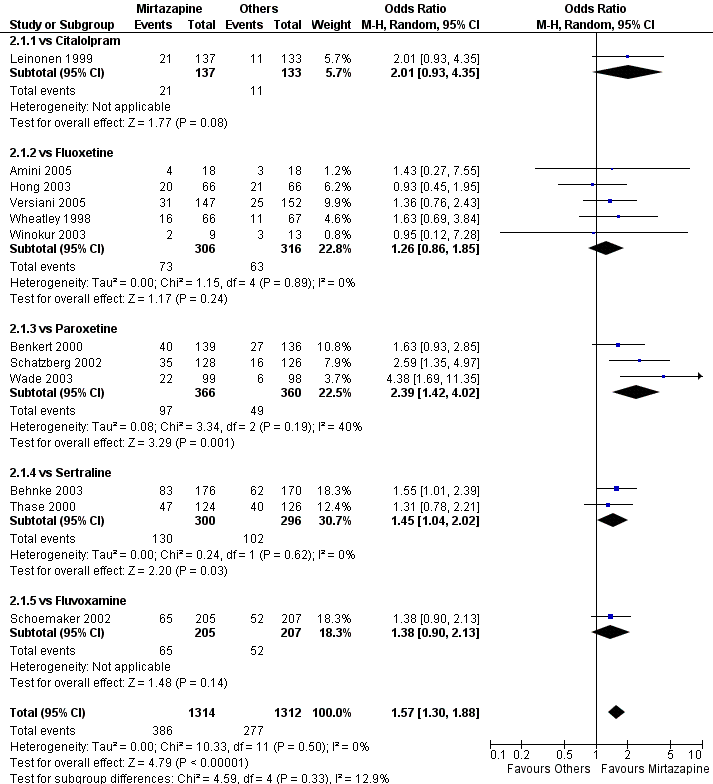
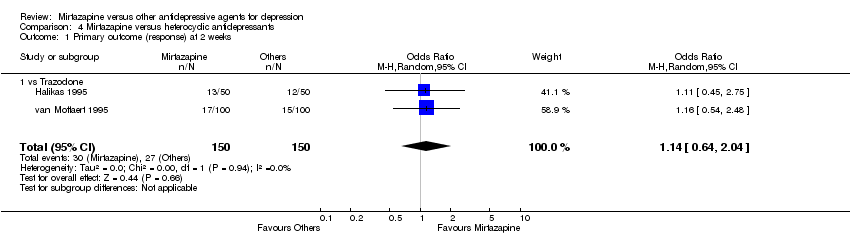
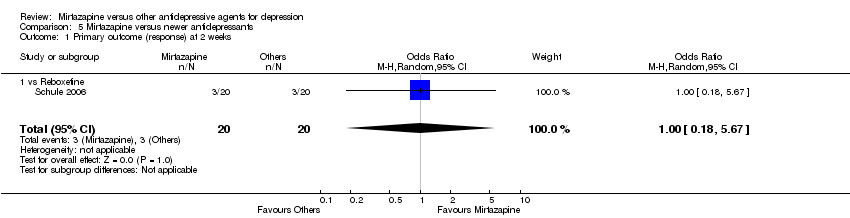
| 1 Primary outcome (response) at 2 weeks Show forest plot | 12 | 2626 | Odds Ratio (M‐H, Random, 95% CI) | 1.57 [1.30, 1.88] |
|
| 1.1 vs Citalolpram | 1 | 270 | Odds Ratio (M‐H, Random, 95% CI) | 2.01 [0.93, 4.35] |
| 1.2 vs Fluoxetine | 5 | 622 | Odds Ratio (M‐H, Random, 95% CI) | 1.26 [0.86, 1.85] |
| 1.3 vs Paroxetine | 3 | 726 | Odds Ratio (M‐H, Random, 95% CI) | 2.39 [1.42, 4.02] |
| 1.4 vs Sertraline | 2 | 596 | Odds Ratio (M‐H, Random, 95% CI) | 1.45 [1.04, 2.02] |
| 1.5 vs Fluvoxamine | 1 | 412 | Odds Ratio (M‐H, Random, 95% CI) | 1.38 [0.90, 2.13] |
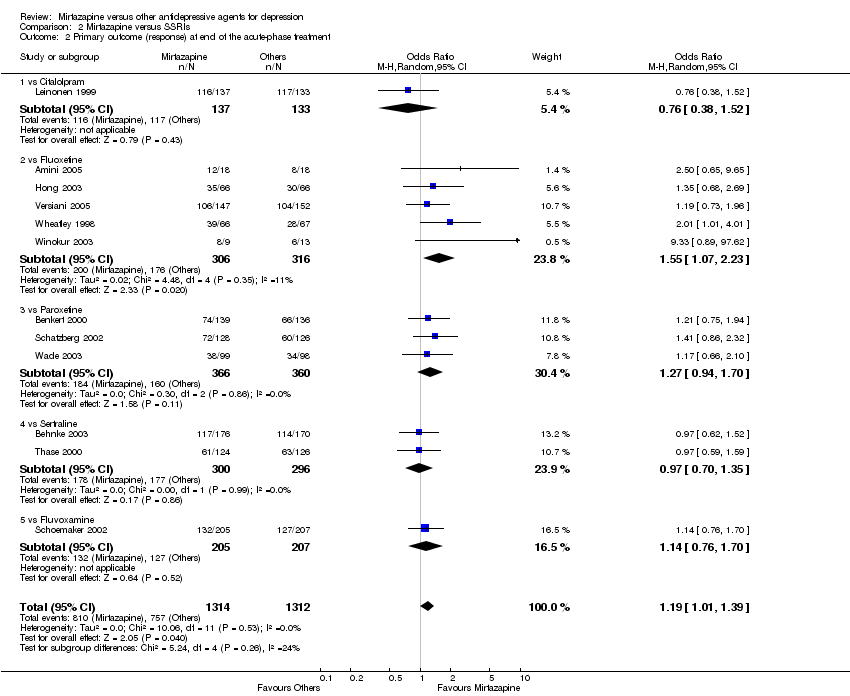
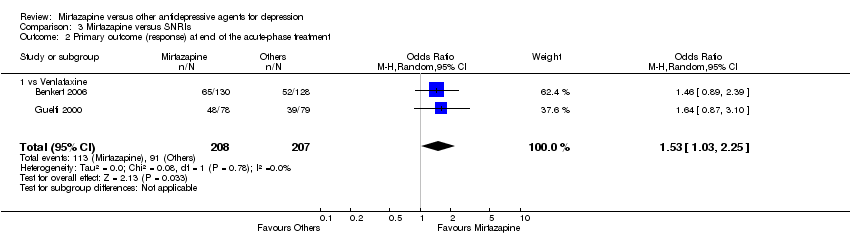
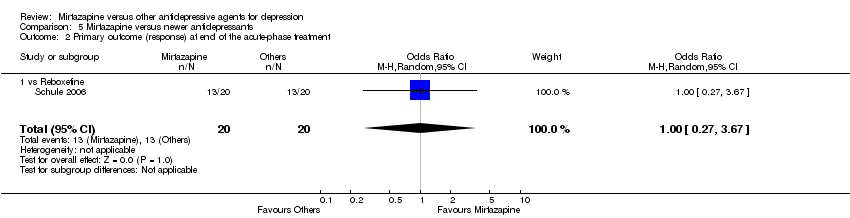
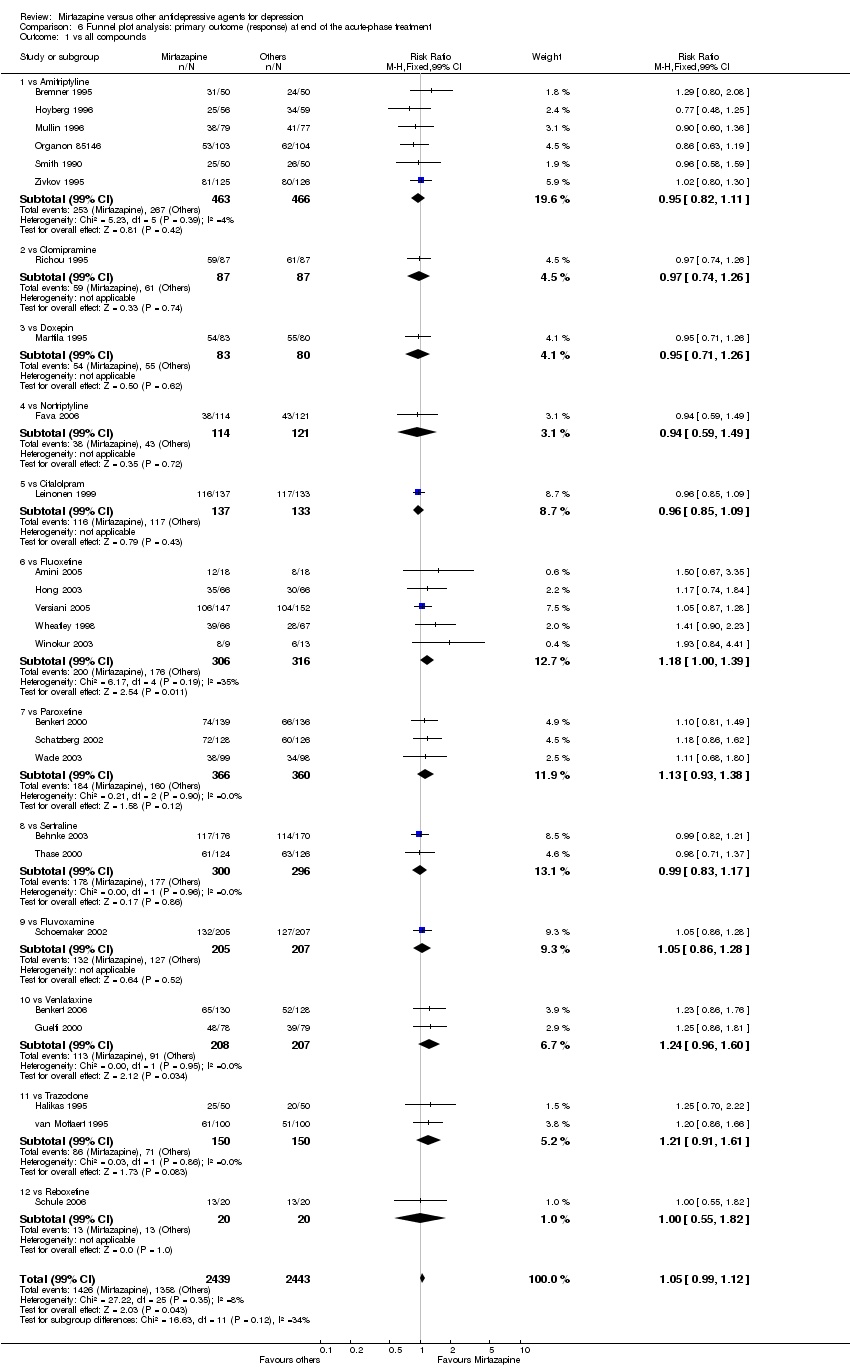
| 2 Primary outcome (response) at end of the acute‐phase treatment Show forest plot | 12 | 2626 | Odds Ratio (M‐H, Random, 95% CI) | 1.19 [1.01, 1.39] |
|
| 2.1 vs Citalolpram | 1 | 270 | Odds Ratio (M‐H, Random, 95% CI) | 0.76 [0.38, 1.52] |
| 2.2 vs Fluoxetine | 5 | 622 | Odds Ratio (M‐H, Random, 95% CI) | 1.55 [1.07, 2.23] |
| 2.3 vs Paroxetine | 3 | 726 | Odds Ratio (M‐H, Random, 95% CI) | 1.27 [0.94, 1.70] |
| 2.4 vs Sertraline | 2 | 596 | Odds Ratio (M‐H, Random, 95% CI) | 0.97 [0.70, 1.35] |
| 2.5 vs Fluvoxamine | 1 | 412 | Odds Ratio (M‐H, Random, 95% CI) | 1.14 [0.76, 1.70] |
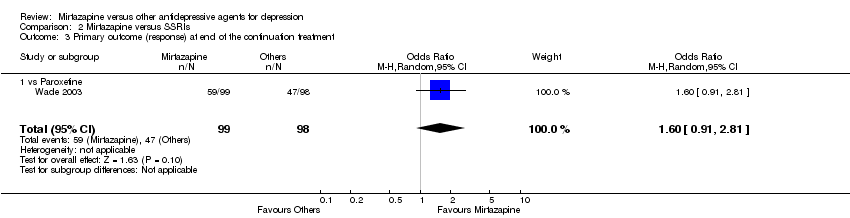
| 3 Primary outcome (response) at end of the continuation treatment Show forest plot | 1 | 197 | Odds Ratio (M‐H, Random, 95% CI) | 1.60 [0.91, 2.81] |
|
| 3.1 vs Paroxetine | 1 | 197 | Odds Ratio (M‐H, Random, 95% CI) | 1.60 [0.91, 2.81] |
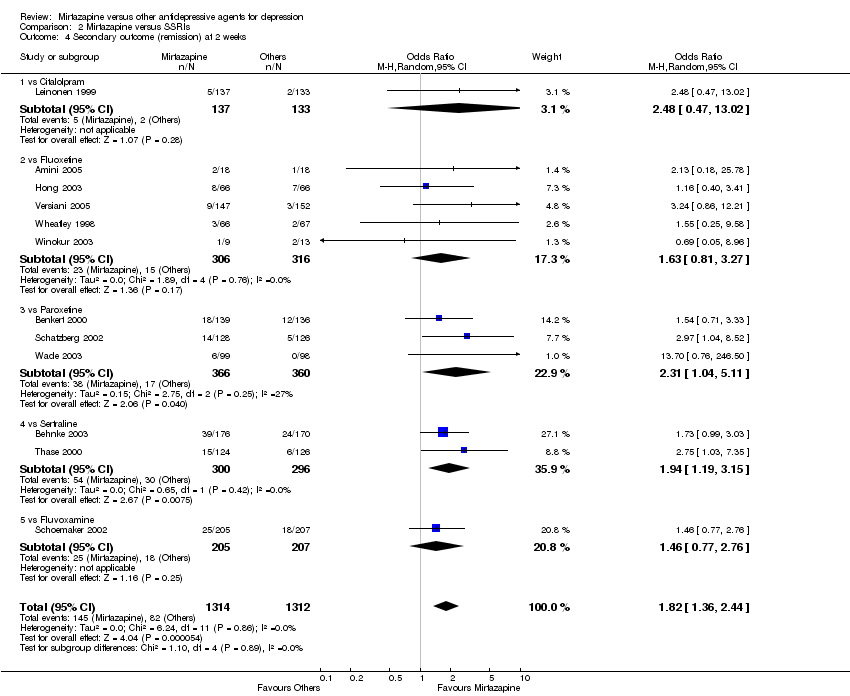
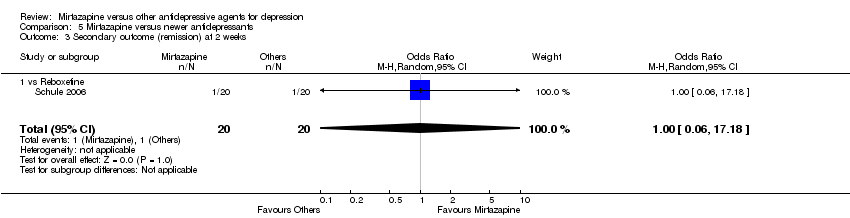
| 4 Secondary outcome (remission) at 2 weeks Show forest plot | 12 | 2626 | Odds Ratio (M‐H, Random, 95% CI) | 1.82 [1.36, 2.44] |
|
| 4.1 vs Citalolpram | 1 | 270 | Odds Ratio (M‐H, Random, 95% CI) | 2.48 [0.47, 13.02] |
| 4.2 vs Fluoxetine | 5 | 622 | Odds Ratio (M‐H, Random, 95% CI) | 1.63 [0.81, 3.27] |
| 4.3 vs Paroxetine | 3 | 726 | Odds Ratio (M‐H, Random, 95% CI) | 2.31 [1.04, 5.11] |
| 4.4 vs Sertraline | 2 | 596 | Odds Ratio (M‐H, Random, 95% CI) | 1.94 [1.19, 3.15] |
| 4.5 vs Fluvoxamine | 1 | 412 | Odds Ratio (M‐H, Random, 95% CI) | 1.46 [0.77, 2.76] |
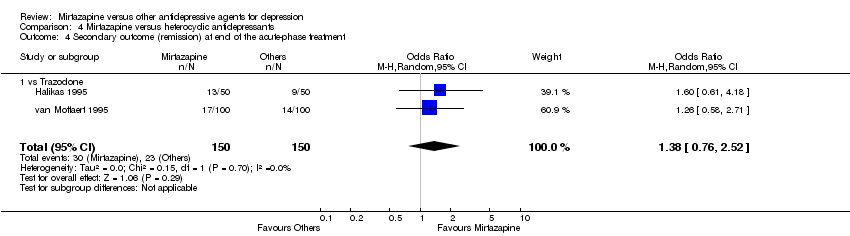
| 5 Secondary outcome (remission) at end of the acute‐phase treatment Show forest plot | 12 | 2626 | Odds Ratio (M‐H, Random, 95% CI) | 1.17 [0.98, 1.40] |
|
| 5.1 vs Citalolpram | 1 | 270 | Odds Ratio (M‐H, Random, 95% CI) | 0.92 [0.55, 1.52] |
| 5.2 vs Fluoxetine | 5 | 622 | Odds Ratio (M‐H, Random, 95% CI) | 1.12 [0.80, 1.57] |
| 5.3 vs Paroxetine | 3 | 726 | Odds Ratio (M‐H, Random, 95% CI) | 1.58 [1.16, 2.15] |
| 5.4 vs Sertraline | 2 | 596 | Odds Ratio (M‐H, Random, 95% CI) | 1.18 [0.82, 1.71] |
| 5.5 vs Fluvoxamine | 1 | 412 | Odds Ratio (M‐H, Random, 95% CI) | 0.84 [0.57, 1.23] |
| 6 Secondary outcome (remission) at end of the continuation treatment Show forest plot | 1 | 197 | Odds Ratio (M‐H, Random, 95% CI) | 1.89 [1.01, 3.54] |
|
| 6.1 vs Paroxetine | 1 | 197 | Odds Ratio (M‐H, Random, 95% CI) | 1.89 [1.01, 3.54] |
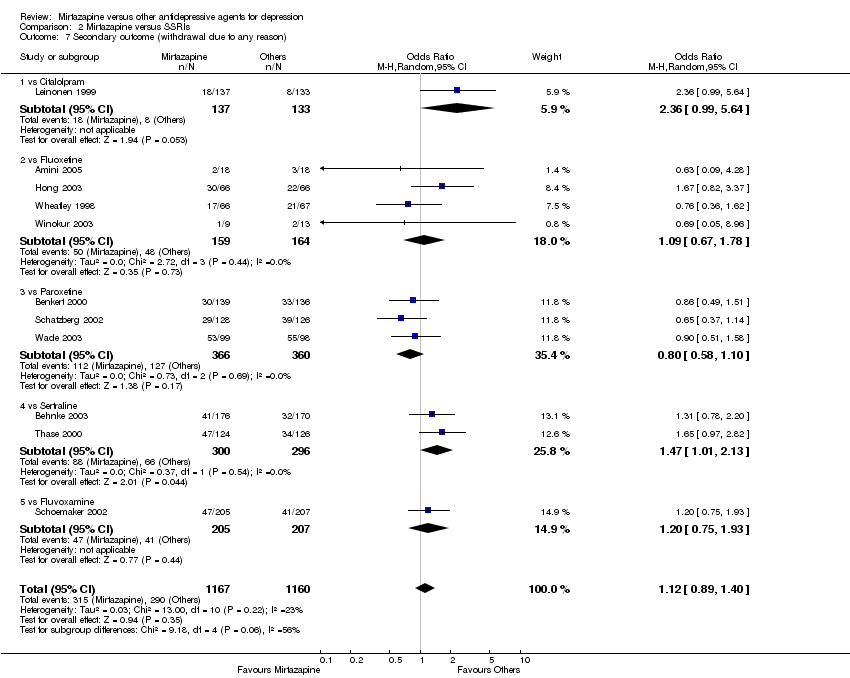
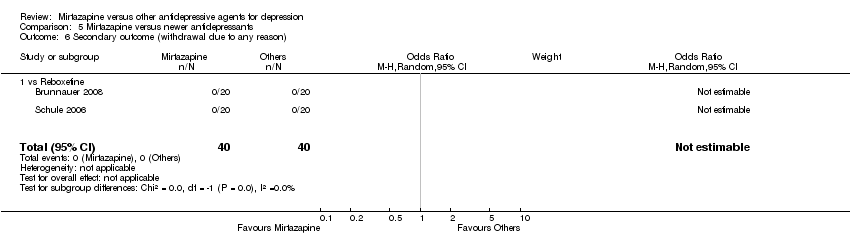
| 7 Secondary outcome (withdrawal due to any reason) Show forest plot | 11 | 2327 | Odds Ratio (M‐H, Random, 95% CI) | 1.12 [0.89, 1.40] |
|
| 7.1 vs Citalolpram | 1 | 270 | Odds Ratio (M‐H, Random, 95% CI) | 2.36 [0.99, 5.64] |
| 7.2 vs Fluoxetine | 4 | 323 | Odds Ratio (M‐H, Random, 95% CI) | 1.09 [0.67, 1.78] |
| 7.3 vs Paroxetine | 3 | 726 | Odds Ratio (M‐H, Random, 95% CI) | 0.80 [0.58, 1.10] |
| 7.4 vs Sertraline | 2 | 596 | Odds Ratio (M‐H, Random, 95% CI) | 1.47 [1.01, 2.13] |
| 7.5 vs Fluvoxamine | 1 | 412 | Odds Ratio (M‐H, Random, 95% CI) | 1.20 [0.75, 1.93] |
| 8 Secondary outcome (withdrawal due to adverse events) Show forest plot | 11 | 2604 | Odds Ratio (M‐H, Random, 95% CI) | 1.26 [0.85, 1.86] |
|
| 8.1 vs Citalolpram | 1 | 270 | Odds Ratio (M‐H, Random, 95% CI) | 2.0 [0.59, 6.81] |
| 8.2 vs Fluoxetine | 4 | 600 | Odds Ratio (M‐H, Random, 95% CI) | 1.05 [0.62, 1.78] |
| 8.3 vs Paroxetine | 3 | 726 | Odds Ratio (M‐H, Random, 95% CI) | 0.74 [0.45, 1.21] |
| 8.4 vs Sertraline | 2 | 596 | Odds Ratio (M‐H, Random, 95% CI) | 2.88 [1.43, 5.77] |
| 8.5 vs Fluvoxamine | 1 | 412 | Odds Ratio (M‐H, Random, 95% CI) | 1.66 [0.86, 3.21] |
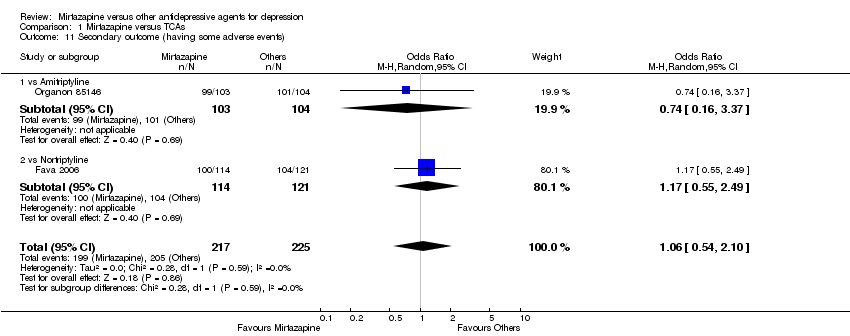
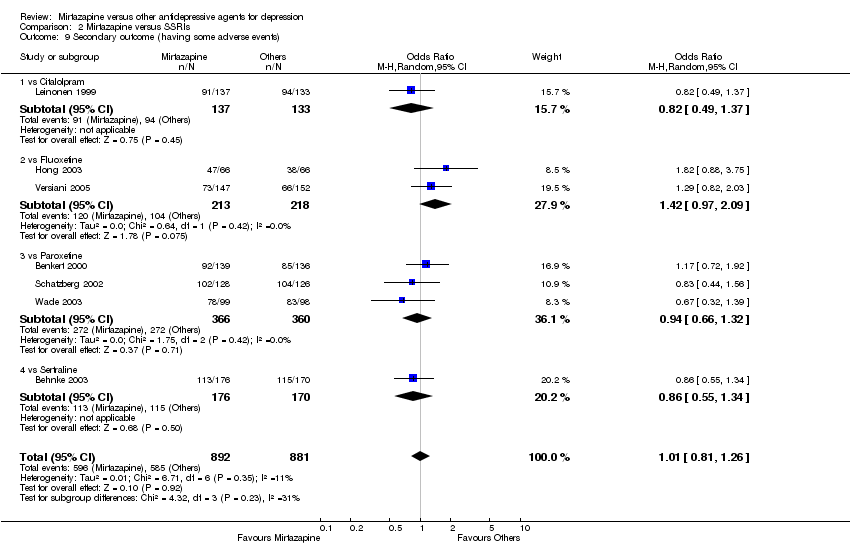
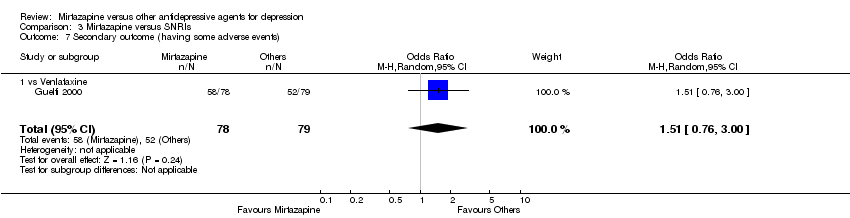
| 9 Secondary outcome (having some adverse events) Show forest plot | 7 | 1773 | Odds Ratio (M‐H, Random, 95% CI) | 1.01 [0.81, 1.26] |
|
| 9.1 vs Citalolpram | 1 | 270 | Odds Ratio (M‐H, Random, 95% CI) | 0.82 [0.49, 1.37] |
| 9.2 vs Fluoxetine | 2 | 431 | Odds Ratio (M‐H, Random, 95% CI) | 1.42 [0.97, 2.09] |
| 9.3 vs Paroxetine | 3 | 726 | Odds Ratio (M‐H, Random, 95% CI) | 0.94 [0.66, 1.32] |
| 9.4 vs Sertraline | 1 | 346 | Odds Ratio (M‐H, Random, 95% CI) | 0.86 [0.55, 1.34] |
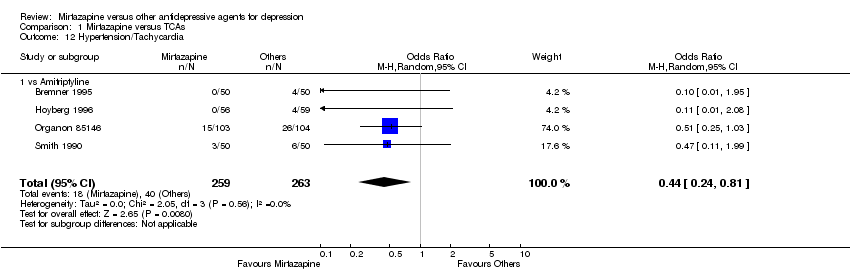
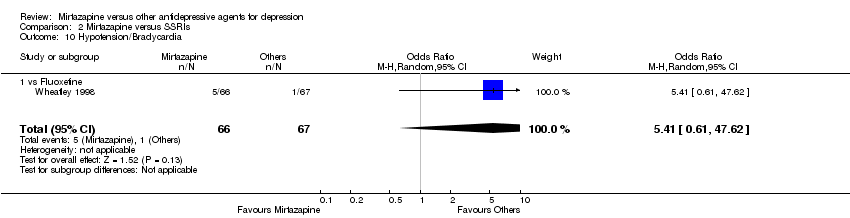
| 10 Hypotension/Bradycardia Show forest plot | 1 | 133 | Odds Ratio (M‐H, Random, 95% CI) | 5.41 [0.61, 47.62] |
|
| 10.1 vs Fluoxetine | 1 | 133 | Odds Ratio (M‐H, Random, 95% CI) | 5.41 [0.61, 47.62] |
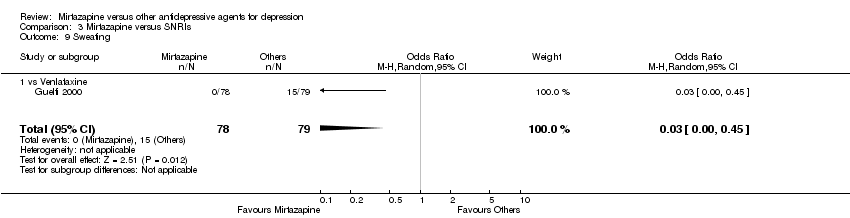
| 11 Sweating Show forest plot | 5 | 1342 | Odds Ratio (M‐H, Random, 95% CI) | 0.25 [0.15, 0.44] |
|
| 11.1 vs Citalolpram | 1 | 270 | Odds Ratio (M‐H, Random, 95% CI) | 0.13 [0.04, 0.44] |
| 11.2 vs Paroxetine | 3 | 726 | Odds Ratio (M‐H, Random, 95% CI) | 0.32 [0.17, 0.62] |
| 11.3 vs Sertraline | 1 | 346 | Odds Ratio (M‐H, Random, 95% CI) | 0.21 [0.04, 0.97] |
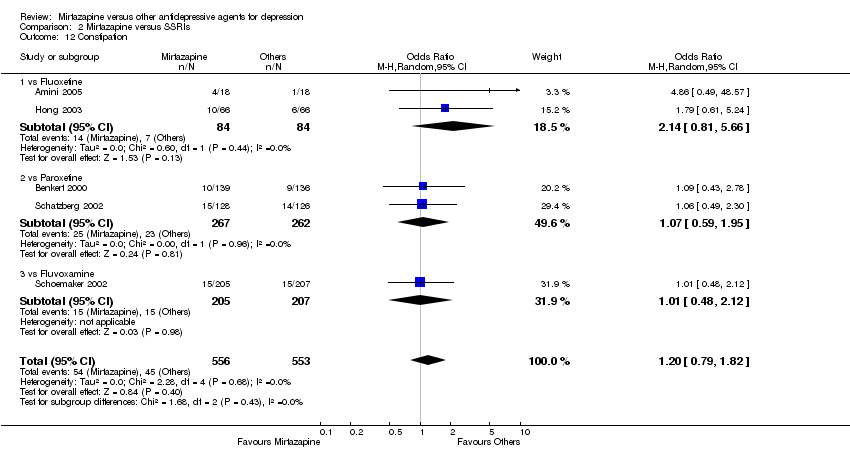
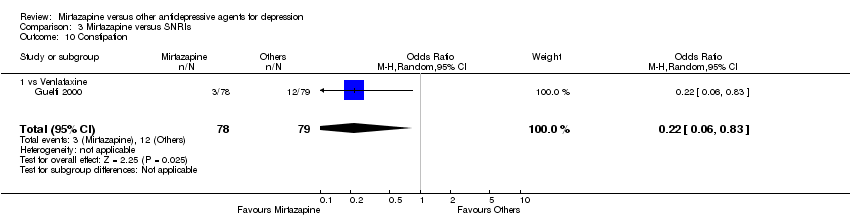
| 12 Constipation Show forest plot | 5 | 1109 | Odds Ratio (M‐H, Random, 95% CI) | 1.20 [0.79, 1.82] |
|
| 12.1 vs Fluoxetine | 2 | 168 | Odds Ratio (M‐H, Random, 95% CI) | 2.14 [0.81, 5.66] |
| 12.2 vs Paroxetine | 2 | 529 | Odds Ratio (M‐H, Random, 95% CI) | 1.07 [0.59, 1.95] |
| 12.3 vs Fluvoxamine | 1 | 412 | Odds Ratio (M‐H, Random, 95% CI) | 1.01 [0.48, 2.12] |
| 13 Diarrhoea Show forest plot | 8 | 2040 | Odds Ratio (M‐H, Random, 95% CI) | 0.57 [0.41, 0.80] |
|
| 13.1 vs Citalolpram | 1 | 270 | Odds Ratio (M‐H, Random, 95% CI) | 0.47 [0.14, 1.60] |
| 13.2 vs Fluoxetine | 1 | 36 | Odds Ratio (M‐H, Random, 95% CI) | 1.0 [0.06, 17.33] |
| 13.3 vs Paroxetine | 3 | 726 | Odds Ratio (M‐H, Random, 95% CI) | 0.89 [0.55, 1.46] |
| 13.4 vs Sertraline | 2 | 596 | Odds Ratio (M‐H, Random, 95% CI) | 0.37 [0.21, 0.67] |
| 13.5 vs Fluvoxamine | 1 | 412 | Odds Ratio (M‐H, Random, 95% CI) | 0.34 [0.13, 0.87] |
| 14 Dry mouth/Decreased salivation Show forest plot | 10 | 2305 | Odds Ratio (M‐H, Random, 95% CI) | 1.80 [1.37, 2.36] |
|
| 14.1 vs Citalolpram | 1 | 270 | Odds Ratio (M‐H, Random, 95% CI) | 1.72 [0.81, 3.68] |
| 14.2 vs Fluoxetine | 3 | 301 | Odds Ratio (M‐H, Random, 95% CI) | 3.68 [1.52, 8.91] |
| 14.3 vs Paroxetine | 3 | 726 | Odds Ratio (M‐H, Random, 95% CI) | 1.73 [0.81, 3.70] |
| 14.4 vs Sertraline | 2 | 596 | Odds Ratio (M‐H, Random, 95% CI) | 1.53 [0.92, 2.55] |
| 14.5 vs Fluvoxamine | 1 | 412 | Odds Ratio (M‐H, Random, 95% CI) | 1.48 [0.77, 2.85] |
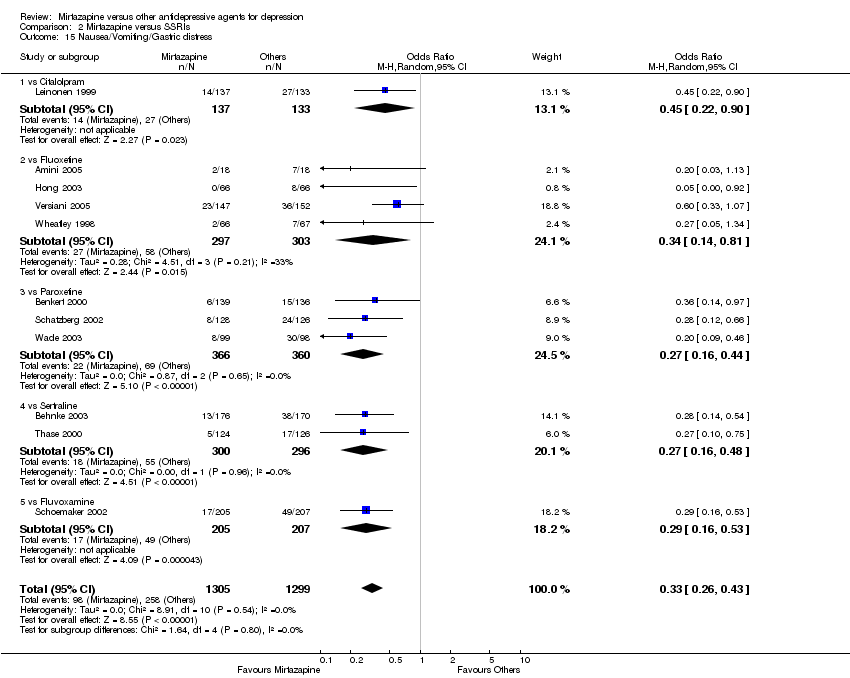
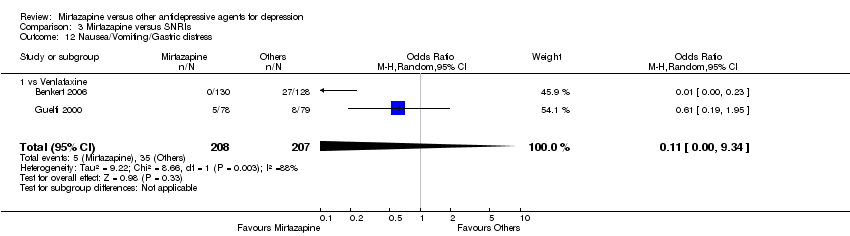
| 15 Nausea/Vomiting/Gastric distress Show forest plot | 11 | 2604 | Odds Ratio (M‐H, Random, 95% CI) | 0.33 [0.26, 0.43] |
|
| 15.1 vs Citalolpram | 1 | 270 | Odds Ratio (M‐H, Random, 95% CI) | 0.45 [0.22, 0.90] |
| 15.2 vs Fluoxetine | 4 | 600 | Odds Ratio (M‐H, Random, 95% CI) | 0.34 [0.14, 0.81] |
| 15.3 vs Paroxetine | 3 | 726 | Odds Ratio (M‐H, Random, 95% CI) | 0.27 [0.16, 0.44] |
| 15.4 vs Sertraline | 2 | 596 | Odds Ratio (M‐H, Random, 95% CI) | 0.27 [0.16, 0.48] |
| 15.5 vs Fluvoxamine | 1 | 412 | Odds Ratio (M‐H, Random, 95% CI) | 0.29 [0.16, 0.53] |
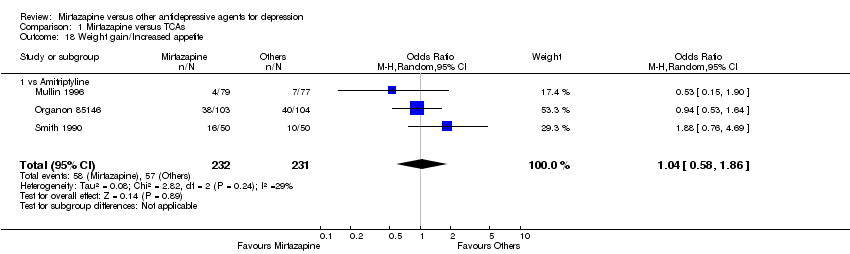
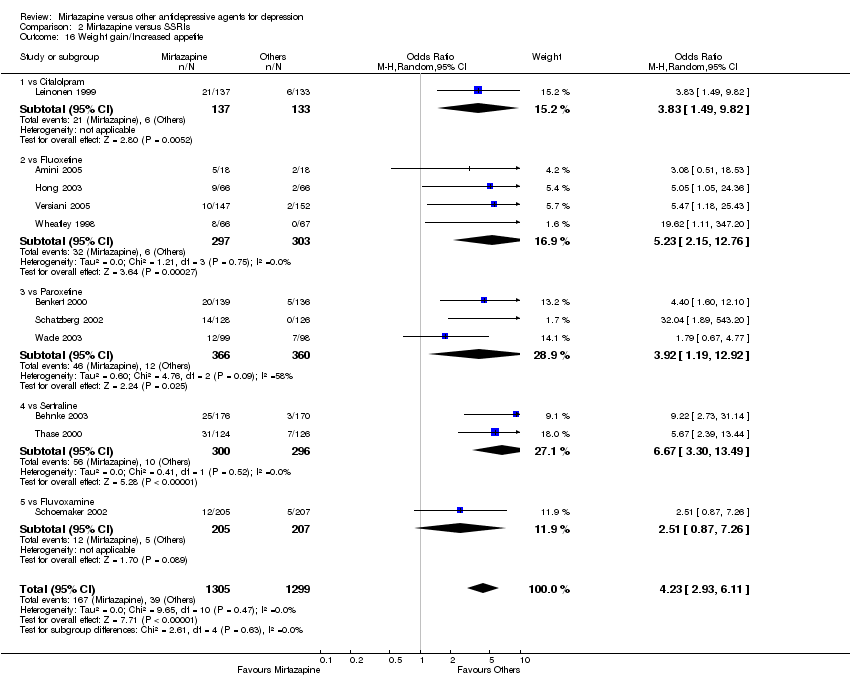
| 16 Weight gain/Increased appetite Show forest plot | 11 | 2604 | Odds Ratio (M‐H, Random, 95% CI) | 4.23 [2.93, 6.11] |
|
| 16.1 vs Citalolpram | 1 | 270 | Odds Ratio (M‐H, Random, 95% CI) | 3.83 [1.49, 9.82] |
| 16.2 vs Fluoxetine | 4 | 600 | Odds Ratio (M‐H, Random, 95% CI) | 5.23 [2.15, 12.76] |
| 16.3 vs Paroxetine | 3 | 726 | Odds Ratio (M‐H, Random, 95% CI) | 3.92 [1.19, 12.92] |
| 16.4 vs Sertraline | 2 | 596 | Odds Ratio (M‐H, Random, 95% CI) | 6.67 [3.30, 13.49] |
| 16.5 vs Fluvoxamine | 1 | 412 | Odds Ratio (M‐H, Random, 95% CI) | 2.51 [0.87, 7.26] |
| 17 Weight loss/Anorexia Show forest plot | 4 | 576 | Odds Ratio (M‐H, Random, 95% CI) | 0.35 [0.10, 1.18] |
|
| 17.1 vs Fluoxetine | 3 | 301 | Odds Ratio (M‐H, Random, 95% CI) | 0.42 [0.11, 1.62] |
| 17.2 vs Paroxetine | 1 | 275 | Odds Ratio (M‐H, Random, 95% CI) | 0.14 [0.01, 2.67] |
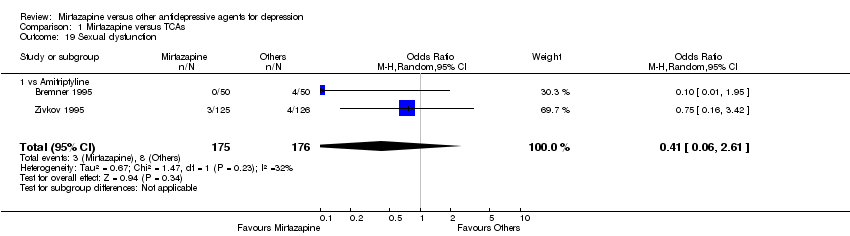
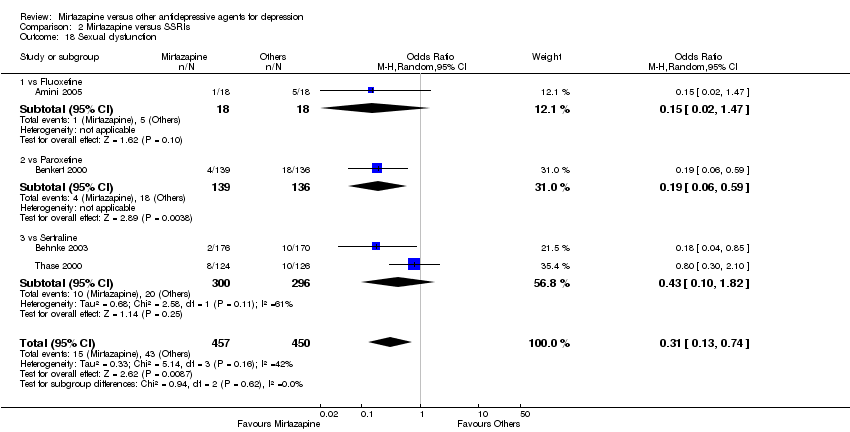
| 18 Sexual dysfunction Show forest plot | 4 | 907 | Odds Ratio (M‐H, Random, 95% CI) | 0.31 [0.13, 0.74] |
|
| 18.1 vs Fluoxetine | 1 | 36 | Odds Ratio (M‐H, Random, 95% CI) | 0.15 [0.02, 1.47] |
| 18.2 vs Paroxetine | 1 | 275 | Odds Ratio (M‐H, Random, 95% CI) | 0.19 [0.06, 0.59] |
| 18.3 vs Sertraline | 2 | 596 | Odds Ratio (M‐H, Random, 95% CI) | 0.43 [0.10, 1.82] |
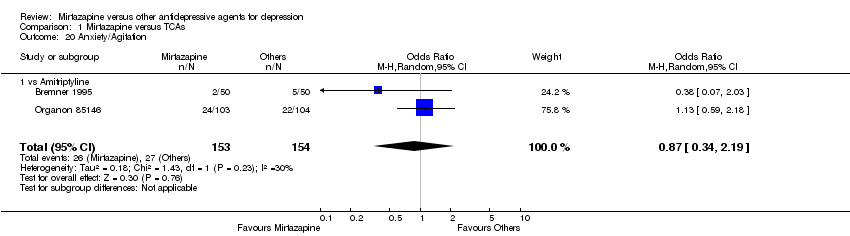
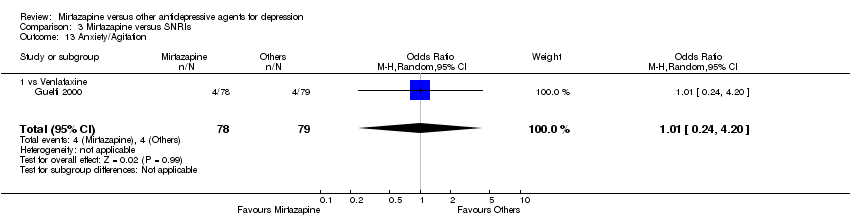
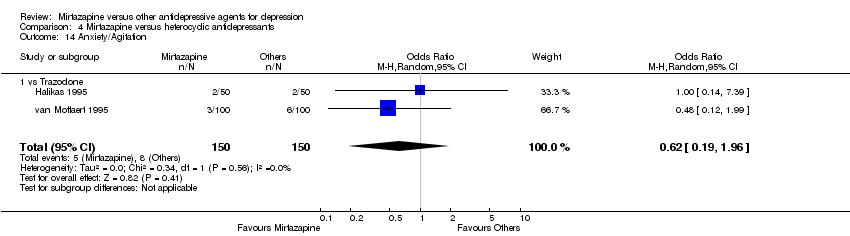
| 19 Anxiety/Agitation Show forest plot | 4 | 1134 | Odds Ratio (M‐H, Random, 95% CI) | 1.46 [0.59, 3.65] |
|
| 19.1 vs Paroxetine | 2 | 472 | Odds Ratio (M‐H, Random, 95% CI) | 0.71 [0.32, 1.60] |
| 19.2 vs Sertraline | 1 | 250 | Odds Ratio (M‐H, Random, 95% CI) | 1.65 [0.69, 3.98] |
| 19.3 vs Fluvoxamine | 1 | 412 | Odds Ratio (M‐H, Random, 95% CI) | 5.76 [1.65, 20.07] |
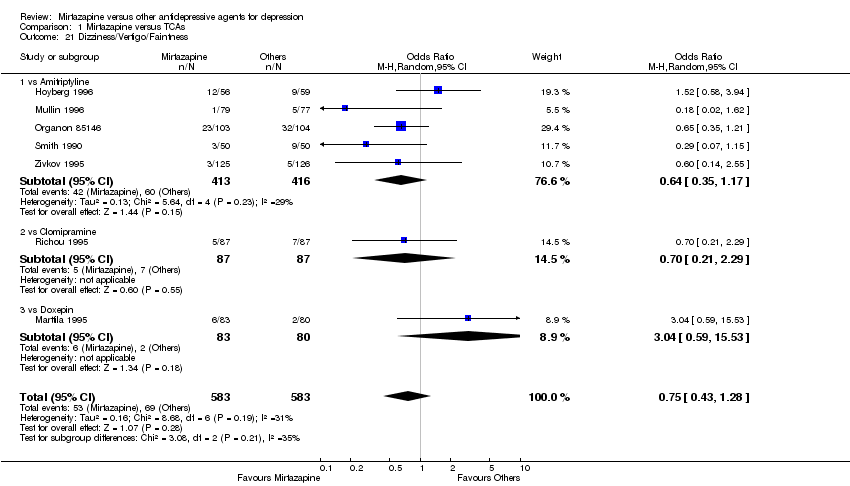
| 20 Dizziness/Vertigo/Faintness Show forest plot | 10 | 2568 | Odds Ratio (M‐H, Random, 95% CI) | 1.04 [0.77, 1.41] |
|
| 20.1 vs Citalolpram | 1 | 270 | Odds Ratio (M‐H, Random, 95% CI) | 2.03 [0.74, 5.58] |
| 20.2 vs Fluoxetine | 3 | 564 | Odds Ratio (M‐H, Random, 95% CI) | 0.92 [0.54, 1.56] |
| 20.3 vs Paroxetine | 3 | 726 | Odds Ratio (M‐H, Random, 95% CI) | 0.84 [0.47, 1.50] |
| 20.4 vs Sertraline | 2 | 596 | Odds Ratio (M‐H, Random, 95% CI) | 1.16 [0.36, 3.70] |
| 20.5 vs Fluvoxamine | 1 | 412 | Odds Ratio (M‐H, Random, 95% CI) | 1.31 [0.69, 2.48] |
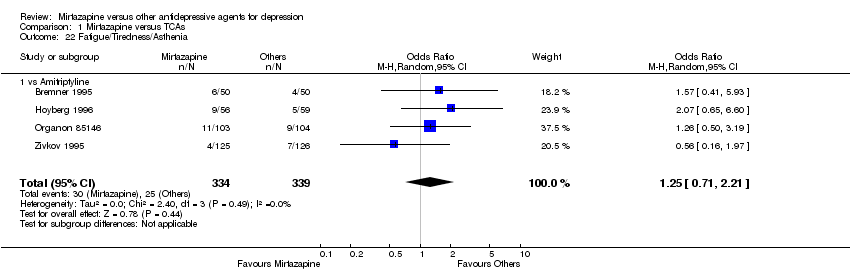
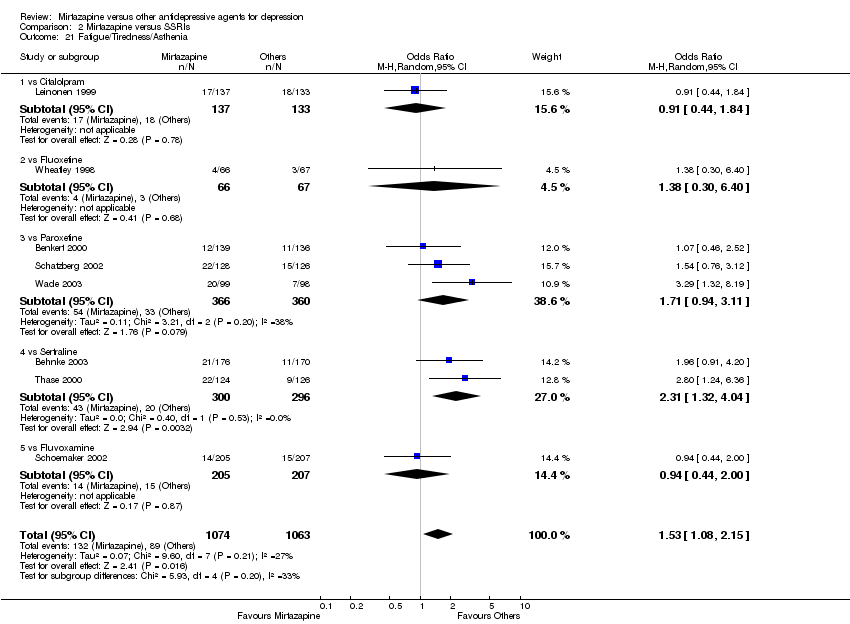
| 21 Fatigue/Tiredness/Asthenia Show forest plot | 8 | 2137 | Odds Ratio (M‐H, Random, 95% CI) | 1.53 [1.08, 2.15] |
|
| 21.1 vs Citalolpram | 1 | 270 | Odds Ratio (M‐H, Random, 95% CI) | 0.91 [0.44, 1.84] |
| 21.2 vs Fluoxetine | 1 | 133 | Odds Ratio (M‐H, Random, 95% CI) | 1.38 [0.30, 6.40] |
| 21.3 vs Paroxetine | 3 | 726 | Odds Ratio (M‐H, Random, 95% CI) | 1.71 [0.94, 3.11] |
| 21.4 vs Sertraline | 2 | 596 | Odds Ratio (M‐H, Random, 95% CI) | 2.31 [1.32, 4.04] |
| 21.5 vs Fluvoxamine | 1 | 412 | Odds Ratio (M‐H, Random, 95% CI) | 0.94 [0.44, 2.00] |
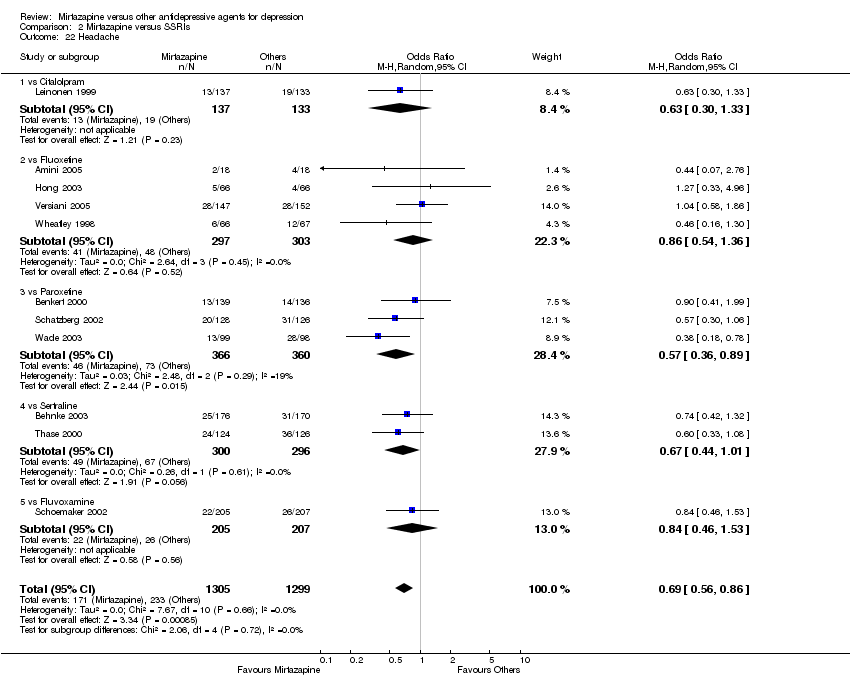
| 22 Headache Show forest plot | 11 | 2604 | Odds Ratio (M‐H, Random, 95% CI) | 0.69 [0.56, 0.86] |
|
| 22.1 vs Citalolpram | 1 | 270 | Odds Ratio (M‐H, Random, 95% CI) | 0.63 [0.30, 1.33] |
| 22.2 vs Fluoxetine | 4 | 600 | Odds Ratio (M‐H, Random, 95% CI) | 0.86 [0.54, 1.36] |
| 22.3 vs Paroxetine | 3 | 726 | Odds Ratio (M‐H, Random, 95% CI) | 0.57 [0.36, 0.89] |
| 22.4 vs Sertraline | 2 | 596 | Odds Ratio (M‐H, Random, 95% CI) | 0.67 [0.44, 1.01] |
| 22.5 vs Fluvoxamine | 1 | 412 | Odds Ratio (M‐H, Random, 95% CI) | 0.84 [0.46, 1.53] |
| 23 Tremor Show forest plot | 5 | 996 | Odds Ratio (M‐H, Random, 95% CI) | 0.34 [0.18, 0.66] |
|
| 23.1 vs Fluoxetine | 3 | 467 | Odds Ratio (M‐H, Random, 95% CI) | 0.42 [0.17, 1.07] |
| 23.2 vs Paroxetine | 2 | 529 | Odds Ratio (M‐H, Random, 95% CI) | 0.27 [0.11, 0.70] |
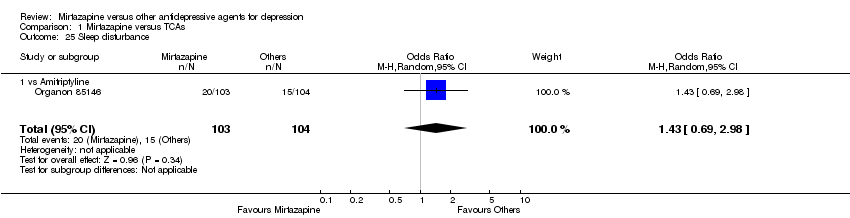
| 24 Sleep disturbance Show forest plot | 5 | 1346 | Odds Ratio (M‐H, Random, 95% CI) | 0.52 [0.31, 0.86] |
|
| 24.1 vs Fluoxetine | 1 | 299 | Odds Ratio (M‐H, Random, 95% CI) | 0.53 [0.21, 1.38] |
| 24.2 vs Paroxetine | 2 | 451 | Odds Ratio (M‐H, Random, 95% CI) | 0.68 [0.25, 1.85] |
| 24.3 vs Sertraline | 2 | 596 | Odds Ratio (M‐H, Random, 95% CI) | 0.37 [0.16, 0.85] |
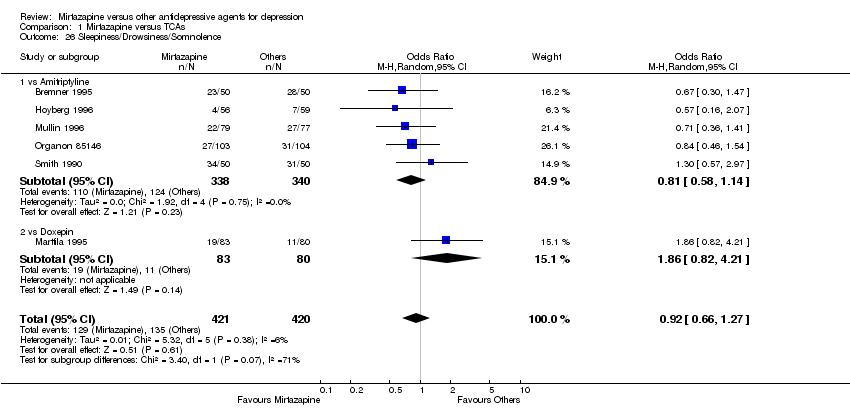
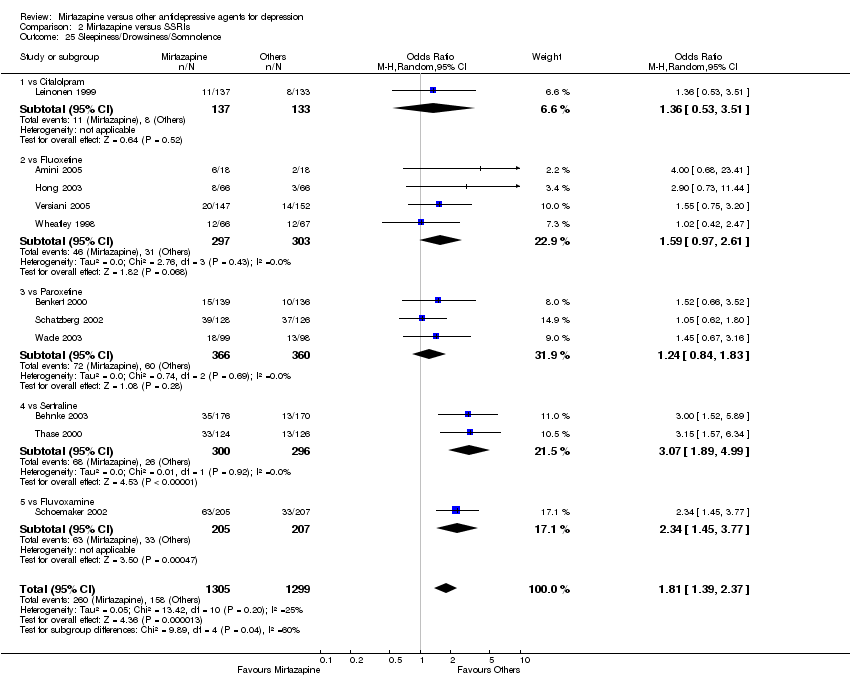
| 25 Sleepiness/Drowsiness/Somnolence Show forest plot | 11 | 2604 | Odds Ratio (M‐H, Random, 95% CI) | 1.81 [1.39, 2.37] |
|
| 25.1 vs Citalolpram | 1 | 270 | Odds Ratio (M‐H, Random, 95% CI) | 1.36 [0.53, 3.51] |
| 25.2 vs Fluoxetine | 4 | 600 | Odds Ratio (M‐H, Random, 95% CI) | 1.59 [0.97, 2.61] |
| 25.3 vs Paroxetine | 3 | 726 | Odds Ratio (M‐H, Random, 95% CI) | 1.24 [0.84, 1.83] |
| 25.4 vs Sertraline | 2 | 596 | Odds Ratio (M‐H, Random, 95% CI) | 3.07 [1.89, 4.99] |
| 25.5 vs Fluvoxamine | 1 | 412 | Odds Ratio (M‐H, Random, 95% CI) | 2.34 [1.45, 3.77] |
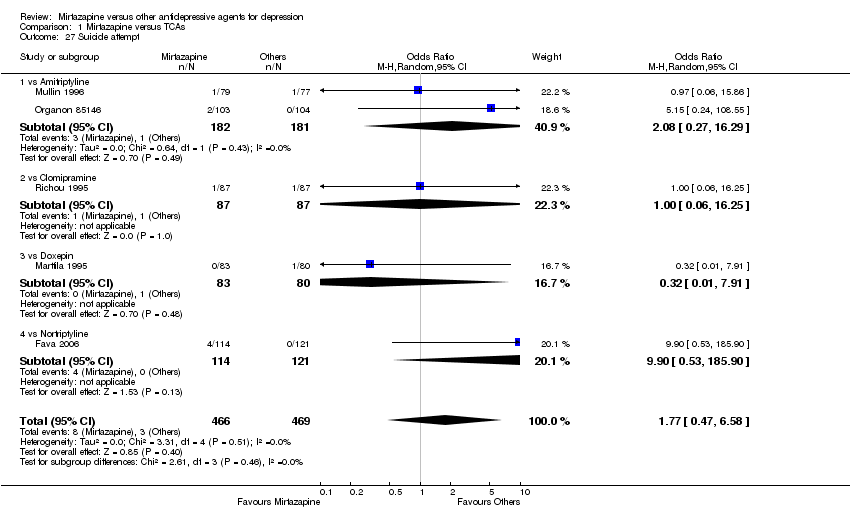
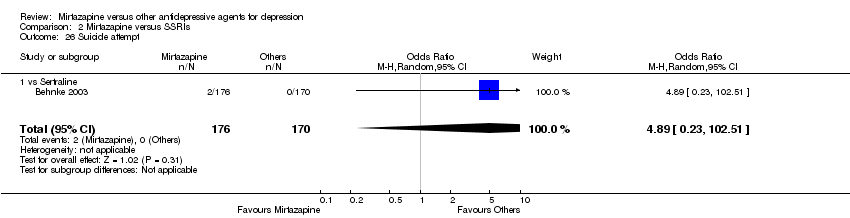
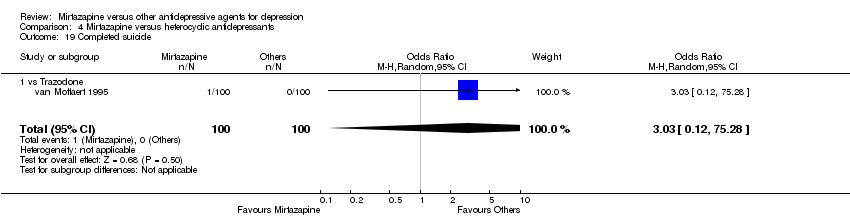
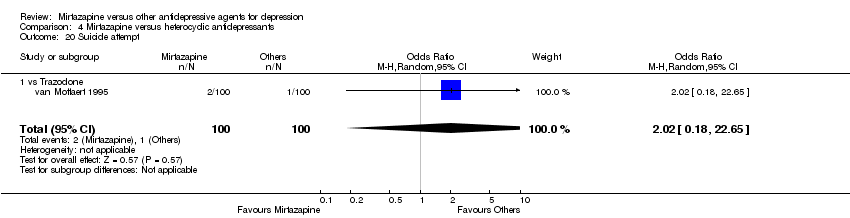
| 26 Suicide attempt Show forest plot | 1 | 346 | Odds Ratio (M‐H, Random, 95% CI) | 4.89 [0.23, 102.51] |
|
| 26.1 vs Sertraline | 1 | 346 | Odds Ratio (M‐H, Random, 95% CI) | 4.89 [0.23, 102.51] |
| 27 Subgroup analysis: Response at 2 weeks: Treatment settings: Outpatients in primary care Show forest plot | 1 | 197 | Odds Ratio (M‐H, Random, 95% CI) | 4.38 [1.69, 11.35] |
|
| 27.1 vs Paroxetine | 1 | 197 | Odds Ratio (M‐H, Random, 95% CI) | 4.38 [1.69, 11.35] |
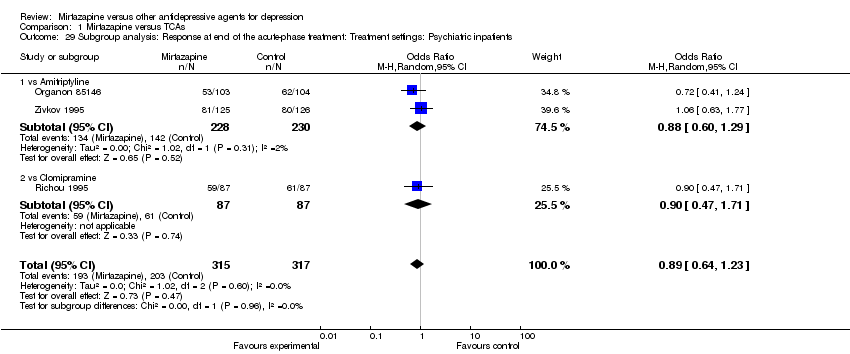
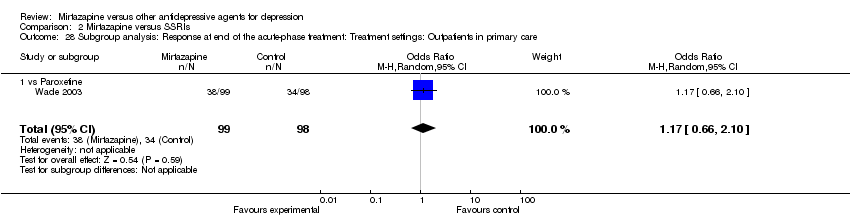
| 28 Subgroup analysis: Response at end of the acute‐phase treatment: Treatment settings: Outpatients in primary care Show forest plot | 1 | 197 | Odds Ratio (M‐H, Random, 95% CI) | 1.17 [0.66, 2.10] |
|
| 28.1 vs Paroxetine | 1 | 197 | Odds Ratio (M‐H, Random, 95% CI) | 1.17 [0.66, 2.10] |
| 29 Sensitivity analysis: Response at 2 weeks: Studies without imputation Show forest plot | 11 | 2604 | Odds Ratio (M‐H, Random, 95% CI) | 1.58 [1.31, 1.90] |
|
| 29.1 vs Citalolpram | 1 | 270 | Odds Ratio (M‐H, Random, 95% CI) | 2.01 [0.93, 4.35] |
| 29.2 vs Fluoxetine | 4 | 600 | Odds Ratio (M‐H, Random, 95% CI) | 1.27 [0.86, 1.88] |
| 29.3 vs Paroxetine | 3 | 726 | Odds Ratio (M‐H, Random, 95% CI) | 2.39 [1.42, 4.02] |
| 29.4 vs Sertraline | 2 | 596 | Odds Ratio (M‐H, Random, 95% CI) | 1.45 [1.04, 2.02] |
| 29.5 vs Fluvoxamine | 1 | 412 | Odds Ratio (M‐H, Random, 95% CI) | 1.38 [0.90, 2.13] |
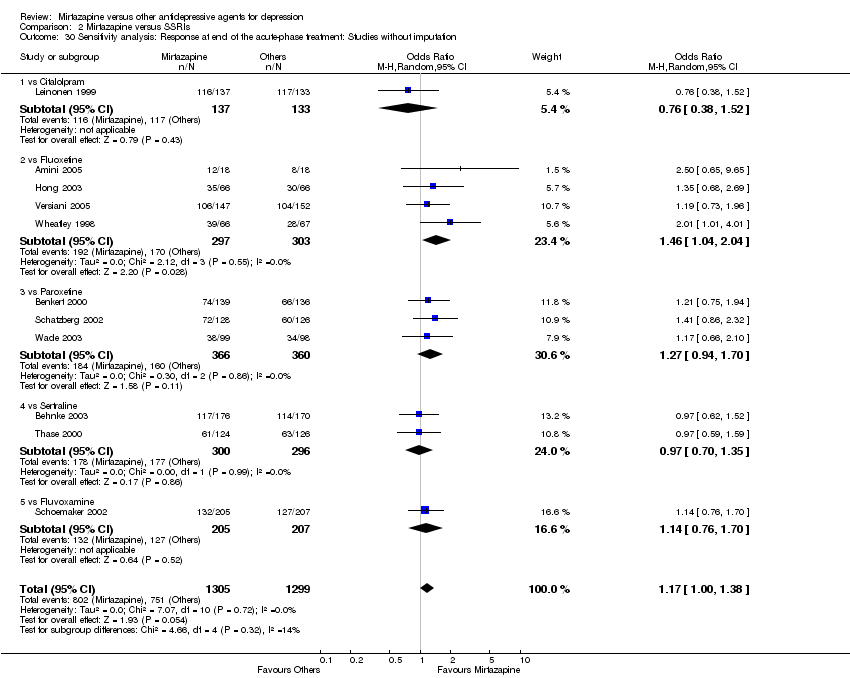
| 30 Sensitivity analysis: Response at end of the acute‐phase treatment: Studies without imputation Show forest plot | 11 | 2604 | Odds Ratio (M‐H, Random, 95% CI) | 1.17 [1.00, 1.38] |
|
| 30.1 vs Citalolpram | 1 | 270 | Odds Ratio (M‐H, Random, 95% CI) | 0.76 [0.38, 1.52] |
| 30.2 vs Fluoxetine | 4 | 600 | Odds Ratio (M‐H, Random, 95% CI) | 1.46 [1.04, 2.04] |
| 30.3 vs Paroxetine | 3 | 726 | Odds Ratio (M‐H, Random, 95% CI) | 1.27 [0.94, 1.70] |
| 30.4 vs Sertraline | 2 | 596 | Odds Ratio (M‐H, Random, 95% CI) | 0.97 [0.70, 1.35] |
| 30.5 vs Fluvoxamine | 1 | 412 | Odds Ratio (M‐H, Random, 95% CI) | 1.14 [0.76, 1.70] |
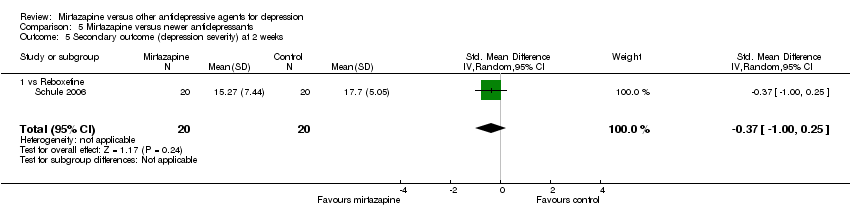
| 31 Secondary outcome (SKEWED DATA: depression severity) at 2 weeks Show forest plot | | | Other data | No numeric data |
|
| 32 Secondary outcome (SKEWED DATA: depression severity) at end of the acute‐phase treatment Show forest plot | | | Other data | No numeric data |
|