Mirtazapina versus otros agentes antidepresivos para la depresión
Referencias
Referencias de los estudios incluidos en esta revisión
Referencias de los estudios excluidos de esta revisión
Referencias de los estudios en espera de evaluación
Referencias adicionales
Referencias de otras versiones publicadas de esta revisión
Characteristics of studies
Characteristics of included studies [ordered by study ID]
Ir a:
| Methods | 6 week randomised double blind study | |
| Participants | Diagnosis: DSM‐IV major depressive disorder Setting: In‐ and outpatients | |
| Interventions | 1. Mirtazapine: 30 mg/day, N = 18 2. Fluoxetine: 20 mg/day, N = 18 Fixed dosing scheduling | |
| Outcomes | The measure used for response and remission in the review: 17‐item HAM‐D Other measures: None | |
| Notes | ||
| Risk of bias | ||
| Bias | Authors' judgement | Support for judgement |
| Random sequence generation (selection bias) | Unclear risk | Quote: "randomised" Comment: No further information provided. |
| Allocation concealment (selection bias) | Unclear risk | Comment: The method of concealment is not described. |
| Blinding (performance bias and detection bias) | Unclear risk | Quote: "double‐blind" Comment: No further information provided. |
| Incomplete outcome data (attrition bias) | Low risk | Less than 20% of the participants dropped out and missing outcome data are balanced in numbers across intervention groups, with similar reasons of missing data across groups. |
| Selective reporting (reporting bias) | Low risk | Both the response and the remission outcomes are reported in the figures with the actual numbers of the participants who achieved these. |
| Free of Sponsorship bias? | Unclear risk | The funding source is not described. |
| Methods | 8 week randomised double blind study | |
| Participants | Diagnosis: DSM‐IV major depressive disorder Setting: Unclear | |
| Interventions | 1. Mirtazapine: 30‐45 mg/day, N = 176 2. Sertraline: 50‐150 mg/day, N = 170 Flexible dosing scheduling | |
| Outcomes | The measure used for response and remission in the review: 17‐item HAM‐D Other measures: MADRS, CGI‐Improvement, CGI‐Severity | |
| Notes | ||
| Risk of bias | ||
| Bias | Authors' judgement | Support for judgement |
| Random sequence generation (selection bias) | Unclear risk | Quote: "randomised" Comment: No further information provided. |
| Allocation concealment (selection bias) | Unclear risk | Comment: The method of concealment is not described. |
| Blinding (performance bias and detection bias) | Unclear risk | Quote: "double‐blind" Comment: No further information provided. |
| Incomplete outcome data (attrition bias) | High risk | More than 20% of the allocated participants to both of the intervention arms dropped out during the study. |
| Selective reporting (reporting bias) | Low risk | Both the response and the remission outcomes are reported in the figures with the actual numbers of the participants who achieved these. |
| Free of Sponsorship bias? | High risk | The funding source is the pharmaceutical company of mirtazapine. |
| Methods | 6 week randomised double blind study | |
| Participants | Diagnosis: DSM‐IV major depressive disorder Setting: Outpatients | |
| Interventions | 1. Mirtazapine: 15‐45 mg/day, N = 139 2. Paroxetine: 20‐40 mg/day, N = 136 Flexible dosing scheduling | |
| Outcomes | The measure used for response and remission in the review: 17‐item HAM‐D Other measures: HAM‐A, BDI, Welzil‐Kohnen Colored Scales, Short Form‐36, CGI‐Improvement, CGI‐severity | |
| Notes | ||
| Risk of bias | ||
| Bias | Authors' judgement | Support for judgement |
| Random sequence generation (selection bias) | Unclear risk | Quote: "randomised" Comment: No further information provided. |
| Allocation concealment (selection bias) | Unclear risk | Comment: The method of concealment is not described. |
| Blinding (performance bias and detection bias) | Unclear risk | Quote: "double‐blind" Comment: No further information provided. |
| Incomplete outcome data (attrition bias) | High risk | More than 20% of the allocated participants to both of the intervention arms dropped out during the study. |
| Selective reporting (reporting bias) | Low risk | Both the response and the remission outcomes at end of the acute‐phase treatment are reported with the proportion of the participants who achieved these. |
| Free of Sponsorship bias? | High risk | The funding source is the pharmaceutical company of mirtazapine. |
| Methods | 6 week randomised double blind study | |
| Participants | Diagnosis: DSM‐IV major depressive disorder Setting: Outpatients | |
| Interventions | 1. Mirtazapine: 45 mg/day, N = 130 2. Venlafaxine: 225 mg/day, N = 128 Fixed dosing scheduling | |
| Outcomes | The measure used for response and remission in the review: 17‐item HAM‐D Other measures: MADRS, CGI‐Improvement, CGI‐Severity | |
| Notes | ||
| Risk of bias | ||
| Bias | Authors' judgement | Support for judgement |
| Random sequence generation (selection bias) | Unclear risk | Quote: "randomised" Comment: No further information provided. |
| Allocation concealment (selection bias) | Unclear risk | Comment: The method of concealment is not described. |
| Blinding (performance bias and detection bias) | Unclear risk | Quote: "double‐blind" Comment: No further information provided. |
| Incomplete outcome data (attrition bias) | High risk | More than 20% of the allocated participants to both of the intervention arms dropped out during the study. |
| Selective reporting (reporting bias) | Low risk | Both the response and the remission outcomes at end of the acute‐phase treatment are reported with the proportion of the participants who achieved these. |
| Free of Sponsorship bias? | High risk | The funding source is the pharmaceutical company of mirtazapine. |
| Methods | 6 week randomised double blind study | |
| Participants | Diagnosis: DSM‐III major depressive disorder Setting: Outpatients | |
| Interventions | 1. Mirtazapine: 5‐35 mg/day, N = 50 2. Amitriptlyline: 40‐280 mg/day, N = 50 3. Placebo, N = 50 Flexible dosing scheduling | |
| Outcomes | The measure used for response and remission in the review: 17‐item HAM‐D Other measures: MADRS, CGI‐Improvement, CGI‐Severity, Zung Self‐Rating Depression Scale | |
| Notes | ||
| Risk of bias | ||
| Bias | Authors' judgement | Support for judgement |
| Random sequence generation (selection bias) | Unclear risk | Quote: "randomised" Comment: No further information provided. |
| Allocation concealment (selection bias) | Unclear risk | Comment: The method of concealment is not described. |
| Blinding (performance bias and detection bias) | Unclear risk | Quote: "double‐blind" Comment: No further information provided. |
| Incomplete outcome data (attrition bias) | Low risk | Less than 20% of the participants dropped out and missing outcome data are balanced in numbers across intervention groups, with similar reasons of missing data across groups. |
| Selective reporting (reporting bias) | Low risk | The response outcome at the end of acute‐phase treatment is provided as the proportion of the participants who achieved this. |
| Free of Sponsorship bias? | High risk | The funding source is the pharmaceutical company of mirtazapine. |
| Methods | 2 week randomised study | |
| Participants | Diagnosis: DSM‐IV major depressive disorder, single episode Setting: Psychiatric inpatients | |
| Interventions | 1. Mirtazapine: mean 38.2 (SD 9.0) mg/day, N = 20 2. Reboxetine: mean 6.6 (SD 1.9) mg/day, N = 20 Flexible dosing scheduling | |
| Outcomes | The measure used for primary outcome: Performance in driving simulator Other measures: HAM‐D, BDI | |
| Notes | Only information about attrition of the participants is available for the present review. | |
| Risk of bias | ||
| Bias | Authors' judgement | Support for judgement |
| Random sequence generation (selection bias) | Unclear risk | Quote: "randomised" Comment: No further information provided. |
| Allocation concealment (selection bias) | Unclear risk | Comment: The method of concealment is not described. |
| Blinding (performance bias and detection bias) | Unclear risk | Comment: No further information provided. |
| Incomplete outcome data (attrition bias) | Low risk | Less than 20% of the participants dropped out and missing outcome data are balanced in numbers across intervention groups, with similar reasons of missing data across groups. |
| Selective reporting (reporting bias) | Unclear risk | No useful information in terms of depression severity at the end of treatment is provide. |
| Free of Sponsorship bias? | High risk | The funding source is the pharmaceutical company of the comparator drug. |
| Methods | 4 week randomised study | |
| Participants | Diagnosis: DSM‐IV major depression Setting: Unclear | |
| Interventions | 1. Mirtazapine: 30‐45 mg/day, N = 20 2. Paroxetine: 20‐30 mg/day, N = 20 3. Combination of mirtazapine and paroxetine Flexible dosing scheduling | |
| Outcomes | The measure used for response and remission in the review: Unclear Other measures: MADRS | |
| Notes | We were unable to retrieve usable information for the meta‐analysis and to contact the author because the principal author passed away. | |
| Risk of bias | ||
| Bias | Authors' judgement | Support for judgement |
| Random sequence generation (selection bias) | Unclear risk | Quote: "randomised" Comment: No further information provided. |
| Allocation concealment (selection bias) | Unclear risk | Comment: The method of concealment is not described. |
| Blinding (performance bias and detection bias) | Low risk | Quote: "double‐blind" Comment: No further information provided. |
| Incomplete outcome data (attrition bias) | Unclear risk | No information of attrition to permit judgement is provided. |
| Selective reporting (reporting bias) | Unclear risk | No information to permit judgement is provided. |
| Free of Sponsorship bias? | Unclear risk | No information to permit judgement is provided. |
| Methods | 14 week randomised study | |
| Participants | Diagnosis: DSM‐IV major depressive disorder Setting: Outpatients | |
| Interventions | 1. Mirtazapine: 15‐60 mg/day, N = 114 2. Nortriptyline: 25‐150 mg/day, N = 121 Flexible dosing scheduling | |
| Outcomes | The measure used for response and remission in the review: 16‐item Quick Inventory of Depressive Symptomatology Other measures: 17‐item HAM‐D, Short‐Form Health Survey, Work Productivity and Activity Impairment Questionnaire, Work and Social Adjustment Scale, Quality of Life Enjoyment and Satisfaction Questionnaire | |
| Notes | ||
| Risk of bias | ||
| Bias | Authors' judgement | Support for judgement |
| Random sequence generation (selection bias) | Unclear risk | Quote: "random assignment" Comment: No further information provided. |
| Allocation concealment (selection bias) | Unclear risk | Comment: The method of concealment is not described. |
| Blinding (performance bias and detection bias) | High risk | Comment: Both the participants and the clinicians knew the treatment status. |
| Incomplete outcome data (attrition bias) | Unclear risk | No information of attrition to permit judgement is provided. |
| Selective reporting (reporting bias) | Low risk | Both the response and the remission outcomes are reported in figures with the proportion of the participants who achieved these. |
| Free of Sponsorship bias? | Low risk | The funding source is National Institute of Mental Health. |
| Methods | 8 week randomised double blind study | |
| Participants | Diagnosis: DSM‐IV major depressive disorder Setting: Inpatients | |
| Interventions | 1. Mirtazapine: 45‐60 mg/day, N = 78 2. Venlafaxine: 75‐375 mg/day, N = 79 Flexible dosing scheduling | |
| Outcomes | The measure used for response and remission in the review: 17‐item HAM‐D Other measures: The Quality of Life, Enjoyment, and Satisfaction Questionnaire and Quality of Life in Depression Scale, Quality of Life in Depression Scales | |
| Notes | ||
| Risk of bias | ||
| Bias | Authors' judgement | Support for judgement |
| Random sequence generation (selection bias) | Unclear risk | Quote: "randomised" Comment: No further information provided. |
| Allocation concealment (selection bias) | Unclear risk | Quote: "participants were randomised to receive treatment with either mirtazapine or venlafaxine orally for 8 weeks, prepared as indistinguishable capsules, according to a centrally prepared randomization list" Comment: No further information about actual central randomisation provided. |
| Blinding (performance bias and detection bias) | Unclear risk | Quote: "double‐blind" Comment: No further information provided. |
| Incomplete outcome data (attrition bias) | High risk | More than 20% of the allocated participants to both of the intervention arms dropped out during the study. |
| Selective reporting (reporting bias) | Low risk | Both the response and the remission outcomes at end of the acute‐phase treatment are reported with the proportion of the participants who achieved these. |
| Free of Sponsorship bias? | High risk | The funding source is the pharmaceutical company of mirtazapine. |
| Methods | 6 week randomised double blind study | |
| Participants | Diagnosis: DSM‐III major depressive disorder Setting: Outpatients over 55 years of age | |
| Interventions | 1. Mirtazapine: 5‐35 mg/day, N = 50 2. Trazodone: 40‐280 mg/day, N = 50 3. Placebo, N = 50 Flexible dosing scheduling | |
| Outcomes | The measure used for response and remission in the review: 21‐item HAM‐D Other measures: MADRS, CGI‐Severity, Zung Self‐Rating Scale for Depression | |
| Notes | ||
| Risk of bias | ||
| Bias | Authors' judgement | Support for judgement |
| Random sequence generation (selection bias) | Unclear risk | Quote: "randomised" Comment: No further information provided. |
| Allocation concealment (selection bias) | Unclear risk | Comment: The method of allocation is not described. |
| Blinding (performance bias and detection bias) | Unclear risk | Quote: "double‐blind" Comment: No further information provided. |
| Incomplete outcome data (attrition bias) | High risk | More than 20% of the allocated participants to both of the intervention arms dropped out during the study. |
| Selective reporting (reporting bias) | Low risk | The response outcome at the end of acute‐phase treatment is provided as the proportion of the participants who achieved this. |
| Free of Sponsorship bias? | High risk | The funding source is the pharmaceutical company of mirtazapine. |
| Methods | 6 week randomised double blind study | |
| Participants | Diagnosis: DSM‐IV major depressive disorder Setting: Outpatients | |
| Interventions | 1. Mirtazapine: 15‐40 mg/day, N = 66 2. Fluoxetine: 20‐40 mg/day, N = 66 Flexible dosing scheduling | |
| Outcomes | The measure used for response and remission in the review: 17‐item HAM‐D Other measures: CGI‐Severity | |
| Notes | ||
| Risk of bias | ||
| Bias | Authors' judgement | Support for judgement |
| Random sequence generation (selection bias) | Unclear risk | Quote: "randomised" Comment: No further information provided. |
| Allocation concealment (selection bias) | Unclear risk | Comment: The method of allocation is not described. |
| Blinding (performance bias and detection bias) | Unclear risk | Quote: "double‐blind" Comment: No further information provided. |
| Incomplete outcome data (attrition bias) | High risk | More than 20% of the allocated participants to both of the intervention arms dropped out during the study. |
| Selective reporting (reporting bias) | Low risk | The response and remission outcomes at the end of acute‐phase treatment are provided as the proportion of the participants who achieved these. |
| Free of Sponsorship bias? | High risk | The funding source is the pharmaceutical company of mirtazapine. |
| Methods | 6 week randomised double blind study | |
| Participants | Diagnosis: DSM‐III major depressive disorder Setting: In‐ and outpatients | |
| Interventions | 1. Mirtazapine: 15‐45 mg/day, N = 56 2. Amitriptyline: 30‐90 mg/day, N = 59 Flexible dosing scheduling | |
| Outcomes | The measure used for response and remission in the review: 21‐item HAM‐D Other measures: MADRS, CGI‐Improvement, CGI‐Severity, Brief Cognitive Rating Scale | |
| Notes | ||
| Risk of bias | ||
| Bias | Authors' judgement | Support for judgement |
| Random sequence generation (selection bias) | Unclear risk | Quote: "randomised" Comment: No further information provided. |
| Allocation concealment (selection bias) | Unclear risk | Comment: The method of allocation is not described. |
| Blinding (performance bias and detection bias) | Unclear risk | Quote: "double‐blind" Comment: No further information provided. |
| Incomplete outcome data (attrition bias) | High risk | More than 20% of the allocated participants to the mirtazapine arm dropped out during the study. |
| Selective reporting (reporting bias) | High risk | Neither the response or remission outcomes at the end of acute‐phase treatment are provided. They needed to be imputed in the analysis. |
| Free of Sponsorship bias? | High risk | The funding source is the pharmaceutical company of mirtazapine. |
| Methods | 8 week randomised double blind study | |
| Participants | Diagnosis: DSM‐IV major depressive disorder Setting: In‐ and outpatients | |
| Interventions | 1. Mirtazapine: 15‐40 mg/day, N = 66 2. Fluoxetine: 20‐40 mg/day, N = 66 Flexiblie dosing scheduling | |
| Outcomes | The measure used for response and remission in the review: MADRS Other measures: HAM‐A, CGI‐Improvement, CGI‐Severity, Leeds Sleep Evaluation Questionnaire ‐adapted, Quality of Life Enjoyment and Satisfaction Questionnaire | |
| Notes | ||
| Risk of bias | ||
| Bias | Authors' judgement | Support for judgement |
| Random sequence generation (selection bias) | Unclear risk | Quote: "randomised" Comment: No further information provided. |
| Allocation concealment (selection bias) | Unclear risk | Quote: "participants were allocated to treatment with either mirtazapine or citalopram, according to the centrally prepared randomization list". Comment: No further information about actual central randomisation provided. |
| Blinding (performance bias and detection bias) | Unclear risk | Quote: "double‐blind" Comment: No further information provided. |
| Incomplete outcome data (attrition bias) | Low risk | Less than 20% of the participants dropped out and missing outcome data are balanced in numbers across intervention groups, with similar reasons of missing data across groups. |
| Selective reporting (reporting bias) | Low risk | The response outcome at the end of acute‐phase treatment is provided as the proportion of the participants who achieved these. |
| Free of Sponsorship bias? | High risk | The funding source is the pharmaceutical company of mirtazapine. |
| Methods | 6 week randomised double blind study | |
| Participants | Diagnosis: Research Diagnostic criteria major depressive disorder Setting: In‐ and outpatients | |
| Interventions | 1. Mirtazapine: 20‐60 mg/day, N =83 2. Doxepin: 75‐300 mg/day, N = 80 Flexible dosing scheduling | |
| Outcomes | The measure used for response and remission in the review: 17‐item HAM‐D Other measures: MADRS, Brief Psychiatric Rating Scale, Global Assessment Score, Beck Depression Inventory, Newcastle Endogenous / Reactive Depression Rating Scale | |
| Notes | ||
| Risk of bias | ||
| Bias | Authors' judgement | Support for judgement |
| Random sequence generation (selection bias) | Unclear risk | Quote: "randomised" Comment: No further information provided. |
| Allocation concealment (selection bias) | Unclear risk | Comment: The method of allocation is not described. |
| Blinding (performance bias and detection bias) | Unclear risk | Quote: "double‐blind" Comment: No further information provided. |
| Incomplete outcome data (attrition bias) | High risk | More than 20% of the allocated participants to the comparator arm dropped out during the study. |
| Selective reporting (reporting bias) | Low risk | The response outcome at the end of acute‐phase treatment is provided as the proportion of the participants who achieved this. |
| Free of Sponsorship bias? | High risk | The funding source is the pharmaceutical company of mirtazapine. |
| Methods | 5 week randomised double blind study | |
| Participants | Diagnosis: DSM‐III major depressive disorder Setting: In‐ and outpatients | |
| Interventions | 1. Mirtazapine: 20‐60 mg/day, N = 79 2. Amitriptyline: 75‐225 mg/day, N = 77 Flexible dosing scheduling | |
| Outcomes | The measure used for response and remission in the review: 17‐item HAM‐D Other measures: MADRS, Brief Psychiatric Rating Scale, General Assessment Scale | |
| Notes | ||
| Risk of bias | ||
| Bias | Authors' judgement | Support for judgement |
| Random sequence generation (selection bias) | Unclear risk | Quote: "randomised" Comment: No further information provided. |
| Allocation concealment (selection bias) | Unclear risk | Comment: The method of allocation is not described. |
| Blinding (performance bias and detection bias) | Unclear risk | Quote: "double‐blind" Comment: No further information provided. |
| Incomplete outcome data (attrition bias) | High risk | More than 20% of the allocated participants to the comparator arm dropped out during the study. |
| Selective reporting (reporting bias) | Low risk | The response outcome at the end of acute‐phase treatment is provided as the proportion of the participants who achieved this. |
| Free of Sponsorship bias? | High risk | The funding source is the pharmaceutical company of mirtazapine. |
| Methods | 6 week randomised double blind study | |
| Participants | Diagnosis: DSM‐III major depressive disorder Setting: Inpatients | |
| Interventions | 1. Mirtazapine: 20‐60 mg/day, N = 103 2. Amitriptyline: 75‐225 mg/day, N = 104 Flexible dosing scheduling | |
| Outcomes | The measure used for response and remission in the review: 17‐item HAM‐D Other measures: MADRS, CGI‐Improvement | |
| Notes | ||
| Risk of bias | ||
| Bias | Authors' judgement | Support for judgement |
| Random sequence generation (selection bias) | Unclear risk | Quote: "randomly allocated" Comment: No further information provided. |
| Allocation concealment (selection bias) | Unclear risk | Comment: The method of allocation is not described. |
| Blinding (performance bias and detection bias) | Unclear risk | Quote: "double‐blind" Comment: No further information provided. |
| Incomplete outcome data (attrition bias) | High risk | More than 20% of the allocated participants to both of the intervention arms dropped out during the study. |
| Selective reporting (reporting bias) | Low risk | The response outcome at the end of acute‐phase treatment is provided as the proportion of the participants who achieved this. |
| Free of Sponsorship bias? | High risk | The funding source is the pharmaceutical company of mirtazapine. |
| Methods | 6 week randomised double blind study | |
| Participants | Diagnosis: DSM‐IV major depressive disorder Setting: Inpatients | |
| Interventions | 1. Mirtazapine: 20‐80 mg/day, N = 87 2. Clomipramine: 50‐200 mg/day, N = 87 Flexible dosing scheduling | |
| Outcomes | The measure used for response and remission in the review: 21‐item HAM‐D Other measures: MADRS, Brief Psychiatric Rating Scale, General Assessment Scale | |
| Notes | ||
| Risk of bias | ||
| Bias | Authors' judgement | Support for judgement |
| Random sequence generation (selection bias) | Unclear risk | Quote: "randomly allocated" Comment: No further information provided. |
| Allocation concealment (selection bias) | Unclear risk | Comment: The method of concealment is not described. |
| Blinding (performance bias and detection bias) | Unclear risk | Quote: "double‐blind" Comment: No further information provided. |
| Incomplete outcome data (attrition bias) | High risk | More than 20% of the allocated participants to both of the intervention arms dropped out during the study. |
| Selective reporting (reporting bias) | Low risk | The response outcome at the end of acute‐phase treatment is provided as the proportion of the participants who achieved this. |
| Free of Sponsorship bias? | High risk | The funding source is the pharmaceutical company of mirtazapine. |
| Methods | 8 week randomised double blind study | |
| Participants | Diagnosis: DSM‐IV major depressive disorder Setting: Outpatients | |
| Interventions | 1. Mirtazapine: 15‐40 mg/day, N = 128 2. Paroxetine: 20‐40 mg/day, N = 126 Flexible dosing scheduling | |
| Outcomes | The measure used for response and remission in the review: 17‐item HAM‐D Other measures: CGI‐Severity, CGI‐Improvement | |
| Notes | ||
| Risk of bias | ||
| Bias | Authors' judgement | Support for judgement |
| Random sequence generation (selection bias) | Unclear risk | Quote: "randomised" Comment: No further information provided. |
| Allocation concealment (selection bias) | Unclear risk | Comment: The information of concealment is not described. |
| Blinding (performance bias and detection bias) | Unclear risk | Quote: "double‐blind" Comment: No further information provided. |
| Incomplete outcome data (attrition bias) | High risk | More than 20% of the allocated participants to the comparator arm dropped out during the study. |
| Selective reporting (reporting bias) | Low risk | The response and remission outcomes at the end of acute‐phase treatment are provided as the proportion of the participants who achieved these. |
| Free of Sponsorship bias? | High risk | The funding source is the pharmaceutical company of mirtazapine. |
| Methods | 6 week randomised double blind study | |
| Participants | Diagnosis: DSM‐IV major depressive disorder Setting: Outpatients | |
| Interventions | 1. Mirtazapine: 15‐45 mg/day, N = 205 2. Fluvoxamine: 50‐150 mg/day, N = 207 Flexible dosing scheduling | |
| Outcomes | The measure used for response and remission in the review: 17‐item HAM‐D Other measures: 21‐item HAM‐D | |
| Notes | ||
| Risk of bias | ||
| Bias | Authors' judgement | Support for judgement |
| Random sequence generation (selection bias) | Unclear risk | Quote: "randomised" Comment: No further information provided. |
| Allocation concealment (selection bias) | Unclear risk | Comment: The method of allocation is not described. |
| Blinding (performance bias and detection bias) | Unclear risk | Quote: "double‐blind" Comment: No further information provided. |
| Incomplete outcome data (attrition bias) | High risk | More than 20% of the allocated participants to the comparator arm dropped out during the study. |
| Selective reporting (reporting bias) | Low risk | The response outcome at the end of acute‐phase treatment is provided as the proportion of the participants who achieved this. |
| Free of Sponsorship bias? | High risk | The funding source is the pharmaceutical company of mirtazapine. |
| Methods | 5 week randomised study | |
| Participants | Diagnosis: DSM‐IV major depressive episode (bipolar disorder not included) Setting: Psychiatric inpatients | |
| Interventions | 1. Mirtazapine: 45 mg/day, N = 20 2. Reboxetine: 8 mg/day, N = 20 Fixed dosing scheduling | |
| Outcomes | The measure used for response and remission in the review: 21‐item HAM‐D Other measures: Hypothalamic‐pituitary‐adrenocortical axis activity | |
| Notes | ||
| Risk of bias | ||
| Bias | Authors' judgement | Support for judgement |
| Random sequence generation (selection bias) | Unclear risk | Quote: "randomised" Comment: No further information provided. |
| Allocation concealment (selection bias) | Unclear risk | Comment: The method of allocation is not described. |
| Blinding (performance bias and detection bias) | High risk | Quote: "We abstained from blinding the medication because the side effect profiles of reboxetine and mirtazapine markedly differ". |
| Incomplete outcome data (attrition bias) | Low risk | Less than 20% of the participants dropped out and missing outcome data are balanced in numbers across intervention groups, with similar reasons of missing data across groups. |
| Selective reporting (reporting bias) | Low risk | The response outcome at the end of acute‐phase treatment is provided as the numbers of the participants who achieved this. |
| Free of Sponsorship bias? | High risk | The funding source is the pharmaceutical company of mirtazapine. |
| Methods | 6 week randomised double blind study | |
| Participants | Diagnosis: DSM‐III major depressive disorder Setting: Outpatients | |
| Interventions | 1. Mirtazapine: ‐35 mg/day, N = 50 2. Amitriptyline: ‐280 mg/day, N = 50 3. Placebo, N = 50 Flexible dosing scheduling | |
| Outcomes | The measure used for response and remission in the review: 17‐item HAM‐D Other measures: MADRS, CGI‐Improvement, CGI‐Severity, Zung Self‐Rating Depression Scale | |
| Notes | ||
| Risk of bias | ||
| Bias | Authors' judgement | Support for judgement |
| Random sequence generation (selection bias) | Unclear risk | Quote: "randomised" Comment: No further information provided. |
| Allocation concealment (selection bias) | Unclear risk | Comment: The method of allocation is not described. |
| Blinding (performance bias and detection bias) | Unclear risk | Quote: "double‐blind" Comment: No further information provided. |
| Incomplete outcome data (attrition bias) | Unclear risk | The numbers of dropouts in the both arms are not specified. |
| Selective reporting (reporting bias) | Low risk | The response outcome at the end of acute‐phase treatment is provided as the proportion of the participants who achieved this. |
| Free of Sponsorship bias? | High risk | The funding source is the pharmaceutical company of mirtazapine. |
| Methods | 8 week randomised double blind study | |
| Participants | Diagnosis: DSM‐IV major depressive disorder Setting: Outpatients | |
| Interventions | 1. Mirtazapine: 15‐45 mg/day, N = 124 2. Sertraline: 50‐200 mg/day, N = 126 Flexible dosing scheduling | |
| Outcomes | The measure used for response and remission in the review: 17‐item HAM‐D Other measures: Inventory of Depressive Symptomatology ‐ Self‐Report Scale, Social Adaptation Self‐evaluation Scale, CGI‐Severity, CGI‐Efficacy | |
| Notes | ||
| Risk of bias | ||
| Bias | Authors' judgement | Support for judgement |
| Random sequence generation (selection bias) | Unclear risk | Quote: "randomised" Comment: No further information provided. |
| Allocation concealment (selection bias) | Unclear risk | Comment: The method of allocation is not described. |
| Blinding (performance bias and detection bias) | Unclear risk | Quote: "double‐blind" Comment: No further information provided. |
| Incomplete outcome data (attrition bias) | High risk | More than 20% of the allocated participants to both of the intervention arms dropped out during the study. |
| Selective reporting (reporting bias) | Low risk | The response and remission outcomes at the end of acute‐phase treatment are provided as the proportion of the participants who achieved these. |
| Free of Sponsorship bias? | High risk | The funding source is the pharmaceutical company of mirtazapine. |
| Methods | 60 day randomised study | |
| Participants | Diagnosis: DSM‐IV major depressive disorder Setting: Unclear | |
| Interventions | 1. Mirtazapine: unclear dose, N = 25 2. Amitriptyline: unclear dose, N = 27 Flexible dosing scheduling | |
| Outcomes | The measure used for response and remission in the review: 17‐item HAM‐D Other measures: MADRS, CGI‐I | |
| Notes | We were unable to retrieve usable information for the meta‐analysis and to obtain replies from the author. | |
| Risk of bias | ||
| Bias | Authors' judgement | Support for judgement |
| Random sequence generation (selection bias) | Unclear risk | Quote: "randomised" Comment: No further information provided. |
| Allocation concealment (selection bias) | Unclear risk | Comment: The method of concealment is not described. |
| Blinding (performance bias and detection bias) | Unclear risk | No information to permit judgement is provided. |
| Incomplete outcome data (attrition bias) | Low risk | Less than 20% of the participants dropped out and missing outcome data are balanced in numbers across intervention groups, with similar reasons of missing data across groups. |
| Selective reporting (reporting bias) | Unclear risk | No information to permit judgement is provided. |
| Free of Sponsorship bias? | Unclear risk | No information to permit judgement is provided. |
| Methods | 6 week randomised double blind study | |
| Participants | Diagnosis: DSM‐III major depressive disorder Setting: Inpatients | |
| Interventions | 1. Mirtazapine: 24‐72 mg/day, N = 100 2. Trazodone: 150‐450 mg/day, N = 100 Flexible dosing scheduling | |
| Outcomes | The measure used for response and remission in the review: 17‐item HAM‐D Other measures: MADRS, Brief Psychiatric Rating Scale, General Psychiatric Impression Global Assessment Scale, Beck Depression Inventory | |
| Notes | ||
| Risk of bias | ||
| Bias | Authors' judgement | Support for judgement |
| Random sequence generation (selection bias) | Unclear risk | Quote: "randomised" Comment: No further information provided. |
| Allocation concealment (selection bias) | Unclear risk | Comment: The method of allocation is not described. |
| Blinding (performance bias and detection bias) | Unclear risk | Quote: "double‐blind" Comment: No further information provided. |
| Incomplete outcome data (attrition bias) | High risk | More than 20% of the allocated participants to both of the intervention arms dropped out during the study. |
| Selective reporting (reporting bias) | Low risk | The response outcome at the end of acute‐phase treatment is provided as the proportion of the participants who achieved this. |
| Free of Sponsorship bias? | High risk | The funding source is the pharmaceutical company of mirtazapine. |
| Methods | 8 week randomised double blind study | |
| Participants | Diagnosis: DSM‐IV major depressive disorder Setting: In‐ and outpatients | |
| Interventions | 1. Mirtazapine: 30‐60 mg/day, N = 147 2. Fluoxetine: 20‐40 mg/day, N = 152 Flexible dosing scheduling | |
| Outcomes | The measure used for response and remission in the review: 17‐item HAM‐D Other measures: MADRS, CGI‐Severity, Leeds Sleep Evaluation Questionnaire, Quality of Life, Enjoyment and Satisfaction Questionnaire, Changes in Sezual Functioning Questionnaire | |
| Notes | ||
| Risk of bias | ||
| Bias | Authors' judgement | Support for judgement |
| Random sequence generation (selection bias) | Unclear risk | Quote: "randomised" Comment: No further information provided. |
| Allocation concealment (selection bias) | Unclear risk | Comment: The method of allocation is not described. |
| Blinding (performance bias and detection bias) | Unclear risk | Quote: "double‐blind" Comment: No further information provided. |
| Incomplete outcome data (attrition bias) | Unclear risk | The numbers of dropouts in the both arms are not specified. |
| Selective reporting (reporting bias) | Low risk | The response outcome at the end of acute‐phase treatment is provided in the figure as the proportion of the participants who achieved this. |
| Free of Sponsorship bias? | High risk | The funding source is the pharmaceutical company of mirtazapine. |
| Methods | 24 week randomised double blind study | |
| Participants | Diagnosis: DSM‐IV major depressive disorder Setting: Outpatients (in general practitioner clinics) | |
| Interventions | 1. Mirtazapine: 30‐45 mg/day, N = 99 2. Paroxetine: 20‐30 mg/day, N = 98 Flexible dosing scheduling | |
| Outcomes | The measure used for response and remission in the review: 17‐item HAM‐D Other measures: CGI‐Improvement, CGI‐Severity, CGI‐Patient Global Evaluation | |
| Notes | ||
| Risk of bias | ||
| Bias | Authors' judgement | Support for judgement |
| Random sequence generation (selection bias) | Unclear risk | Quote: "randomised" Comment: No further information provided. |
| Allocation concealment (selection bias) | Unclear risk | Quote: "Randomization was performed according to centrally prepared randomization lists". Comment: No further information about actual central randomization provided. |
| Blinding (performance bias and detection bias) | Unclear risk | Quote: "double‐blind" Comment: No further information provided. |
| Incomplete outcome data (attrition bias) | High risk | More than 20% of the allocated participants to both of the intervention arms dropped out during the study. |
| Selective reporting (reporting bias) | Low risk | The response and remission outcomes at the end of acute‐phase treatment are provided in the figures as the proportion of the participants who achieved these. |
| Free of Sponsorship bias? | High risk | The funding source is the pharmaceutical company of mirtazapine. |
| Methods | 6 week randomised double blind study | |
| Participants | Diagnosis: DSM‐III‐R major depressive disorder Setting: In‐ and outpatients | |
| Interventions | 1. Mirtazapine: 15‐60 mg/day, N = 66 2. Fluoxetine: 20‐40 mg/day, N = 67 Flexible dosing scheduling | |
| Outcomes | The measure used for response and remission in the review: 17‐item HAM‐D Other measures: CGI‐Severity, the Visual Analogue Mood Rating Scale, Quality of Life Enjoyment and Satisfaction Questionnaire | |
| Notes | ||
| Risk of bias | ||
| Bias | Authors' judgement | Support for judgement |
| Random sequence generation (selection bias) | Unclear risk | Quote: "randomised" Comment: No further information provided. |
| Allocation concealment (selection bias) | Unclear risk | Quote: "participants were allocated to treatment with either mirtazapine or fluoxetine, according to the centrally prepared randomization list". Comment: No further information about actual central randomization provided. |
| Blinding (performance bias and detection bias) | Unclear risk | Quote: "double‐blind" Comment: No further information provided. |
| Incomplete outcome data (attrition bias) | High risk | More than 20% of the allocated participants to both of the intervention arms dropped out during the study. |
| Selective reporting (reporting bias) | Low risk | The response and remission outcomes at the end of acute‐phase treatment are provided in the figures as the proportion of the participants who achieved these. |
| Free of Sponsorship bias? | High risk | The funding source is the pharmaceutical company of mirtazapine. |
| Methods | 8 week randomised double blind study | |
| Participants | Diagnosis: DSM‐IV major depressive disorder Setting: Unclear | |
| Interventions | 1. Mirtazapine: 45 mg/day, N = 9 2. Fluoxetine: 40 mg/day, N = 13 Fixed dosing scheduling | |
| Outcomes | The measure used for response and remission in the review: 21‐item HAM‐D Other measures: CGI‐Severity, polysomnographic data, multiple sleep latency testing, performance vigilance testing, Epworth Sleepiness Scale | |
| Notes | ||
| Risk of bias | ||
| Bias | Authors' judgement | Support for judgement |
| Random sequence generation (selection bias) | Unclear risk | Quote: "randomly assigned" Comment: No further information provided. |
| Allocation concealment (selection bias) | Unclear risk | Comment: The method of allocation is not described. |
| Blinding (performance bias and detection bias) | Unclear risk | Quote: "double‐blind" Comment: No further information provided. |
| Incomplete outcome data (attrition bias) | High risk | More than 20% of the allocated participants to the comparator arm dropped out during the study. |
| Selective reporting (reporting bias) | High risk | Neither the response nor remission outcomes at the end of acute‐phase treatment are provided. They needed to be imputed in the analysis. |
| Free of Sponsorship bias? | High risk | The funding source is the pharmaceutical company of mirtazapine. |
| Methods | 6 week randomised double blind study | |
| Participants | Diagnosis: DSM‐III major depressive disorder Setting: Inpatients | |
| Interventions | 1. Mirtazapine: 20‐60 mg/day, N = 125 2. Amitriptyline: 75‐225 mg/day, N = 126 Flexible dosing scheduling | |
| Outcomes | The measure used for response and remission in the review: 21‐item HAM‐D Other measures; Brief Psychiatric Rating Scale, General Assessment Scale | |
| Notes | ||
| Risk of bias | ||
| Bias | Authors' judgement | Support for judgement |
| Random sequence generation (selection bias) | Unclear risk | Quote: "randomised" Comment: No further information provided. |
| Allocation concealment (selection bias) | Unclear risk | Comment: The method of allocation is not described. |
| Blinding (performance bias and detection bias) | Unclear risk | Quote: "double‐blind" Comment: No further information provided. |
| Incomplete outcome data (attrition bias) | High risk | More than 20% of the allocated participants to both of the intervention arms dropped out during the study. |
| Selective reporting (reporting bias) | Low risk | The response outcome at the end of acute‐phase treatment is provided as the proportion of the participants who achieved this. |
| Free of Sponsorship bias? | High risk | The funding source is the pharmaceutical company of mirtazapine. |
Abbreviations: CGI = Clinical Global Impression, HAM‐D = Hamilton Rating Scale for Depression, MADRS = Montgomery‐Asberg Depression Rating Scale, RDC = Research Diagnostic Criteria
Characteristics of excluded studies [ordered by study ID]
Ir a:
| Study | Reason for exclusion |
| Mirtazapine was combined with another antidepressant. | |
| A review of other studies. | |
| A review of other studies. | |
| A review of other studies. | |
| Not a relevant diagnostic status. | |
| Not a relevant diagnostic status. | |
| Not a relevant diagnostic status. | |
| Not employing random allocation. |
Data and analyses
| Outcome or subgroup title | No. of studies | No. of participants | Statistical method | Effect size | ||||||||||||||||||||||||||||||||||||||||||||||||||||||||||||
| 1 Primary outcome (response) at 2 weeks Show forest plot | 8 | 1294 | Odds Ratio (M‐H, Random, 95% CI) | 0.85 [0.64, 1.13] | ||||||||||||||||||||||||||||||||||||||||||||||||||||||||||||
| Analysis 1.1  Comparison 1 Mirtazapine versus TCAs, Outcome 1 Primary outcome (response) at 2 weeks. | ||||||||||||||||||||||||||||||||||||||||||||||||||||||||||||||||
| 1.1 vs Amitriptyline | 5 | 722 | Odds Ratio (M‐H, Random, 95% CI) | 0.77 [0.54, 1.12] | ||||||||||||||||||||||||||||||||||||||||||||||||||||||||||||
| 1.2 vs Clomipramine | 1 | 174 | Odds Ratio (M‐H, Random, 95% CI) | 0.89 [0.46, 1.73] | ||||||||||||||||||||||||||||||||||||||||||||||||||||||||||||
| 1.3 vs Doxepin | 1 | 163 | Odds Ratio (M‐H, Random, 95% CI) | 1.11 [0.58, 2.12] | ||||||||||||||||||||||||||||||||||||||||||||||||||||||||||||
| 1.4 vs Nortriptyline | 1 | 235 | Odds Ratio (M‐H, Random, 95% CI) | 0.84 [0.22, 3.22] | ||||||||||||||||||||||||||||||||||||||||||||||||||||||||||||
| 2 Primary outcome (response) at end of the acute‐phase treatment Show forest plot | 9 | 1501 | Odds Ratio (M‐H, Random, 95% CI) | 0.89 [0.72, 1.10] | ||||||||||||||||||||||||||||||||||||||||||||||||||||||||||||
| Analysis 1.2  Comparison 1 Mirtazapine versus TCAs, Outcome 2 Primary outcome (response) at end of the acute‐phase treatment. | ||||||||||||||||||||||||||||||||||||||||||||||||||||||||||||||||
| 2.1 vs Amitriptyline | 6 | 929 | Odds Ratio (M‐H, Random, 95% CI) | 0.90 [0.69, 1.17] | ||||||||||||||||||||||||||||||||||||||||||||||||||||||||||||
| 2.2 vs Clomipramine | 1 | 174 | Odds Ratio (M‐H, Random, 95% CI) | 0.90 [0.47, 1.71] | ||||||||||||||||||||||||||||||||||||||||||||||||||||||||||||
| 2.3 vs Doxepin | 1 | 163 | Odds Ratio (M‐H, Random, 95% CI) | 0.85 [0.44, 1.63] | ||||||||||||||||||||||||||||||||||||||||||||||||||||||||||||
| 2.4 vs Nortriptyline | 1 | 235 | Odds Ratio (M‐H, Random, 95% CI) | 0.91 [0.53, 1.55] | ||||||||||||||||||||||||||||||||||||||||||||||||||||||||||||
| 3 Secondary outcome (remission) at 2 weeks Show forest plot | 8 | 1294 | Odds Ratio (M‐H, Random, 95% CI) | 0.85 [0.55, 1.32] | ||||||||||||||||||||||||||||||||||||||||||||||||||||||||||||
| Analysis 1.3  Comparison 1 Mirtazapine versus TCAs, Outcome 3 Secondary outcome (remission) at 2 weeks. | ||||||||||||||||||||||||||||||||||||||||||||||||||||||||||||||||
| 3.1 vs Amitriptyline | 5 | 722 | Odds Ratio (M‐H, Random, 95% CI) | 0.67 [0.35, 1.29] | ||||||||||||||||||||||||||||||||||||||||||||||||||||||||||||
| 3.2 vs Clomipramine | 1 | 174 | Odds Ratio (M‐H, Random, 95% CI) | 0.89 [0.34, 2.31] | ||||||||||||||||||||||||||||||||||||||||||||||||||||||||||||
| 3.3 vs Doxepin | 1 | 163 | Odds Ratio (M‐H, Random, 95% CI) | 1.27 [0.54, 3.00] | ||||||||||||||||||||||||||||||||||||||||||||||||||||||||||||
| 3.4 vs Nortriptyline | 1 | 235 | Odds Ratio (M‐H, Random, 95% CI) | 0.70 [0.12, 4.28] | ||||||||||||||||||||||||||||||||||||||||||||||||||||||||||||
| 4 Secondary outcome (remission) at end of the acute‐phase treatment Show forest plot | 9 | 1501 | Odds Ratio (M‐H, Random, 95% CI) | 0.86 [0.69, 1.08] | ||||||||||||||||||||||||||||||||||||||||||||||||||||||||||||
| Analysis 1.4  Comparison 1 Mirtazapine versus TCAs, Outcome 4 Secondary outcome (remission) at end of the acute‐phase treatment. | ||||||||||||||||||||||||||||||||||||||||||||||||||||||||||||||||
| 4.1 vs Amitriptyline | 6 | 929 | Odds Ratio (M‐H, Random, 95% CI) | 0.87 [0.65, 1.16] | ||||||||||||||||||||||||||||||||||||||||||||||||||||||||||||
| 4.2 vs Clomipramine | 1 | 174 | Odds Ratio (M‐H, Random, 95% CI) | 0.77 [0.41, 1.45] | ||||||||||||||||||||||||||||||||||||||||||||||||||||||||||||
| 4.3 vs Doxepin | 1 | 163 | Odds Ratio (M‐H, Random, 95% CI) | 0.94 [0.50, 1.74] | ||||||||||||||||||||||||||||||||||||||||||||||||||||||||||||
| 4.4 vs Nortriptyline | 1 | 235 | Odds Ratio (M‐H, Random, 95% CI) | 0.85 [0.46, 1.56] | ||||||||||||||||||||||||||||||||||||||||||||||||||||||||||||
| 5 Secondary outcome (depression severity) at 2 weeks Show forest plot | 2 | 361 | Std. Mean Difference (IV, Random, 95% CI) | 0.10 [‐0.11, 0.31] | ||||||||||||||||||||||||||||||||||||||||||||||||||||||||||||
| Analysis 1.5  Comparison 1 Mirtazapine versus TCAs, Outcome 5 Secondary outcome (depression severity) at 2 weeks. | ||||||||||||||||||||||||||||||||||||||||||||||||||||||||||||||||
| 5.1 vs Amitritpyline | 2 | 361 | Std. Mean Difference (IV, Random, 95% CI) | 0.10 [‐0.11, 0.31] | ||||||||||||||||||||||||||||||||||||||||||||||||||||||||||||
| 6 Secondary outcome (depression severity) at end of the acute‐phase treatment Show forest plot | 1 | 144 | Std. Mean Difference (IV, Random, 95% CI) | 0.12 [‐0.21, 0.45] | ||||||||||||||||||||||||||||||||||||||||||||||||||||||||||||
| Analysis 1.6  Comparison 1 Mirtazapine versus TCAs, Outcome 6 Secondary outcome (depression severity) at end of the acute‐phase treatment. | ||||||||||||||||||||||||||||||||||||||||||||||||||||||||||||||||
| 6.1 vs Amitritpyline | 1 | 144 | Std. Mean Difference (IV, Random, 95% CI) | 0.12 [‐0.21, 0.45] | ||||||||||||||||||||||||||||||||||||||||||||||||||||||||||||
| 7 Secondary outcome (Social adjustment) at 2 weeks Show forest plot | 1 | 138 | Mean Difference (IV, Random, 95% CI) | 1.60 [‐1.98, 5.18] | ||||||||||||||||||||||||||||||||||||||||||||||||||||||||||||
| Analysis 1.7  Comparison 1 Mirtazapine versus TCAs, Outcome 7 Secondary outcome (Social adjustment) at 2 weeks. | ||||||||||||||||||||||||||||||||||||||||||||||||||||||||||||||||
| 7.1 vs Amitriptyline | 1 | 138 | Mean Difference (IV, Random, 95% CI) | 1.60 [‐1.98, 5.18] | ||||||||||||||||||||||||||||||||||||||||||||||||||||||||||||
| 8 Secondary outcome (Social adjustment) at end of the acute‐phase treatment Show forest plot | 3 | 440 | Std. Mean Difference (IV, Random, 95% CI) | 0.02 [‐0.17, 0.21] | ||||||||||||||||||||||||||||||||||||||||||||||||||||||||||||
| Analysis 1.8  Comparison 1 Mirtazapine versus TCAs, Outcome 8 Secondary outcome (Social adjustment) at end of the acute‐phase treatment. | ||||||||||||||||||||||||||||||||||||||||||||||||||||||||||||||||
| 8.1 vs Amitriptyline | 1 | 114 | Std. Mean Difference (IV, Random, 95% CI) | 0.03 [‐0.34, 0.40] | ||||||||||||||||||||||||||||||||||||||||||||||||||||||||||||
| 8.2 vs Clomipramine | 1 | 163 | Std. Mean Difference (IV, Random, 95% CI) | 0.12 [‐0.19, 0.43] | ||||||||||||||||||||||||||||||||||||||||||||||||||||||||||||
| 8.3 vs Doxepin | 1 | 163 | Std. Mean Difference (IV, Random, 95% CI) | ‐0.09 [‐0.39, 0.22] | ||||||||||||||||||||||||||||||||||||||||||||||||||||||||||||
| 9 Secondary outcome (withdrawal due to any reason) Show forest plot | 7 | 1166 | Odds Ratio (M‐H, Random, 95% CI) | 0.83 [0.63, 1.10] | ||||||||||||||||||||||||||||||||||||||||||||||||||||||||||||
| Analysis 1.9  Comparison 1 Mirtazapine versus TCAs, Outcome 9 Secondary outcome (withdrawal due to any reason). | ||||||||||||||||||||||||||||||||||||||||||||||||||||||||||||||||
| 9.1 vs Amitriptyline | 5 | 829 | Odds Ratio (M‐H, Random, 95% CI) | 0.90 [0.65, 1.25] | ||||||||||||||||||||||||||||||||||||||||||||||||||||||||||||
| 9.2 vs Clomipramine | 1 | 174 | Odds Ratio (M‐H, Random, 95% CI) | 0.80 [0.42, 1.54] | ||||||||||||||||||||||||||||||||||||||||||||||||||||||||||||
| 9.3 vs Doxepin | 1 | 163 | Odds Ratio (M‐H, Random, 95% CI) | 0.51 [0.22, 1.19] | ||||||||||||||||||||||||||||||||||||||||||||||||||||||||||||
| 10 Secondary outcome (withdrawal due to adverse events) Show forest plot | 8 | 1266 | Odds Ratio (M‐H, Random, 95% CI) | 0.65 [0.41, 1.03] | ||||||||||||||||||||||||||||||||||||||||||||||||||||||||||||
| Analysis 1.10  Comparison 1 Mirtazapine versus TCAs, Outcome 10 Secondary outcome (withdrawal due to adverse events). | ||||||||||||||||||||||||||||||||||||||||||||||||||||||||||||||||
| 10.1 vs Amitriptyline | 6 | 929 | Odds Ratio (M‐H, Random, 95% CI) | 0.60 [0.35, 1.03] | ||||||||||||||||||||||||||||||||||||||||||||||||||||||||||||
| 10.2 vs Clomipramine | 1 | 174 | Odds Ratio (M‐H, Random, 95% CI) | 1.14 [0.42, 3.10] | ||||||||||||||||||||||||||||||||||||||||||||||||||||||||||||
| 10.3 vs Doxepin | 1 | 163 | Odds Ratio (M‐H, Random, 95% CI) | 0.30 [0.06, 1.56] | ||||||||||||||||||||||||||||||||||||||||||||||||||||||||||||
| 11 Secondary outcome (having some adverse events) Show forest plot | 2 | 442 | Odds Ratio (M‐H, Random, 95% CI) | 1.06 [0.54, 2.10] | ||||||||||||||||||||||||||||||||||||||||||||||||||||||||||||
| Analysis 1.11  Comparison 1 Mirtazapine versus TCAs, Outcome 11 Secondary outcome (having some adverse events). | ||||||||||||||||||||||||||||||||||||||||||||||||||||||||||||||||
| 11.1 vs Amitriptyline | 1 | 207 | Odds Ratio (M‐H, Random, 95% CI) | 0.74 [0.16, 3.37] | ||||||||||||||||||||||||||||||||||||||||||||||||||||||||||||
| 11.2 vs Nortriptyline | 1 | 235 | Odds Ratio (M‐H, Random, 95% CI) | 1.17 [0.55, 2.49] | ||||||||||||||||||||||||||||||||||||||||||||||||||||||||||||
| 12 Hypertension/Tachycardia Show forest plot | 4 | 522 | Odds Ratio (M‐H, Random, 95% CI) | 0.44 [0.24, 0.81] | ||||||||||||||||||||||||||||||||||||||||||||||||||||||||||||
| Analysis 1.12  Comparison 1 Mirtazapine versus TCAs, Outcome 12 Hypertension/Tachycardia. | ||||||||||||||||||||||||||||||||||||||||||||||||||||||||||||||||
| 12.1 vs Amitriptyline | 4 | 522 | Odds Ratio (M‐H, Random, 95% CI) | 0.44 [0.24, 0.81] | ||||||||||||||||||||||||||||||||||||||||||||||||||||||||||||
| 13 Hypotension/Bradycardia Show forest plot | 2 | 215 | Odds Ratio (M‐H, Random, 95% CI) | 0.46 [0.12, 1.81] | ||||||||||||||||||||||||||||||||||||||||||||||||||||||||||||
| Analysis 1.13  Comparison 1 Mirtazapine versus TCAs, Outcome 13 Hypotension/Bradycardia. | ||||||||||||||||||||||||||||||||||||||||||||||||||||||||||||||||
| 13.1 vs Amitriptyline | 2 | 215 | Odds Ratio (M‐H, Random, 95% CI) | 0.46 [0.12, 1.81] | ||||||||||||||||||||||||||||||||||||||||||||||||||||||||||||
| 14 Sweating Show forest plot | 2 | 458 | Odds Ratio (M‐H, Random, 95% CI) | 0.42 [0.05, 3.24] | ||||||||||||||||||||||||||||||||||||||||||||||||||||||||||||
| Analysis 1.14  Comparison 1 Mirtazapine versus TCAs, Outcome 14 Sweating. | ||||||||||||||||||||||||||||||||||||||||||||||||||||||||||||||||
| 14.1 vs Amitriptyline | 2 | 458 | Odds Ratio (M‐H, Random, 95% CI) | 0.42 [0.05, 3.24] | ||||||||||||||||||||||||||||||||||||||||||||||||||||||||||||
| 15 Constipation Show forest plot | 6 | 1003 | Odds Ratio (M‐H, Random, 95% CI) | 0.72 [0.46, 1.12] | ||||||||||||||||||||||||||||||||||||||||||||||||||||||||||||
| Analysis 1.15  Comparison 1 Mirtazapine versus TCAs, Outcome 15 Constipation. | ||||||||||||||||||||||||||||||||||||||||||||||||||||||||||||||||
| 15.1 vs Amitriptyline | 5 | 829 | Odds Ratio (M‐H, Random, 95% CI) | 0.72 [0.40, 1.29] | ||||||||||||||||||||||||||||||||||||||||||||||||||||||||||||
| 15.2 vs Clomipramine | 1 | 174 | Odds Ratio (M‐H, Random, 95% CI) | 0.62 [0.26, 1.48] | ||||||||||||||||||||||||||||||||||||||||||||||||||||||||||||
| 16 Dry mouth/Decreased salivation Show forest plot | 8 | 1266 | Odds Ratio (M‐H, Random, 95% CI) | 0.52 [0.24, 1.14] | ||||||||||||||||||||||||||||||||||||||||||||||||||||||||||||
| Analysis 1.16  Comparison 1 Mirtazapine versus TCAs, Outcome 16 Dry mouth/Decreased salivation. | ||||||||||||||||||||||||||||||||||||||||||||||||||||||||||||||||
| 16.1 vs Amitriptyline | 6 | 929 | Odds Ratio (M‐H, Random, 95% CI) | 0.36 [0.14, 0.92] | ||||||||||||||||||||||||||||||||||||||||||||||||||||||||||||
| 16.2 vs Clomipramine | 1 | 174 | Odds Ratio (M‐H, Random, 95% CI) | 0.81 [0.39, 1.69] | ||||||||||||||||||||||||||||||||||||||||||||||||||||||||||||
| 16.3 vs Doxepin | 1 | 163 | Odds Ratio (M‐H, Random, 95% CI) | 2.86 [1.18, 6.94] | ||||||||||||||||||||||||||||||||||||||||||||||||||||||||||||
| 17 Nausea/Vomiting/Gastric distress Show forest plot | 4 | 581 | Odds Ratio (M‐H, Random, 95% CI) | 0.29 [0.05, 1.59] | ||||||||||||||||||||||||||||||||||||||||||||||||||||||||||||
| Analysis 1.17  Comparison 1 Mirtazapine versus TCAs, Outcome 17 Nausea/Vomiting/Gastric distress. | ||||||||||||||||||||||||||||||||||||||||||||||||||||||||||||||||
| 17.1 vs Amitriptyline | 3 | 407 | Odds Ratio (M‐H, Random, 95% CI) | 0.33 [0.04, 2.59] | ||||||||||||||||||||||||||||||||||||||||||||||||||||||||||||
| 17.2 vs Clomipramine | 1 | 174 | Odds Ratio (M‐H, Random, 95% CI) | 0.16 [0.02, 1.33] | ||||||||||||||||||||||||||||||||||||||||||||||||||||||||||||
| 18 Weight gain/Increased appetite Show forest plot | 3 | 463 | Odds Ratio (M‐H, Random, 95% CI) | 1.04 [0.58, 1.86] | ||||||||||||||||||||||||||||||||||||||||||||||||||||||||||||
| Analysis 1.18  Comparison 1 Mirtazapine versus TCAs, Outcome 18 Weight gain/Increased appetite. | ||||||||||||||||||||||||||||||||||||||||||||||||||||||||||||||||
| 18.1 vs Amitriptyline | 3 | 463 | Odds Ratio (M‐H, Random, 95% CI) | 1.04 [0.58, 1.86] | ||||||||||||||||||||||||||||||||||||||||||||||||||||||||||||
| 19 Sexual dysfunction Show forest plot | 2 | 351 | Odds Ratio (M‐H, Random, 95% CI) | 0.41 [0.06, 2.61] | ||||||||||||||||||||||||||||||||||||||||||||||||||||||||||||
| Analysis 1.19  Comparison 1 Mirtazapine versus TCAs, Outcome 19 Sexual dysfunction. | ||||||||||||||||||||||||||||||||||||||||||||||||||||||||||||||||
| 19.1 vs Amitriptyline | 2 | 351 | Odds Ratio (M‐H, Random, 95% CI) | 0.41 [0.06, 2.61] | ||||||||||||||||||||||||||||||||||||||||||||||||||||||||||||
| 20 Anxiety/Agitation Show forest plot | 2 | 307 | Odds Ratio (M‐H, Random, 95% CI) | 0.87 [0.34, 2.19] | ||||||||||||||||||||||||||||||||||||||||||||||||||||||||||||
| Analysis 1.20  Comparison 1 Mirtazapine versus TCAs, Outcome 20 Anxiety/Agitation. | ||||||||||||||||||||||||||||||||||||||||||||||||||||||||||||||||
| 20.1 vs Amitriptyline | 2 | 307 | Odds Ratio (M‐H, Random, 95% CI) | 0.87 [0.34, 2.19] | ||||||||||||||||||||||||||||||||||||||||||||||||||||||||||||
| 21 Dizziness/Vertigo/Faintness Show forest plot | 7 | 1166 | Odds Ratio (M‐H, Random, 95% CI) | 0.75 [0.43, 1.28] | ||||||||||||||||||||||||||||||||||||||||||||||||||||||||||||
| Analysis 1.21  Comparison 1 Mirtazapine versus TCAs, Outcome 21 Dizziness/Vertigo/Faintness. | ||||||||||||||||||||||||||||||||||||||||||||||||||||||||||||||||
| 21.1 vs Amitriptyline | 5 | 829 | Odds Ratio (M‐H, Random, 95% CI) | 0.64 [0.35, 1.17] | ||||||||||||||||||||||||||||||||||||||||||||||||||||||||||||
| 21.2 vs Clomipramine | 1 | 174 | Odds Ratio (M‐H, Random, 95% CI) | 0.70 [0.21, 2.29] | ||||||||||||||||||||||||||||||||||||||||||||||||||||||||||||
| 21.3 vs Doxepin | 1 | 163 | Odds Ratio (M‐H, Random, 95% CI) | 3.04 [0.59, 15.53] | ||||||||||||||||||||||||||||||||||||||||||||||||||||||||||||
| 22 Fatigue/Tiredness/Asthenia Show forest plot | 4 | 673 | Odds Ratio (M‐H, Random, 95% CI) | 1.25 [0.71, 2.21] | ||||||||||||||||||||||||||||||||||||||||||||||||||||||||||||
| Analysis 1.22  Comparison 1 Mirtazapine versus TCAs, Outcome 22 Fatigue/Tiredness/Asthenia. | ||||||||||||||||||||||||||||||||||||||||||||||||||||||||||||||||
| 22.1 vs Amitriptyline | 4 | 673 | Odds Ratio (M‐H, Random, 95% CI) | 1.25 [0.71, 2.21] | ||||||||||||||||||||||||||||||||||||||||||||||||||||||||||||
| 23 Headache Show forest plot | 4 | 522 | Odds Ratio (M‐H, Random, 95% CI) | 0.74 [0.31, 1.74] | ||||||||||||||||||||||||||||||||||||||||||||||||||||||||||||
| Analysis 1.23  Comparison 1 Mirtazapine versus TCAs, Outcome 23 Headache. | ||||||||||||||||||||||||||||||||||||||||||||||||||||||||||||||||
| 23.1 vs Amitriptyline | 4 | 522 | Odds Ratio (M‐H, Random, 95% CI) | 0.74 [0.31, 1.74] | ||||||||||||||||||||||||||||||||||||||||||||||||||||||||||||
| 24 Tremor Show forest plot | 7 | 1103 | Odds Ratio (M‐H, Random, 95% CI) | 0.36 [0.22, 0.57] | ||||||||||||||||||||||||||||||||||||||||||||||||||||||||||||
| Analysis 1.24  Comparison 1 Mirtazapine versus TCAs, Outcome 24 Tremor. | ||||||||||||||||||||||||||||||||||||||||||||||||||||||||||||||||
| 24.1 vs Amitriptyline | 6 | 929 | Odds Ratio (M‐H, Random, 95% CI) | 0.36 [0.20, 0.62] | ||||||||||||||||||||||||||||||||||||||||||||||||||||||||||||
| 24.2 vs Clomipramine | 1 | 174 | Odds Ratio (M‐H, Random, 95% CI) | 0.36 [0.15, 0.88] | ||||||||||||||||||||||||||||||||||||||||||||||||||||||||||||
| 25 Sleep disturbance Show forest plot | 1 | 207 | Odds Ratio (M‐H, Random, 95% CI) | 1.43 [0.69, 2.98] | ||||||||||||||||||||||||||||||||||||||||||||||||||||||||||||
| Analysis 1.25  Comparison 1 Mirtazapine versus TCAs, Outcome 25 Sleep disturbance. | ||||||||||||||||||||||||||||||||||||||||||||||||||||||||||||||||
| 25.1 vs Amitriptyline | 1 | 207 | Odds Ratio (M‐H, Random, 95% CI) | 1.43 [0.69, 2.98] | ||||||||||||||||||||||||||||||||||||||||||||||||||||||||||||
| 26 Sleepiness/Drowsiness/Somnolence Show forest plot | 6 | 841 | Odds Ratio (M‐H, Random, 95% CI) | 0.92 [0.66, 1.27] | ||||||||||||||||||||||||||||||||||||||||||||||||||||||||||||
| Analysis 1.26  Comparison 1 Mirtazapine versus TCAs, Outcome 26 Sleepiness/Drowsiness/Somnolence. | ||||||||||||||||||||||||||||||||||||||||||||||||||||||||||||||||
| 26.1 vs Amitriptyline | 5 | 678 | Odds Ratio (M‐H, Random, 95% CI) | 0.81 [0.58, 1.14] | ||||||||||||||||||||||||||||||||||||||||||||||||||||||||||||
| 26.2 vs Doxepin | 1 | 163 | Odds Ratio (M‐H, Random, 95% CI) | 1.86 [0.82, 4.21] | ||||||||||||||||||||||||||||||||||||||||||||||||||||||||||||
| 27 Suicide attempt Show forest plot | 5 | 935 | Odds Ratio (M‐H, Random, 95% CI) | 1.77 [0.47, 6.58] | ||||||||||||||||||||||||||||||||||||||||||||||||||||||||||||
| Analysis 1.27  Comparison 1 Mirtazapine versus TCAs, Outcome 27 Suicide attempt. | ||||||||||||||||||||||||||||||||||||||||||||||||||||||||||||||||
| 27.1 vs Amitriptyline | 2 | 363 | Odds Ratio (M‐H, Random, 95% CI) | 2.08 [0.27, 16.29] | ||||||||||||||||||||||||||||||||||||||||||||||||||||||||||||
| 27.2 vs Clomipramine | 1 | 174 | Odds Ratio (M‐H, Random, 95% CI) | 1.0 [0.06, 16.25] | ||||||||||||||||||||||||||||||||||||||||||||||||||||||||||||
| 27.3 vs Doxepin | 1 | 163 | Odds Ratio (M‐H, Random, 95% CI) | 0.32 [0.01, 7.91] | ||||||||||||||||||||||||||||||||||||||||||||||||||||||||||||
| 27.4 vs Nortriptyline | 1 | 235 | Odds Ratio (M‐H, Random, 95% CI) | 9.90 [0.53, 185.90] | ||||||||||||||||||||||||||||||||||||||||||||||||||||||||||||
| 28 Subgroup analysis: Response at 2 weeks: Treatment settings: Psychiatric inpatients Show forest plot | 2 | 425 | Odds Ratio (M‐H, Random, 95% CI) | 0.81 [0.50, 1.32] | ||||||||||||||||||||||||||||||||||||||||||||||||||||||||||||
| Analysis 1.28  Comparison 1 Mirtazapine versus TCAs, Outcome 28 Subgroup analysis: Response at 2 weeks: Treatment settings: Psychiatric inpatients. | ||||||||||||||||||||||||||||||||||||||||||||||||||||||||||||||||
| 28.1 vs Amitriptyline | 1 | 251 | Odds Ratio (M‐H, Random, 95% CI) | 0.73 [0.36, 1.48] | ||||||||||||||||||||||||||||||||||||||||||||||||||||||||||||
| 28.2 vs Clomipramine | 1 | 174 | Odds Ratio (M‐H, Random, 95% CI) | 0.89 [0.46, 1.73] | ||||||||||||||||||||||||||||||||||||||||||||||||||||||||||||
| 29 Subgroup analysis: Response at end of the acute‐phase treatment: Treatment settings: Psychiatric inpatients Show forest plot | 3 | 632 | Odds Ratio (M‐H, Random, 95% CI) | 0.89 [0.64, 1.23] | ||||||||||||||||||||||||||||||||||||||||||||||||||||||||||||
| Analysis 1.29  Comparison 1 Mirtazapine versus TCAs, Outcome 29 Subgroup analysis: Response at end of the acute‐phase treatment: Treatment settings: Psychiatric inpatients. | ||||||||||||||||||||||||||||||||||||||||||||||||||||||||||||||||
| 29.1 vs Amitriptyline | 2 | 458 | Odds Ratio (M‐H, Random, 95% CI) | 0.88 [0.60, 1.29] | ||||||||||||||||||||||||||||||||||||||||||||||||||||||||||||
| 29.2 vs Clomipramine | 1 | 174 | Odds Ratio (M‐H, Random, 95% CI) | 0.90 [0.47, 1.71] | ||||||||||||||||||||||||||||||||||||||||||||||||||||||||||||
| 30 Sensitivity analysis: Response at 2 weeks: Studies without imputation Show forest plot | 7 | 1179 | Odds Ratio (M‐H, Random, 95% CI) | 0.85 [0.64, 1.15] | ||||||||||||||||||||||||||||||||||||||||||||||||||||||||||||
| Analysis 1.30  Comparison 1 Mirtazapine versus TCAs, Outcome 30 Sensitivity analysis: Response at 2 weeks: Studies without imputation. | ||||||||||||||||||||||||||||||||||||||||||||||||||||||||||||||||
| 30.1 vs Amitriptyline | 4 | 607 | Odds Ratio (M‐H, Random, 95% CI) | 0.76 [0.51, 1.13] | ||||||||||||||||||||||||||||||||||||||||||||||||||||||||||||
| 30.2 vs Clomipramine | 1 | 174 | Odds Ratio (M‐H, Random, 95% CI) | 0.89 [0.46, 1.73] | ||||||||||||||||||||||||||||||||||||||||||||||||||||||||||||
| 30.3 vs Doxepin | 1 | 163 | Odds Ratio (M‐H, Random, 95% CI) | 1.11 [0.58, 2.12] | ||||||||||||||||||||||||||||||||||||||||||||||||||||||||||||
| 30.4 vs Nortriptyline | 1 | 235 | Odds Ratio (M‐H, Random, 95% CI) | 0.84 [0.22, 3.22] | ||||||||||||||||||||||||||||||||||||||||||||||||||||||||||||
| 31 Sensitivity analysis: Response at end of the acute‐phase treatment: Studies without imputation Show forest plot | 8 | 1386 | Odds Ratio (M‐H, Random, 95% CI) | 0.93 [0.74, 1.15] | ||||||||||||||||||||||||||||||||||||||||||||||||||||||||||||
| Analysis 1.31  Comparison 1 Mirtazapine versus TCAs, Outcome 31 Sensitivity analysis: Response at end of the acute‐phase treatment: Studies without imputation. | ||||||||||||||||||||||||||||||||||||||||||||||||||||||||||||||||
| 31.1 vs Amitriptyline | 5 | 814 | Odds Ratio (M‐H, Random, 95% CI) | 0.95 [0.72, 1.26] | ||||||||||||||||||||||||||||||||||||||||||||||||||||||||||||
| 31.2 vs Clomipramine | 1 | 174 | Odds Ratio (M‐H, Random, 95% CI) | 0.90 [0.47, 1.71] | ||||||||||||||||||||||||||||||||||||||||||||||||||||||||||||
| 31.3 vs Doxepin | 1 | 163 | Odds Ratio (M‐H, Random, 95% CI) | 0.85 [0.44, 1.63] | ||||||||||||||||||||||||||||||||||||||||||||||||||||||||||||
| 31.4 vs Nortriptyline | 1 | 235 | Odds Ratio (M‐H, Random, 95% CI) | 0.91 [0.53, 1.55] | ||||||||||||||||||||||||||||||||||||||||||||||||||||||||||||
| 32 Secondary outcome (SKEWED DATA: depression severity) at 2 weeks Show forest plot | Other data | No numeric data | ||||||||||||||||||||||||||||||||||||||||||||||||||||||||||||||
| Analysis 1.32
Comparison 1 Mirtazapine versus TCAs, Outcome 32 Secondary outcome (SKEWED DATA: depression severity) at 2 weeks. | ||||||||||||||||||||||||||||||||||||||||||||||||||||||||||||||||
| 33 Secondary outcome (SKEWED DATA: depression severity) at end of the acute‐phase treatment Show forest plot | Other data | No numeric data | ||||||||||||||||||||||||||||||||||||||||||||||||||||||||||||||
| Analysis 1.33
Comparison 1 Mirtazapine versus TCAs, Outcome 33 Secondary outcome (SKEWED DATA: depression severity) at end of the acute‐phase treatment. | ||||||||||||||||||||||||||||||||||||||||||||||||||||||||||||||||
| Outcome or subgroup title | No. of studies | No. of participants | Statistical method | Effect size | ||||||||||||||||||||||||||||||||||||||||||||||||||
| 1 Primary outcome (response) at 2 weeks Show forest plot | 12 | 2626 | Odds Ratio (M‐H, Random, 95% CI) | 1.57 [1.30, 1.88] | ||||||||||||||||||||||||||||||||||||||||||||||||||
| Analysis 2.1  Comparison 2 Mirtazapine versus SSRIs, Outcome 1 Primary outcome (response) at 2 weeks. | ||||||||||||||||||||||||||||||||||||||||||||||||||||||
| 1.1 vs Citalolpram | 1 | 270 | Odds Ratio (M‐H, Random, 95% CI) | 2.01 [0.93, 4.35] | ||||||||||||||||||||||||||||||||||||||||||||||||||
| 1.2 vs Fluoxetine | 5 | 622 | Odds Ratio (M‐H, Random, 95% CI) | 1.26 [0.86, 1.85] | ||||||||||||||||||||||||||||||||||||||||||||||||||
| 1.3 vs Paroxetine | 3 | 726 | Odds Ratio (M‐H, Random, 95% CI) | 2.39 [1.42, 4.02] | ||||||||||||||||||||||||||||||||||||||||||||||||||
| 1.4 vs Sertraline | 2 | 596 | Odds Ratio (M‐H, Random, 95% CI) | 1.45 [1.04, 2.02] | ||||||||||||||||||||||||||||||||||||||||||||||||||
| 1.5 vs Fluvoxamine | 1 | 412 | Odds Ratio (M‐H, Random, 95% CI) | 1.38 [0.90, 2.13] | ||||||||||||||||||||||||||||||||||||||||||||||||||
| 2 Primary outcome (response) at end of the acute‐phase treatment Show forest plot | 12 | 2626 | Odds Ratio (M‐H, Random, 95% CI) | 1.19 [1.01, 1.39] | ||||||||||||||||||||||||||||||||||||||||||||||||||
| Analysis 2.2  Comparison 2 Mirtazapine versus SSRIs, Outcome 2 Primary outcome (response) at end of the acute‐phase treatment. | ||||||||||||||||||||||||||||||||||||||||||||||||||||||
| 2.1 vs Citalolpram | 1 | 270 | Odds Ratio (M‐H, Random, 95% CI) | 0.76 [0.38, 1.52] | ||||||||||||||||||||||||||||||||||||||||||||||||||
| 2.2 vs Fluoxetine | 5 | 622 | Odds Ratio (M‐H, Random, 95% CI) | 1.55 [1.07, 2.23] | ||||||||||||||||||||||||||||||||||||||||||||||||||
| 2.3 vs Paroxetine | 3 | 726 | Odds Ratio (M‐H, Random, 95% CI) | 1.27 [0.94, 1.70] | ||||||||||||||||||||||||||||||||||||||||||||||||||
| 2.4 vs Sertraline | 2 | 596 | Odds Ratio (M‐H, Random, 95% CI) | 0.97 [0.70, 1.35] | ||||||||||||||||||||||||||||||||||||||||||||||||||
| 2.5 vs Fluvoxamine | 1 | 412 | Odds Ratio (M‐H, Random, 95% CI) | 1.14 [0.76, 1.70] | ||||||||||||||||||||||||||||||||||||||||||||||||||
| 3 Primary outcome (response) at end of the continuation treatment Show forest plot | 1 | 197 | Odds Ratio (M‐H, Random, 95% CI) | 1.60 [0.91, 2.81] | ||||||||||||||||||||||||||||||||||||||||||||||||||
| Analysis 2.3  Comparison 2 Mirtazapine versus SSRIs, Outcome 3 Primary outcome (response) at end of the continuation treatment. | ||||||||||||||||||||||||||||||||||||||||||||||||||||||
| 3.1 vs Paroxetine | 1 | 197 | Odds Ratio (M‐H, Random, 95% CI) | 1.60 [0.91, 2.81] | ||||||||||||||||||||||||||||||||||||||||||||||||||
| 4 Secondary outcome (remission) at 2 weeks Show forest plot | 12 | 2626 | Odds Ratio (M‐H, Random, 95% CI) | 1.82 [1.36, 2.44] | ||||||||||||||||||||||||||||||||||||||||||||||||||
| Analysis 2.4  Comparison 2 Mirtazapine versus SSRIs, Outcome 4 Secondary outcome (remission) at 2 weeks. | ||||||||||||||||||||||||||||||||||||||||||||||||||||||
| 4.1 vs Citalolpram | 1 | 270 | Odds Ratio (M‐H, Random, 95% CI) | 2.48 [0.47, 13.02] | ||||||||||||||||||||||||||||||||||||||||||||||||||
| 4.2 vs Fluoxetine | 5 | 622 | Odds Ratio (M‐H, Random, 95% CI) | 1.63 [0.81, 3.27] | ||||||||||||||||||||||||||||||||||||||||||||||||||
| 4.3 vs Paroxetine | 3 | 726 | Odds Ratio (M‐H, Random, 95% CI) | 2.31 [1.04, 5.11] | ||||||||||||||||||||||||||||||||||||||||||||||||||
| 4.4 vs Sertraline | 2 | 596 | Odds Ratio (M‐H, Random, 95% CI) | 1.94 [1.19, 3.15] | ||||||||||||||||||||||||||||||||||||||||||||||||||
| 4.5 vs Fluvoxamine | 1 | 412 | Odds Ratio (M‐H, Random, 95% CI) | 1.46 [0.77, 2.76] | ||||||||||||||||||||||||||||||||||||||||||||||||||
| 5 Secondary outcome (remission) at end of the acute‐phase treatment Show forest plot | 12 | 2626 | Odds Ratio (M‐H, Random, 95% CI) | 1.17 [0.98, 1.40] | ||||||||||||||||||||||||||||||||||||||||||||||||||
| Analysis 2.5  Comparison 2 Mirtazapine versus SSRIs, Outcome 5 Secondary outcome (remission) at end of the acute‐phase treatment. | ||||||||||||||||||||||||||||||||||||||||||||||||||||||
| 5.1 vs Citalolpram | 1 | 270 | Odds Ratio (M‐H, Random, 95% CI) | 0.92 [0.55, 1.52] | ||||||||||||||||||||||||||||||||||||||||||||||||||
| 5.2 vs Fluoxetine | 5 | 622 | Odds Ratio (M‐H, Random, 95% CI) | 1.12 [0.80, 1.57] | ||||||||||||||||||||||||||||||||||||||||||||||||||
| 5.3 vs Paroxetine | 3 | 726 | Odds Ratio (M‐H, Random, 95% CI) | 1.58 [1.16, 2.15] | ||||||||||||||||||||||||||||||||||||||||||||||||||
| 5.4 vs Sertraline | 2 | 596 | Odds Ratio (M‐H, Random, 95% CI) | 1.18 [0.82, 1.71] | ||||||||||||||||||||||||||||||||||||||||||||||||||
| 5.5 vs Fluvoxamine | 1 | 412 | Odds Ratio (M‐H, Random, 95% CI) | 0.84 [0.57, 1.23] | ||||||||||||||||||||||||||||||||||||||||||||||||||
| 6 Secondary outcome (remission) at end of the continuation treatment Show forest plot | 1 | 197 | Odds Ratio (M‐H, Random, 95% CI) | 1.89 [1.01, 3.54] | ||||||||||||||||||||||||||||||||||||||||||||||||||
| Analysis 2.6  Comparison 2 Mirtazapine versus SSRIs, Outcome 6 Secondary outcome (remission) at end of the continuation treatment. | ||||||||||||||||||||||||||||||||||||||||||||||||||||||
| 6.1 vs Paroxetine | 1 | 197 | Odds Ratio (M‐H, Random, 95% CI) | 1.89 [1.01, 3.54] | ||||||||||||||||||||||||||||||||||||||||||||||||||
| 7 Secondary outcome (withdrawal due to any reason) Show forest plot | 11 | 2327 | Odds Ratio (M‐H, Random, 95% CI) | 1.12 [0.89, 1.40] | ||||||||||||||||||||||||||||||||||||||||||||||||||
| Analysis 2.7  Comparison 2 Mirtazapine versus SSRIs, Outcome 7 Secondary outcome (withdrawal due to any reason). | ||||||||||||||||||||||||||||||||||||||||||||||||||||||
| 7.1 vs Citalolpram | 1 | 270 | Odds Ratio (M‐H, Random, 95% CI) | 2.36 [0.99, 5.64] | ||||||||||||||||||||||||||||||||||||||||||||||||||
| 7.2 vs Fluoxetine | 4 | 323 | Odds Ratio (M‐H, Random, 95% CI) | 1.09 [0.67, 1.78] | ||||||||||||||||||||||||||||||||||||||||||||||||||
| 7.3 vs Paroxetine | 3 | 726 | Odds Ratio (M‐H, Random, 95% CI) | 0.80 [0.58, 1.10] | ||||||||||||||||||||||||||||||||||||||||||||||||||
| 7.4 vs Sertraline | 2 | 596 | Odds Ratio (M‐H, Random, 95% CI) | 1.47 [1.01, 2.13] | ||||||||||||||||||||||||||||||||||||||||||||||||||
| 7.5 vs Fluvoxamine | 1 | 412 | Odds Ratio (M‐H, Random, 95% CI) | 1.20 [0.75, 1.93] | ||||||||||||||||||||||||||||||||||||||||||||||||||
| 8 Secondary outcome (withdrawal due to adverse events) Show forest plot | 11 | 2604 | Odds Ratio (M‐H, Random, 95% CI) | 1.26 [0.85, 1.86] | ||||||||||||||||||||||||||||||||||||||||||||||||||
| Analysis 2.8  Comparison 2 Mirtazapine versus SSRIs, Outcome 8 Secondary outcome (withdrawal due to adverse events). | ||||||||||||||||||||||||||||||||||||||||||||||||||||||
| 8.1 vs Citalolpram | 1 | 270 | Odds Ratio (M‐H, Random, 95% CI) | 2.0 [0.59, 6.81] | ||||||||||||||||||||||||||||||||||||||||||||||||||
| 8.2 vs Fluoxetine | 4 | 600 | Odds Ratio (M‐H, Random, 95% CI) | 1.05 [0.62, 1.78] | ||||||||||||||||||||||||||||||||||||||||||||||||||
| 8.3 vs Paroxetine | 3 | 726 | Odds Ratio (M‐H, Random, 95% CI) | 0.74 [0.45, 1.21] | ||||||||||||||||||||||||||||||||||||||||||||||||||
| 8.4 vs Sertraline | 2 | 596 | Odds Ratio (M‐H, Random, 95% CI) | 2.88 [1.43, 5.77] | ||||||||||||||||||||||||||||||||||||||||||||||||||
| 8.5 vs Fluvoxamine | 1 | 412 | Odds Ratio (M‐H, Random, 95% CI) | 1.66 [0.86, 3.21] | ||||||||||||||||||||||||||||||||||||||||||||||||||
| 9 Secondary outcome (having some adverse events) Show forest plot | 7 | 1773 | Odds Ratio (M‐H, Random, 95% CI) | 1.01 [0.81, 1.26] | ||||||||||||||||||||||||||||||||||||||||||||||||||
| Analysis 2.9  Comparison 2 Mirtazapine versus SSRIs, Outcome 9 Secondary outcome (having some adverse events). | ||||||||||||||||||||||||||||||||||||||||||||||||||||||
| 9.1 vs Citalolpram | 1 | 270 | Odds Ratio (M‐H, Random, 95% CI) | 0.82 [0.49, 1.37] | ||||||||||||||||||||||||||||||||||||||||||||||||||
| 9.2 vs Fluoxetine | 2 | 431 | Odds Ratio (M‐H, Random, 95% CI) | 1.42 [0.97, 2.09] | ||||||||||||||||||||||||||||||||||||||||||||||||||
| 9.3 vs Paroxetine | 3 | 726 | Odds Ratio (M‐H, Random, 95% CI) | 0.94 [0.66, 1.32] | ||||||||||||||||||||||||||||||||||||||||||||||||||
| 9.4 vs Sertraline | 1 | 346 | Odds Ratio (M‐H, Random, 95% CI) | 0.86 [0.55, 1.34] | ||||||||||||||||||||||||||||||||||||||||||||||||||
| 10 Hypotension/Bradycardia Show forest plot | 1 | 133 | Odds Ratio (M‐H, Random, 95% CI) | 5.41 [0.61, 47.62] | ||||||||||||||||||||||||||||||||||||||||||||||||||
| Analysis 2.10  Comparison 2 Mirtazapine versus SSRIs, Outcome 10 Hypotension/Bradycardia. | ||||||||||||||||||||||||||||||||||||||||||||||||||||||
| 10.1 vs Fluoxetine | 1 | 133 | Odds Ratio (M‐H, Random, 95% CI) | 5.41 [0.61, 47.62] | ||||||||||||||||||||||||||||||||||||||||||||||||||
| 11 Sweating Show forest plot | 5 | 1342 | Odds Ratio (M‐H, Random, 95% CI) | 0.25 [0.15, 0.44] | ||||||||||||||||||||||||||||||||||||||||||||||||||
| Analysis 2.11  Comparison 2 Mirtazapine versus SSRIs, Outcome 11 Sweating. | ||||||||||||||||||||||||||||||||||||||||||||||||||||||
| 11.1 vs Citalolpram | 1 | 270 | Odds Ratio (M‐H, Random, 95% CI) | 0.13 [0.04, 0.44] | ||||||||||||||||||||||||||||||||||||||||||||||||||
| 11.2 vs Paroxetine | 3 | 726 | Odds Ratio (M‐H, Random, 95% CI) | 0.32 [0.17, 0.62] | ||||||||||||||||||||||||||||||||||||||||||||||||||
| 11.3 vs Sertraline | 1 | 346 | Odds Ratio (M‐H, Random, 95% CI) | 0.21 [0.04, 0.97] | ||||||||||||||||||||||||||||||||||||||||||||||||||
| 12 Constipation Show forest plot | 5 | 1109 | Odds Ratio (M‐H, Random, 95% CI) | 1.20 [0.79, 1.82] | ||||||||||||||||||||||||||||||||||||||||||||||||||
| Analysis 2.12  Comparison 2 Mirtazapine versus SSRIs, Outcome 12 Constipation. | ||||||||||||||||||||||||||||||||||||||||||||||||||||||
| 12.1 vs Fluoxetine | 2 | 168 | Odds Ratio (M‐H, Random, 95% CI) | 2.14 [0.81, 5.66] | ||||||||||||||||||||||||||||||||||||||||||||||||||
| 12.2 vs Paroxetine | 2 | 529 | Odds Ratio (M‐H, Random, 95% CI) | 1.07 [0.59, 1.95] | ||||||||||||||||||||||||||||||||||||||||||||||||||
| 12.3 vs Fluvoxamine | 1 | 412 | Odds Ratio (M‐H, Random, 95% CI) | 1.01 [0.48, 2.12] | ||||||||||||||||||||||||||||||||||||||||||||||||||
| 13 Diarrhoea Show forest plot | 8 | 2040 | Odds Ratio (M‐H, Random, 95% CI) | 0.57 [0.41, 0.80] | ||||||||||||||||||||||||||||||||||||||||||||||||||
| Analysis 2.13  Comparison 2 Mirtazapine versus SSRIs, Outcome 13 Diarrhoea. | ||||||||||||||||||||||||||||||||||||||||||||||||||||||
| 13.1 vs Citalolpram | 1 | 270 | Odds Ratio (M‐H, Random, 95% CI) | 0.47 [0.14, 1.60] | ||||||||||||||||||||||||||||||||||||||||||||||||||
| 13.2 vs Fluoxetine | 1 | 36 | Odds Ratio (M‐H, Random, 95% CI) | 1.0 [0.06, 17.33] | ||||||||||||||||||||||||||||||||||||||||||||||||||
| 13.3 vs Paroxetine | 3 | 726 | Odds Ratio (M‐H, Random, 95% CI) | 0.89 [0.55, 1.46] | ||||||||||||||||||||||||||||||||||||||||||||||||||
| 13.4 vs Sertraline | 2 | 596 | Odds Ratio (M‐H, Random, 95% CI) | 0.37 [0.21, 0.67] | ||||||||||||||||||||||||||||||||||||||||||||||||||
| 13.5 vs Fluvoxamine | 1 | 412 | Odds Ratio (M‐H, Random, 95% CI) | 0.34 [0.13, 0.87] | ||||||||||||||||||||||||||||||||||||||||||||||||||
| 14 Dry mouth/Decreased salivation Show forest plot | 10 | 2305 | Odds Ratio (M‐H, Random, 95% CI) | 1.80 [1.37, 2.36] | ||||||||||||||||||||||||||||||||||||||||||||||||||
| Analysis 2.14  Comparison 2 Mirtazapine versus SSRIs, Outcome 14 Dry mouth/Decreased salivation. | ||||||||||||||||||||||||||||||||||||||||||||||||||||||
| 14.1 vs Citalolpram | 1 | 270 | Odds Ratio (M‐H, Random, 95% CI) | 1.72 [0.81, 3.68] | ||||||||||||||||||||||||||||||||||||||||||||||||||
| 14.2 vs Fluoxetine | 3 | 301 | Odds Ratio (M‐H, Random, 95% CI) | 3.68 [1.52, 8.91] | ||||||||||||||||||||||||||||||||||||||||||||||||||
| 14.3 vs Paroxetine | 3 | 726 | Odds Ratio (M‐H, Random, 95% CI) | 1.73 [0.81, 3.70] | ||||||||||||||||||||||||||||||||||||||||||||||||||
| 14.4 vs Sertraline | 2 | 596 | Odds Ratio (M‐H, Random, 95% CI) | 1.53 [0.92, 2.55] | ||||||||||||||||||||||||||||||||||||||||||||||||||
| 14.5 vs Fluvoxamine | 1 | 412 | Odds Ratio (M‐H, Random, 95% CI) | 1.48 [0.77, 2.85] | ||||||||||||||||||||||||||||||||||||||||||||||||||
| 15 Nausea/Vomiting/Gastric distress Show forest plot | 11 | 2604 | Odds Ratio (M‐H, Random, 95% CI) | 0.33 [0.26, 0.43] | ||||||||||||||||||||||||||||||||||||||||||||||||||
| Analysis 2.15  Comparison 2 Mirtazapine versus SSRIs, Outcome 15 Nausea/Vomiting/Gastric distress. | ||||||||||||||||||||||||||||||||||||||||||||||||||||||
| 15.1 vs Citalolpram | 1 | 270 | Odds Ratio (M‐H, Random, 95% CI) | 0.45 [0.22, 0.90] | ||||||||||||||||||||||||||||||||||||||||||||||||||
| 15.2 vs Fluoxetine | 4 | 600 | Odds Ratio (M‐H, Random, 95% CI) | 0.34 [0.14, 0.81] | ||||||||||||||||||||||||||||||||||||||||||||||||||
| 15.3 vs Paroxetine | 3 | 726 | Odds Ratio (M‐H, Random, 95% CI) | 0.27 [0.16, 0.44] | ||||||||||||||||||||||||||||||||||||||||||||||||||
| 15.4 vs Sertraline | 2 | 596 | Odds Ratio (M‐H, Random, 95% CI) | 0.27 [0.16, 0.48] | ||||||||||||||||||||||||||||||||||||||||||||||||||
| 15.5 vs Fluvoxamine | 1 | 412 | Odds Ratio (M‐H, Random, 95% CI) | 0.29 [0.16, 0.53] | ||||||||||||||||||||||||||||||||||||||||||||||||||
| 16 Weight gain/Increased appetite Show forest plot | 11 | 2604 | Odds Ratio (M‐H, Random, 95% CI) | 4.23 [2.93, 6.11] | ||||||||||||||||||||||||||||||||||||||||||||||||||
| Analysis 2.16  Comparison 2 Mirtazapine versus SSRIs, Outcome 16 Weight gain/Increased appetite. | ||||||||||||||||||||||||||||||||||||||||||||||||||||||
| 16.1 vs Citalolpram | 1 | 270 | Odds Ratio (M‐H, Random, 95% CI) | 3.83 [1.49, 9.82] | ||||||||||||||||||||||||||||||||||||||||||||||||||
| 16.2 vs Fluoxetine | 4 | 600 | Odds Ratio (M‐H, Random, 95% CI) | 5.23 [2.15, 12.76] | ||||||||||||||||||||||||||||||||||||||||||||||||||
| 16.3 vs Paroxetine | 3 | 726 | Odds Ratio (M‐H, Random, 95% CI) | 3.92 [1.19, 12.92] | ||||||||||||||||||||||||||||||||||||||||||||||||||
| 16.4 vs Sertraline | 2 | 596 | Odds Ratio (M‐H, Random, 95% CI) | 6.67 [3.30, 13.49] | ||||||||||||||||||||||||||||||||||||||||||||||||||
| 16.5 vs Fluvoxamine | 1 | 412 | Odds Ratio (M‐H, Random, 95% CI) | 2.51 [0.87, 7.26] | ||||||||||||||||||||||||||||||||||||||||||||||||||
| 17 Weight loss/Anorexia Show forest plot | 4 | 576 | Odds Ratio (M‐H, Random, 95% CI) | 0.35 [0.10, 1.18] | ||||||||||||||||||||||||||||||||||||||||||||||||||
| Analysis 2.17  Comparison 2 Mirtazapine versus SSRIs, Outcome 17 Weight loss/Anorexia. | ||||||||||||||||||||||||||||||||||||||||||||||||||||||
| 17.1 vs Fluoxetine | 3 | 301 | Odds Ratio (M‐H, Random, 95% CI) | 0.42 [0.11, 1.62] | ||||||||||||||||||||||||||||||||||||||||||||||||||
| 17.2 vs Paroxetine | 1 | 275 | Odds Ratio (M‐H, Random, 95% CI) | 0.14 [0.01, 2.67] | ||||||||||||||||||||||||||||||||||||||||||||||||||
| 18 Sexual dysfunction Show forest plot | 4 | 907 | Odds Ratio (M‐H, Random, 95% CI) | 0.31 [0.13, 0.74] | ||||||||||||||||||||||||||||||||||||||||||||||||||
| Analysis 2.18  Comparison 2 Mirtazapine versus SSRIs, Outcome 18 Sexual dysfunction. | ||||||||||||||||||||||||||||||||||||||||||||||||||||||
| 18.1 vs Fluoxetine | 1 | 36 | Odds Ratio (M‐H, Random, 95% CI) | 0.15 [0.02, 1.47] | ||||||||||||||||||||||||||||||||||||||||||||||||||
| 18.2 vs Paroxetine | 1 | 275 | Odds Ratio (M‐H, Random, 95% CI) | 0.19 [0.06, 0.59] | ||||||||||||||||||||||||||||||||||||||||||||||||||
| 18.3 vs Sertraline | 2 | 596 | Odds Ratio (M‐H, Random, 95% CI) | 0.43 [0.10, 1.82] | ||||||||||||||||||||||||||||||||||||||||||||||||||
| 19 Anxiety/Agitation Show forest plot | 4 | 1134 | Odds Ratio (M‐H, Random, 95% CI) | 1.46 [0.59, 3.65] | ||||||||||||||||||||||||||||||||||||||||||||||||||
| Analysis 2.19  Comparison 2 Mirtazapine versus SSRIs, Outcome 19 Anxiety/Agitation. | ||||||||||||||||||||||||||||||||||||||||||||||||||||||
| 19.1 vs Paroxetine | 2 | 472 | Odds Ratio (M‐H, Random, 95% CI) | 0.71 [0.32, 1.60] | ||||||||||||||||||||||||||||||||||||||||||||||||||
| 19.2 vs Sertraline | 1 | 250 | Odds Ratio (M‐H, Random, 95% CI) | 1.65 [0.69, 3.98] | ||||||||||||||||||||||||||||||||||||||||||||||||||
| 19.3 vs Fluvoxamine | 1 | 412 | Odds Ratio (M‐H, Random, 95% CI) | 5.76 [1.65, 20.07] | ||||||||||||||||||||||||||||||||||||||||||||||||||
| 20 Dizziness/Vertigo/Faintness Show forest plot | 10 | 2568 | Odds Ratio (M‐H, Random, 95% CI) | 1.04 [0.77, 1.41] | ||||||||||||||||||||||||||||||||||||||||||||||||||
| Analysis 2.20  Comparison 2 Mirtazapine versus SSRIs, Outcome 20 Dizziness/Vertigo/Faintness. | ||||||||||||||||||||||||||||||||||||||||||||||||||||||
| 20.1 vs Citalolpram | 1 | 270 | Odds Ratio (M‐H, Random, 95% CI) | 2.03 [0.74, 5.58] | ||||||||||||||||||||||||||||||||||||||||||||||||||
| 20.2 vs Fluoxetine | 3 | 564 | Odds Ratio (M‐H, Random, 95% CI) | 0.92 [0.54, 1.56] | ||||||||||||||||||||||||||||||||||||||||||||||||||
| 20.3 vs Paroxetine | 3 | 726 | Odds Ratio (M‐H, Random, 95% CI) | 0.84 [0.47, 1.50] | ||||||||||||||||||||||||||||||||||||||||||||||||||
| 20.4 vs Sertraline | 2 | 596 | Odds Ratio (M‐H, Random, 95% CI) | 1.16 [0.36, 3.70] | ||||||||||||||||||||||||||||||||||||||||||||||||||
| 20.5 vs Fluvoxamine | 1 | 412 | Odds Ratio (M‐H, Random, 95% CI) | 1.31 [0.69, 2.48] | ||||||||||||||||||||||||||||||||||||||||||||||||||
| 21 Fatigue/Tiredness/Asthenia Show forest plot | 8 | 2137 | Odds Ratio (M‐H, Random, 95% CI) | 1.53 [1.08, 2.15] | ||||||||||||||||||||||||||||||||||||||||||||||||||
| Analysis 2.21  Comparison 2 Mirtazapine versus SSRIs, Outcome 21 Fatigue/Tiredness/Asthenia. | ||||||||||||||||||||||||||||||||||||||||||||||||||||||
| 21.1 vs Citalolpram | 1 | 270 | Odds Ratio (M‐H, Random, 95% CI) | 0.91 [0.44, 1.84] | ||||||||||||||||||||||||||||||||||||||||||||||||||
| 21.2 vs Fluoxetine | 1 | 133 | Odds Ratio (M‐H, Random, 95% CI) | 1.38 [0.30, 6.40] | ||||||||||||||||||||||||||||||||||||||||||||||||||
| 21.3 vs Paroxetine | 3 | 726 | Odds Ratio (M‐H, Random, 95% CI) | 1.71 [0.94, 3.11] | ||||||||||||||||||||||||||||||||||||||||||||||||||
| 21.4 vs Sertraline | 2 | 596 | Odds Ratio (M‐H, Random, 95% CI) | 2.31 [1.32, 4.04] | ||||||||||||||||||||||||||||||||||||||||||||||||||
| 21.5 vs Fluvoxamine | 1 | 412 | Odds Ratio (M‐H, Random, 95% CI) | 0.94 [0.44, 2.00] | ||||||||||||||||||||||||||||||||||||||||||||||||||
| 22 Headache Show forest plot | 11 | 2604 | Odds Ratio (M‐H, Random, 95% CI) | 0.69 [0.56, 0.86] | ||||||||||||||||||||||||||||||||||||||||||||||||||
| Analysis 2.22  Comparison 2 Mirtazapine versus SSRIs, Outcome 22 Headache. | ||||||||||||||||||||||||||||||||||||||||||||||||||||||
| 22.1 vs Citalolpram | 1 | 270 | Odds Ratio (M‐H, Random, 95% CI) | 0.63 [0.30, 1.33] | ||||||||||||||||||||||||||||||||||||||||||||||||||
| 22.2 vs Fluoxetine | 4 | 600 | Odds Ratio (M‐H, Random, 95% CI) | 0.86 [0.54, 1.36] | ||||||||||||||||||||||||||||||||||||||||||||||||||
| 22.3 vs Paroxetine | 3 | 726 | Odds Ratio (M‐H, Random, 95% CI) | 0.57 [0.36, 0.89] | ||||||||||||||||||||||||||||||||||||||||||||||||||
| 22.4 vs Sertraline | 2 | 596 | Odds Ratio (M‐H, Random, 95% CI) | 0.67 [0.44, 1.01] | ||||||||||||||||||||||||||||||||||||||||||||||||||
| 22.5 vs Fluvoxamine | 1 | 412 | Odds Ratio (M‐H, Random, 95% CI) | 0.84 [0.46, 1.53] | ||||||||||||||||||||||||||||||||||||||||||||||||||
| 23 Tremor Show forest plot | 5 | 996 | Odds Ratio (M‐H, Random, 95% CI) | 0.34 [0.18, 0.66] | ||||||||||||||||||||||||||||||||||||||||||||||||||
| Analysis 2.23  Comparison 2 Mirtazapine versus SSRIs, Outcome 23 Tremor. | ||||||||||||||||||||||||||||||||||||||||||||||||||||||
| 23.1 vs Fluoxetine | 3 | 467 | Odds Ratio (M‐H, Random, 95% CI) | 0.42 [0.17, 1.07] | ||||||||||||||||||||||||||||||||||||||||||||||||||
| 23.2 vs Paroxetine | 2 | 529 | Odds Ratio (M‐H, Random, 95% CI) | 0.27 [0.11, 0.70] | ||||||||||||||||||||||||||||||||||||||||||||||||||
| 24 Sleep disturbance Show forest plot | 5 | 1346 | Odds Ratio (M‐H, Random, 95% CI) | 0.52 [0.31, 0.86] | ||||||||||||||||||||||||||||||||||||||||||||||||||
| Analysis 2.24  Comparison 2 Mirtazapine versus SSRIs, Outcome 24 Sleep disturbance. | ||||||||||||||||||||||||||||||||||||||||||||||||||||||
| 24.1 vs Fluoxetine | 1 | 299 | Odds Ratio (M‐H, Random, 95% CI) | 0.53 [0.21, 1.38] | ||||||||||||||||||||||||||||||||||||||||||||||||||
| 24.2 vs Paroxetine | 2 | 451 | Odds Ratio (M‐H, Random, 95% CI) | 0.68 [0.25, 1.85] | ||||||||||||||||||||||||||||||||||||||||||||||||||
| 24.3 vs Sertraline | 2 | 596 | Odds Ratio (M‐H, Random, 95% CI) | 0.37 [0.16, 0.85] | ||||||||||||||||||||||||||||||||||||||||||||||||||
| 25 Sleepiness/Drowsiness/Somnolence Show forest plot | 11 | 2604 | Odds Ratio (M‐H, Random, 95% CI) | 1.81 [1.39, 2.37] | ||||||||||||||||||||||||||||||||||||||||||||||||||
| Analysis 2.25  Comparison 2 Mirtazapine versus SSRIs, Outcome 25 Sleepiness/Drowsiness/Somnolence. | ||||||||||||||||||||||||||||||||||||||||||||||||||||||
| 25.1 vs Citalolpram | 1 | 270 | Odds Ratio (M‐H, Random, 95% CI) | 1.36 [0.53, 3.51] | ||||||||||||||||||||||||||||||||||||||||||||||||||
| 25.2 vs Fluoxetine | 4 | 600 | Odds Ratio (M‐H, Random, 95% CI) | 1.59 [0.97, 2.61] | ||||||||||||||||||||||||||||||||||||||||||||||||||
| 25.3 vs Paroxetine | 3 | 726 | Odds Ratio (M‐H, Random, 95% CI) | 1.24 [0.84, 1.83] | ||||||||||||||||||||||||||||||||||||||||||||||||||
| 25.4 vs Sertraline | 2 | 596 | Odds Ratio (M‐H, Random, 95% CI) | 3.07 [1.89, 4.99] | ||||||||||||||||||||||||||||||||||||||||||||||||||
| 25.5 vs Fluvoxamine | 1 | 412 | Odds Ratio (M‐H, Random, 95% CI) | 2.34 [1.45, 3.77] | ||||||||||||||||||||||||||||||||||||||||||||||||||
| 26 Suicide attempt Show forest plot | 1 | 346 | Odds Ratio (M‐H, Random, 95% CI) | 4.89 [0.23, 102.51] | ||||||||||||||||||||||||||||||||||||||||||||||||||
| Analysis 2.26  Comparison 2 Mirtazapine versus SSRIs, Outcome 26 Suicide attempt. | ||||||||||||||||||||||||||||||||||||||||||||||||||||||
| 26.1 vs Sertraline | 1 | 346 | Odds Ratio (M‐H, Random, 95% CI) | 4.89 [0.23, 102.51] | ||||||||||||||||||||||||||||||||||||||||||||||||||
| 27 Subgroup analysis: Response at 2 weeks: Treatment settings: Outpatients in primary care Show forest plot | 1 | 197 | Odds Ratio (M‐H, Random, 95% CI) | 4.38 [1.69, 11.35] | ||||||||||||||||||||||||||||||||||||||||||||||||||
| Analysis 2.27  Comparison 2 Mirtazapine versus SSRIs, Outcome 27 Subgroup analysis: Response at 2 weeks: Treatment settings: Outpatients in primary care. | ||||||||||||||||||||||||||||||||||||||||||||||||||||||
| 27.1 vs Paroxetine | 1 | 197 | Odds Ratio (M‐H, Random, 95% CI) | 4.38 [1.69, 11.35] | ||||||||||||||||||||||||||||||||||||||||||||||||||
| 28 Subgroup analysis: Response at end of the acute‐phase treatment: Treatment settings: Outpatients in primary care Show forest plot | 1 | 197 | Odds Ratio (M‐H, Random, 95% CI) | 1.17 [0.66, 2.10] | ||||||||||||||||||||||||||||||||||||||||||||||||||
| Analysis 2.28  Comparison 2 Mirtazapine versus SSRIs, Outcome 28 Subgroup analysis: Response at end of the acute‐phase treatment: Treatment settings: Outpatients in primary care. | ||||||||||||||||||||||||||||||||||||||||||||||||||||||
| 28.1 vs Paroxetine | 1 | 197 | Odds Ratio (M‐H, Random, 95% CI) | 1.17 [0.66, 2.10] | ||||||||||||||||||||||||||||||||||||||||||||||||||
| 29 Sensitivity analysis: Response at 2 weeks: Studies without imputation Show forest plot | 11 | 2604 | Odds Ratio (M‐H, Random, 95% CI) | 1.58 [1.31, 1.90] | ||||||||||||||||||||||||||||||||||||||||||||||||||
| Analysis 2.29  Comparison 2 Mirtazapine versus SSRIs, Outcome 29 Sensitivity analysis: Response at 2 weeks: Studies without imputation. | ||||||||||||||||||||||||||||||||||||||||||||||||||||||
| 29.1 vs Citalolpram | 1 | 270 | Odds Ratio (M‐H, Random, 95% CI) | 2.01 [0.93, 4.35] | ||||||||||||||||||||||||||||||||||||||||||||||||||
| 29.2 vs Fluoxetine | 4 | 600 | Odds Ratio (M‐H, Random, 95% CI) | 1.27 [0.86, 1.88] | ||||||||||||||||||||||||||||||||||||||||||||||||||
| 29.3 vs Paroxetine | 3 | 726 | Odds Ratio (M‐H, Random, 95% CI) | 2.39 [1.42, 4.02] | ||||||||||||||||||||||||||||||||||||||||||||||||||
| 29.4 vs Sertraline | 2 | 596 | Odds Ratio (M‐H, Random, 95% CI) | 1.45 [1.04, 2.02] | ||||||||||||||||||||||||||||||||||||||||||||||||||
| 29.5 vs Fluvoxamine | 1 | 412 | Odds Ratio (M‐H, Random, 95% CI) | 1.38 [0.90, 2.13] | ||||||||||||||||||||||||||||||||||||||||||||||||||
| 30 Sensitivity analysis: Response at end of the acute‐phase treatment: Studies without imputation Show forest plot | 11 | 2604 | Odds Ratio (M‐H, Random, 95% CI) | 1.17 [1.00, 1.38] | ||||||||||||||||||||||||||||||||||||||||||||||||||
| Analysis 2.30  Comparison 2 Mirtazapine versus SSRIs, Outcome 30 Sensitivity analysis: Response at end of the acute‐phase treatment: Studies without imputation. | ||||||||||||||||||||||||||||||||||||||||||||||||||||||
| 30.1 vs Citalolpram | 1 | 270 | Odds Ratio (M‐H, Random, 95% CI) | 0.76 [0.38, 1.52] | ||||||||||||||||||||||||||||||||||||||||||||||||||
| 30.2 vs Fluoxetine | 4 | 600 | Odds Ratio (M‐H, Random, 95% CI) | 1.46 [1.04, 2.04] | ||||||||||||||||||||||||||||||||||||||||||||||||||
| 30.3 vs Paroxetine | 3 | 726 | Odds Ratio (M‐H, Random, 95% CI) | 1.27 [0.94, 1.70] | ||||||||||||||||||||||||||||||||||||||||||||||||||
| 30.4 vs Sertraline | 2 | 596 | Odds Ratio (M‐H, Random, 95% CI) | 0.97 [0.70, 1.35] | ||||||||||||||||||||||||||||||||||||||||||||||||||
| 30.5 vs Fluvoxamine | 1 | 412 | Odds Ratio (M‐H, Random, 95% CI) | 1.14 [0.76, 1.70] | ||||||||||||||||||||||||||||||||||||||||||||||||||
| 31 Secondary outcome (SKEWED DATA: depression severity) at 2 weeks Show forest plot | Other data | No numeric data | ||||||||||||||||||||||||||||||||||||||||||||||||||||
| Analysis 2.31
Comparison 2 Mirtazapine versus SSRIs, Outcome 31 Secondary outcome (SKEWED DATA: depression severity) at 2 weeks. | ||||||||||||||||||||||||||||||||||||||||||||||||||||||
| 32 Secondary outcome (SKEWED DATA: depression severity) at end of the acute‐phase treatment Show forest plot | Other data | No numeric data | ||||||||||||||||||||||||||||||||||||||||||||||||||||
| Analysis 2.32
Comparison 2 Mirtazapine versus SSRIs, Outcome 32 Secondary outcome (SKEWED DATA: depression severity) at end of the acute‐phase treatment. | ||||||||||||||||||||||||||||||||||||||||||||||||||||||
| Outcome or subgroup title | No. of studies | No. of participants | Statistical method | Effect size |
| 1 Primary outcome (response) at 2 weeks Show forest plot | 2 | 415 | Odds Ratio (M‐H, Random, 95% CI) | 2.29 [1.45, 3.59] |
| Analysis 3.1  Comparison 3 Mirtazapine versus SNRIs, Outcome 1 Primary outcome (response) at 2 weeks. | ||||
| 1.1 vs Venlafaxine | 2 | 415 | Odds Ratio (M‐H, Random, 95% CI) | 2.29 [1.45, 3.59] |
| 2 Primary outcome (response) at end of the acute‐phase treatment Show forest plot | 2 | 415 | Odds Ratio (M‐H, Random, 95% CI) | 1.53 [1.03, 2.25] |
| Analysis 3.2  Comparison 3 Mirtazapine versus SNRIs, Outcome 2 Primary outcome (response) at end of the acute‐phase treatment. | ||||
| 2.1 vs Venlafaxine | 2 | 415 | Odds Ratio (M‐H, Random, 95% CI) | 1.53 [1.03, 2.25] |
| 3 Secondary outcome (remission) at 2 weeks Show forest plot | 2 | 415 | Odds Ratio (M‐H, Random, 95% CI) | 2.34 [1.07, 5.13] |
| Analysis 3.3  Comparison 3 Mirtazapine versus SNRIs, Outcome 3 Secondary outcome (remission) at 2 weeks. | ||||
| 3.1 vs Venlafaxine | 2 | 415 | Odds Ratio (M‐H, Random, 95% CI) | 2.34 [1.07, 5.13] |
| 4 Secondary outcome (remission) at end of the acute‐phase treatment Show forest plot | 2 | 415 | Odds Ratio (M‐H, Random, 95% CI) | 1.55 [0.98, 2.47] |
| Analysis 3.4  Comparison 3 Mirtazapine versus SNRIs, Outcome 4 Secondary outcome (remission) at end of the acute‐phase treatment. | ||||
| 4.1 vs Venlafaxine | 2 | 415 | Odds Ratio (M‐H, Random, 95% CI) | 1.55 [0.98, 2.47] |
| 5 Secondary outcome (withdrawal due to any reason) Show forest plot | 2 | 415 | Odds Ratio (M‐H, Random, 95% CI) | 0.65 [0.43, 0.99] |
| Analysis 3.5  Comparison 3 Mirtazapine versus SNRIs, Outcome 5 Secondary outcome (withdrawal due to any reason). | ||||
| 5.1 vs Venlafaxine | 2 | 415 | Odds Ratio (M‐H, Random, 95% CI) | 0.65 [0.43, 0.99] |
| 6 Secondary outcome (withdrawal due to adverse events) Show forest plot | 2 | 415 | Odds Ratio (M‐H, Random, 95% CI) | 0.55 [0.24, 1.24] |
| Analysis 3.6  Comparison 3 Mirtazapine versus SNRIs, Outcome 6 Secondary outcome (withdrawal due to adverse events). | ||||
| 6.1 vs Venlafaxine | 2 | 415 | Odds Ratio (M‐H, Random, 95% CI) | 0.55 [0.24, 1.24] |
| 7 Secondary outcome (having some adverse events) Show forest plot | 1 | 157 | Odds Ratio (M‐H, Random, 95% CI) | 1.51 [0.76, 3.00] |
| Analysis 3.7  Comparison 3 Mirtazapine versus SNRIs, Outcome 7 Secondary outcome (having some adverse events). | ||||
| 7.1 vs Venlafaxine | 1 | 157 | Odds Ratio (M‐H, Random, 95% CI) | 1.51 [0.76, 3.00] |
| 8 Hypotension/Bradycardia Show forest plot | 1 | 157 | Odds Ratio (M‐H, Random, 95% CI) | 0.19 [0.02, 1.68] |
| Analysis 3.8  Comparison 3 Mirtazapine versus SNRIs, Outcome 8 Hypotension/Bradycardia. | ||||
| 8.1 vs Venlafaxine | 1 | 157 | Odds Ratio (M‐H, Random, 95% CI) | 0.19 [0.02, 1.68] |
| 9 Sweating Show forest plot | 1 | 157 | Odds Ratio (M‐H, Random, 95% CI) | 0.03 [0.00, 0.45] |
| Analysis 3.9  Comparison 3 Mirtazapine versus SNRIs, Outcome 9 Sweating. | ||||
| 9.1 vs Venlafaxine | 1 | 157 | Odds Ratio (M‐H, Random, 95% CI) | 0.03 [0.00, 0.45] |
| 10 Constipation Show forest plot | 1 | 157 | Odds Ratio (M‐H, Random, 95% CI) | 0.22 [0.06, 0.83] |
| Analysis 3.10  Comparison 3 Mirtazapine versus SNRIs, Outcome 10 Constipation. | ||||
| 10.1 vs Venlafaxine | 1 | 157 | Odds Ratio (M‐H, Random, 95% CI) | 0.22 [0.06, 0.83] |
| 11 Dry mouth/Decreased salivation Show forest plot | 2 | 415 | Odds Ratio (M‐H, Random, 95% CI) | 8.61 [0.35, 211.85] |
| Analysis 3.11  Comparison 3 Mirtazapine versus SNRIs, Outcome 11 Dry mouth/Decreased salivation. | ||||
| 11.1 vs Venlafaxine | 2 | 415 | Odds Ratio (M‐H, Random, 95% CI) | 8.61 [0.35, 211.85] |
| 12 Nausea/Vomiting/Gastric distress Show forest plot | 2 | 415 | Odds Ratio (M‐H, Random, 95% CI) | 0.11 [0.00, 9.34] |
| Analysis 3.12  Comparison 3 Mirtazapine versus SNRIs, Outcome 12 Nausea/Vomiting/Gastric distress. | ||||
| 12.1 vs Venlafaxine | 2 | 415 | Odds Ratio (M‐H, Random, 95% CI) | 0.11 [0.00, 9.34] |
| 13 Anxiety/Agitation Show forest plot | 1 | 157 | Odds Ratio (M‐H, Random, 95% CI) | 1.01 [0.24, 4.20] |
| Analysis 3.13  Comparison 3 Mirtazapine versus SNRIs, Outcome 13 Anxiety/Agitation. | ||||
| 13.1 vs Venlafaxine | 1 | 157 | Odds Ratio (M‐H, Random, 95% CI) | 1.01 [0.24, 4.20] |
| 14 Fatigue/Tiredness/Asthenia Show forest plot | 1 | 258 | Odds Ratio (M‐H, Random, 95% CI) | 2.43 [1.30, 4.55] |
| Analysis 3.14  Comparison 3 Mirtazapine versus SNRIs, Outcome 14 Fatigue/Tiredness/Asthenia. | ||||
| 14.1 vs Venlafaxine | 1 | 258 | Odds Ratio (M‐H, Random, 95% CI) | 2.43 [1.30, 4.55] |
| 15 Headache Show forest plot | 2 | 415 | Odds Ratio (M‐H, Random, 95% CI) | 0.95 [0.53, 1.72] |
| Analysis 3.15  Comparison 3 Mirtazapine versus SNRIs, Outcome 15 Headache. | ||||
| 15.1 vs Venlafaxine | 2 | 415 | Odds Ratio (M‐H, Random, 95% CI) | 0.95 [0.53, 1.72] |
| 16 Sleep disturbance Show forest plot | 1 | 258 | Odds Ratio (M‐H, Random, 95% CI) | 0.02 [0.00, 0.41] |
| Analysis 3.16  Comparison 3 Mirtazapine versus SNRIs, Outcome 16 Sleep disturbance. | ||||
| 16.1 vs Venlafaxine | 1 | 258 | Odds Ratio (M‐H, Random, 95% CI) | 0.02 [0.00, 0.41] |
| 17 Sleepiness/Drowsiness/Somnolence Show forest plot | 1 | 157 | Odds Ratio (M‐H, Random, 95% CI) | 1.56 [0.42, 5.77] |
| Analysis 3.17  Comparison 3 Mirtazapine versus SNRIs, Outcome 17 Sleepiness/Drowsiness/Somnolence. | ||||
| 17.1 vs Venlafaxine | 1 | 157 | Odds Ratio (M‐H, Random, 95% CI) | 1.56 [0.42, 5.77] |
| 18 Completed suicide Show forest plot | 1 | 157 | Odds Ratio (M‐H, Random, 95% CI) | 0.33 [0.01, 8.31] |
| Analysis 3.18  Comparison 3 Mirtazapine versus SNRIs, Outcome 18 Completed suicide. | ||||
| 18.1 vs Venlafaxine | 1 | 157 | Odds Ratio (M‐H, Random, 95% CI) | 0.33 [0.01, 8.31] |
| Outcome or subgroup title | No. of studies | No. of participants | Statistical method | Effect size |
| 1 Primary outcome (response) at 2 weeks Show forest plot | 2 | 300 | Odds Ratio (M‐H, Random, 95% CI) | 1.14 [0.64, 2.04] |
| Analysis 4.1  Comparison 4 Mirtazapine versus heterocyclic antidepressants, Outcome 1 Primary outcome (response) at 2 weeks. | ||||
| 1.1 vs Trazodone | 2 | 300 | Odds Ratio (M‐H, Random, 95% CI) | 1.14 [0.64, 2.04] |
| 2 Primary outcome (response) at end of the acute‐phase treatment Show forest plot | 2 | 300 | Odds Ratio (M‐H, Random, 95% CI) | 1.50 [0.95, 2.37] |
| Analysis 4.2  Comparison 4 Mirtazapine versus heterocyclic antidepressants, Outcome 2 Primary outcome (response) at end of the acute‐phase treatment. | ||||
| 2.1 vs Trazodone | 2 | 300 | Odds Ratio (M‐H, Random, 95% CI) | 1.50 [0.95, 2.37] |
| 3 Secondary outcome (remission) at 2 weeks Show forest plot | 2 | 300 | Odds Ratio (M‐H, Random, 95% CI) | 1.0 [0.36, 2.80] |
| Analysis 4.3  Comparison 4 Mirtazapine versus heterocyclic antidepressants, Outcome 3 Secondary outcome (remission) at 2 weeks. | ||||
| 3.1 vs Trazodone | 2 | 300 | Odds Ratio (M‐H, Random, 95% CI) | 1.0 [0.36, 2.80] |
| 4 Secondary outcome (remission) at end of the acute‐phase treatment Show forest plot | 2 | 300 | Odds Ratio (M‐H, Random, 95% CI) | 1.38 [0.76, 2.52] |
| Analysis 4.4  Comparison 4 Mirtazapine versus heterocyclic antidepressants, Outcome 4 Secondary outcome (remission) at end of the acute‐phase treatment. | ||||
| 4.1 vs Trazodone | 2 | 300 | Odds Ratio (M‐H, Random, 95% CI) | 1.38 [0.76, 2.52] |
| 5 Secondary outcome (withdrawal due to any reason) Show forest plot | 2 | 300 | Odds Ratio (M‐H, Random, 95% CI) | 0.90 [0.47, 1.72] |
| Analysis 4.5  Comparison 4 Mirtazapine versus heterocyclic antidepressants, Outcome 5 Secondary outcome (withdrawal due to any reason). | ||||
| 5.1 vs Trazodone | 2 | 300 | Odds Ratio (M‐H, Random, 95% CI) | 0.90 [0.47, 1.72] |
| 6 Secondary outcome (withdrawal due to adverse events) Show forest plot | 2 | 300 | Odds Ratio (M‐H, Random, 95% CI) | 0.61 [0.25, 1.51] |
| Analysis 4.6  Comparison 4 Mirtazapine versus heterocyclic antidepressants, Outcome 6 Secondary outcome (withdrawal due to adverse events). | ||||
| 6.1 vs Trazodone | 2 | 300 | Odds Ratio (M‐H, Random, 95% CI) | 0.61 [0.25, 1.51] |
| 7 Hypertension/Tachycardia Show forest plot | 1 | 100 | Odds Ratio (M‐H, Random, 95% CI) | 0.31 [0.06, 1.59] |
| Analysis 4.7  Comparison 4 Mirtazapine versus heterocyclic antidepressants, Outcome 7 Hypertension/Tachycardia. | ||||
| 7.1 vs Trazodone | 1 | 100 | Odds Ratio (M‐H, Random, 95% CI) | 0.31 [0.06, 1.59] |
| 8 Hypotension/Bradycardia Show forest plot | 2 | 300 | Odds Ratio (M‐H, Random, 95% CI) | 0.17 [0.03, 1.00] |
| Analysis 4.8  Comparison 4 Mirtazapine versus heterocyclic antidepressants, Outcome 8 Hypotension/Bradycardia. | ||||
| 8.1 vs Trazodone | 2 | 300 | Odds Ratio (M‐H, Random, 95% CI) | 0.17 [0.03, 1.00] |
| 9 Constipation Show forest plot | 1 | 100 | Odds Ratio (M‐H, Random, 95% CI) | 0.70 [0.26, 1.83] |
| Analysis 4.9  Comparison 4 Mirtazapine versus heterocyclic antidepressants, Outcome 9 Constipation. | ||||
| 9.1 vs Trazodone | 1 | 100 | Odds Ratio (M‐H, Random, 95% CI) | 0.70 [0.26, 1.83] |
| 10 Dry mouth/Decreased salivation Show forest plot | 2 | 300 | Odds Ratio (M‐H, Random, 95% CI) | 0.39 [0.11, 1.37] |
| Analysis 4.10  Comparison 4 Mirtazapine versus heterocyclic antidepressants, Outcome 10 Dry mouth/Decreased salivation. | ||||
| 10.1 vs Trazodone | 2 | 300 | Odds Ratio (M‐H, Random, 95% CI) | 0.39 [0.11, 1.37] |
| 11 Nausea/Vomiting/Gastric distress Show forest plot | 1 | 100 | Odds Ratio (M‐H, Random, 95% CI) | 0.68 [0.20, 2.32] |
| Analysis 4.11  Comparison 4 Mirtazapine versus heterocyclic antidepressants, Outcome 11 Nausea/Vomiting/Gastric distress. | ||||
| 11.1 vs Trazodone | 1 | 100 | Odds Ratio (M‐H, Random, 95% CI) | 0.68 [0.20, 2.32] |
| 12 Weight gain/Increased appetite Show forest plot | 1 | 100 | Odds Ratio (M‐H, Random, 95% CI) | 4.95 [1.30, 18.81] |
| Analysis 4.12  Comparison 4 Mirtazapine versus heterocyclic antidepressants, Outcome 12 Weight gain/Increased appetite. | ||||
| 12.1 vs Trazodone | 1 | 100 | Odds Ratio (M‐H, Random, 95% CI) | 4.95 [1.30, 18.81] |
| 13 Weight loss/Anorexia Show forest plot | 1 | 100 | Odds Ratio (M‐H, Random, 95% CI) | 0.33 [0.01, 8.21] |
| Analysis 4.13  Comparison 4 Mirtazapine versus heterocyclic antidepressants, Outcome 13 Weight loss/Anorexia. | ||||
| 13.1 vs Trazodone | 1 | 100 | Odds Ratio (M‐H, Random, 95% CI) | 0.33 [0.01, 8.21] |
| 14 Anxiety/Agitation Show forest plot | 2 | 300 | Odds Ratio (M‐H, Random, 95% CI) | 0.62 [0.19, 1.96] |
| Analysis 4.14  Comparison 4 Mirtazapine versus heterocyclic antidepressants, Outcome 14 Anxiety/Agitation. | ||||
| 14.1 vs Trazodone | 2 | 300 | Odds Ratio (M‐H, Random, 95% CI) | 0.62 [0.19, 1.96] |
| 15 Dizziness/Vertigo/Faintness Show forest plot | 2 | 300 | Odds Ratio (M‐H, Random, 95% CI) | 0.64 [0.30, 1.39] |
| Analysis 4.15  Comparison 4 Mirtazapine versus heterocyclic antidepressants, Outcome 15 Dizziness/Vertigo/Faintness. | ||||
| 15.1 vs Trazodone | 2 | 300 | Odds Ratio (M‐H, Random, 95% CI) | 0.64 [0.30, 1.39] |
| 16 Headache Show forest plot | 1 | 100 | Odds Ratio (M‐H, Random, 95% CI) | 0.65 [0.23, 1.87] |
| Analysis 4.16  Comparison 4 Mirtazapine versus heterocyclic antidepressants, Outcome 16 Headache. | ||||
| 16.1 vs Trazodone | 1 | 100 | Odds Ratio (M‐H, Random, 95% CI) | 0.65 [0.23, 1.87] |
| 17 Sleep disturbance Show forest plot | 1 | 200 | Odds Ratio (M‐H, Random, 95% CI) | 0.42 [0.13, 1.42] |
| Analysis 4.17  Comparison 4 Mirtazapine versus heterocyclic antidepressants, Outcome 17 Sleep disturbance. | ||||
| 17.1 vs Trazodone | 1 | 200 | Odds Ratio (M‐H, Random, 95% CI) | 0.42 [0.13, 1.42] |
| 18 Sleepiness/Drowsiness/Somnolence Show forest plot | 2 | 300 | Odds Ratio (M‐H, Random, 95% CI) | 0.62 [0.29, 1.36] |
| Analysis 4.18  Comparison 4 Mirtazapine versus heterocyclic antidepressants, Outcome 18 Sleepiness/Drowsiness/Somnolence. | ||||
| 18.1 vs Trazodone | 2 | 300 | Odds Ratio (M‐H, Random, 95% CI) | 0.62 [0.29, 1.36] |
| 19 Completed suicide Show forest plot | 1 | 200 | Odds Ratio (M‐H, Random, 95% CI) | 3.03 [0.12, 75.28] |
| Analysis 4.19  Comparison 4 Mirtazapine versus heterocyclic antidepressants, Outcome 19 Completed suicide. | ||||
| 19.1 vs Trazodone | 1 | 200 | Odds Ratio (M‐H, Random, 95% CI) | 3.03 [0.12, 75.28] |
| 20 Suicide attempt Show forest plot | 1 | 200 | Odds Ratio (M‐H, Random, 95% CI) | 2.02 [0.18, 22.65] |
| Analysis 4.20  Comparison 4 Mirtazapine versus heterocyclic antidepressants, Outcome 20 Suicide attempt. | ||||
| 20.1 vs Trazodone | 1 | 200 | Odds Ratio (M‐H, Random, 95% CI) | 2.02 [0.18, 22.65] |
| Outcome or subgroup title | No. of studies | No. of participants | Statistical method | Effect size | ||||||||||||||||||||||||||||||
| 1 Primary outcome (response) at 2 weeks Show forest plot | 1 | 40 | Odds Ratio (M‐H, Random, 95% CI) | 1.0 [0.18, 5.67] | ||||||||||||||||||||||||||||||
| Analysis 5.1  Comparison 5 Mirtazapine versus newer antidepressants, Outcome 1 Primary outcome (response) at 2 weeks. | ||||||||||||||||||||||||||||||||||
| 1.1 vs Reboxetine | 1 | 40 | Odds Ratio (M‐H, Random, 95% CI) | 1.0 [0.18, 5.67] | ||||||||||||||||||||||||||||||
| 2 Primary outcome (response) at end of the acute‐phase treatment Show forest plot | 1 | 40 | Odds Ratio (M‐H, Random, 95% CI) | 1.0 [0.27, 3.67] | ||||||||||||||||||||||||||||||
| Analysis 5.2  Comparison 5 Mirtazapine versus newer antidepressants, Outcome 2 Primary outcome (response) at end of the acute‐phase treatment. | ||||||||||||||||||||||||||||||||||
| 2.1 vs Reboxetine | 1 | 40 | Odds Ratio (M‐H, Random, 95% CI) | 1.0 [0.27, 3.67] | ||||||||||||||||||||||||||||||
| 3 Secondary outcome (remission) at 2 weeks Show forest plot | 1 | 40 | Odds Ratio (M‐H, Random, 95% CI) | 1.0 [0.06, 17.18] | ||||||||||||||||||||||||||||||
| Analysis 5.3  Comparison 5 Mirtazapine versus newer antidepressants, Outcome 3 Secondary outcome (remission) at 2 weeks. | ||||||||||||||||||||||||||||||||||
| 3.1 vs Reboxetine | 1 | 40 | Odds Ratio (M‐H, Random, 95% CI) | 1.0 [0.06, 17.18] | ||||||||||||||||||||||||||||||
| 4 Secondary outcome (remission) at end of the acute‐phase treatment Show forest plot | 1 | 40 | Odds Ratio (M‐H, Random, 95% CI) | 1.26 [0.33, 4.73] | ||||||||||||||||||||||||||||||
| Analysis 5.4  Comparison 5 Mirtazapine versus newer antidepressants, Outcome 4 Secondary outcome (remission) at end of the acute‐phase treatment. | ||||||||||||||||||||||||||||||||||
| 4.1 vs Reboxetine | 1 | 40 | Odds Ratio (M‐H, Random, 95% CI) | 1.26 [0.33, 4.73] | ||||||||||||||||||||||||||||||
| 5 Secondary outcome (depression severity) at 2 weeks Show forest plot | 1 | 40 | Std. Mean Difference (IV, Random, 95% CI) | ‐0.37 [‐1.00, 0.25] | ||||||||||||||||||||||||||||||
| Analysis 5.5  Comparison 5 Mirtazapine versus newer antidepressants, Outcome 5 Secondary outcome (depression severity) at 2 weeks. | ||||||||||||||||||||||||||||||||||
| 5.1 vs Reboxetine | 1 | 40 | Std. Mean Difference (IV, Random, 95% CI) | ‐0.37 [‐1.00, 0.25] | ||||||||||||||||||||||||||||||
| 6 Secondary outcome (withdrawal due to any reason) Show forest plot | 2 | 80 | Odds Ratio (M‐H, Random, 95% CI) | 0.0 [0.0, 0.0] | ||||||||||||||||||||||||||||||
| Analysis 5.6  Comparison 5 Mirtazapine versus newer antidepressants, Outcome 6 Secondary outcome (withdrawal due to any reason). | ||||||||||||||||||||||||||||||||||
| 6.1 vs Reboxetine | 2 | 80 | Odds Ratio (M‐H, Random, 95% CI) | 0.0 [0.0, 0.0] | ||||||||||||||||||||||||||||||
| 7 Secondary outcome (withdrawal due to adverse events) Show forest plot | 2 | 80 | Odds Ratio (M‐H, Random, 95% CI) | 0.0 [0.0, 0.0] | ||||||||||||||||||||||||||||||
| Analysis 5.7  Comparison 5 Mirtazapine versus newer antidepressants, Outcome 7 Secondary outcome (withdrawal due to adverse events). | ||||||||||||||||||||||||||||||||||
| 7.1 vs Reboxetine | 2 | 80 | Odds Ratio (M‐H, Random, 95% CI) | 0.0 [0.0, 0.0] | ||||||||||||||||||||||||||||||
| 8 Secondary outcome (SKEWED DATA: depression severity) at end of the acute‐phase treatment Show forest plot | Other data | No numeric data | ||||||||||||||||||||||||||||||||
| Analysis 5.8
Comparison 5 Mirtazapine versus newer antidepressants, Outcome 8 Secondary outcome (SKEWED DATA: depression severity) at end of the acute‐phase treatment. | ||||||||||||||||||||||||||||||||||
| Outcome or subgroup title | No. of studies | No. of participants | Statistical method | Effect size |
| 1 vs all compounds Show forest plot | 26 | 4882 | Risk Ratio (M‐H, Fixed, 99% CI) | 1.05 [0.99, 1.12] |
| Analysis 6.1  Comparison 6 Funnel plot analysis: primary outcome (response) at end of the acute‐phase treatment, Outcome 1 vs all compounds. | ||||
| 1.1 vs Amitriptyline | 6 | 929 | Risk Ratio (M‐H, Fixed, 99% CI) | 0.95 [0.82, 1.11] |
| 1.2 vs Clomipramine | 1 | 174 | Risk Ratio (M‐H, Fixed, 99% CI) | 0.97 [0.74, 1.26] |
| 1.3 vs Doxepin | 1 | 163 | Risk Ratio (M‐H, Fixed, 99% CI) | 0.95 [0.71, 1.26] |
| 1.4 vs Nortriptyline | 1 | 235 | Risk Ratio (M‐H, Fixed, 99% CI) | 0.94 [0.59, 1.49] |
| 1.5 vs Citalolpram | 1 | 270 | Risk Ratio (M‐H, Fixed, 99% CI) | 0.96 [0.85, 1.09] |
| 1.6 vs Fluoxetine | 5 | 622 | Risk Ratio (M‐H, Fixed, 99% CI) | 1.18 [1.00, 1.39] |
| 1.7 vs Paroxetine | 3 | 726 | Risk Ratio (M‐H, Fixed, 99% CI) | 1.13 [0.93, 1.38] |
| 1.8 vs Sertraline | 2 | 596 | Risk Ratio (M‐H, Fixed, 99% CI) | 0.99 [0.83, 1.17] |
| 1.9 vs Fluvoxamine | 1 | 412 | Risk Ratio (M‐H, Fixed, 99% CI) | 1.05 [0.86, 1.28] |
| 1.10 vs Venlafaxine | 2 | 415 | Risk Ratio (M‐H, Fixed, 99% CI) | 1.24 [0.96, 1.60] |
| 1.11 vs Trazodone | 2 | 300 | Risk Ratio (M‐H, Fixed, 99% CI) | 1.21 [0.91, 1.61] |
| 1.12 vs Reboxetine | 1 | 40 | Risk Ratio (M‐H, Fixed, 99% CI) | 1.0 [0.55, 1.82] |
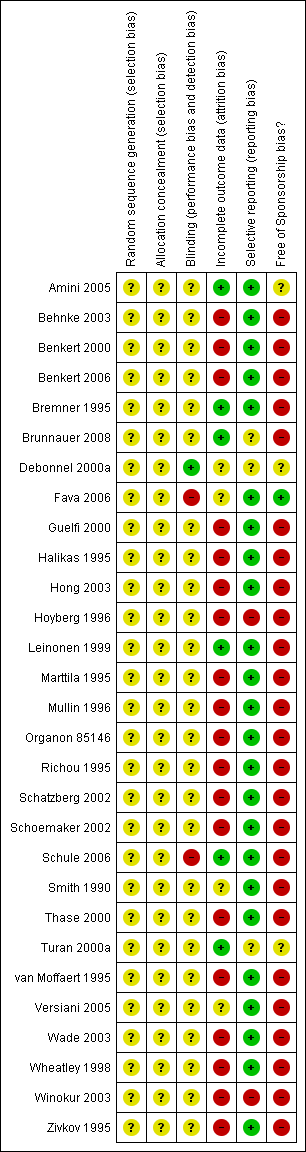
Methodological quality summary: review authors' judgements about each methodological quality item for each included study.
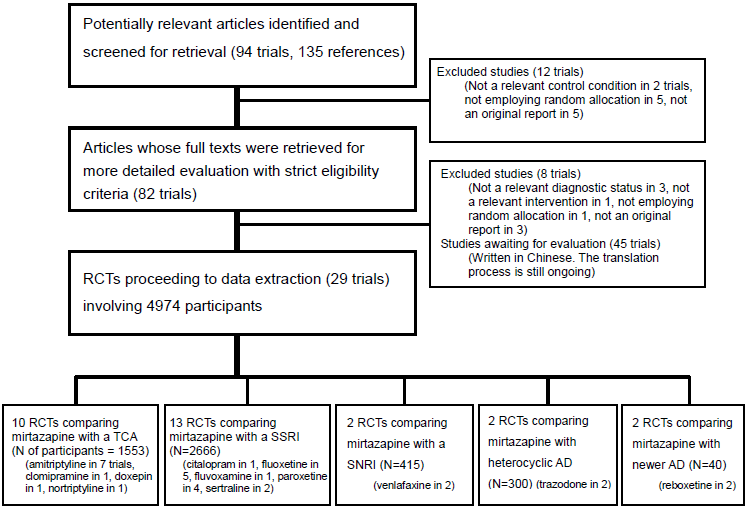

Methodological quality graph: review authors' judgements about each methodological quality item presented as percentages across all included studies.
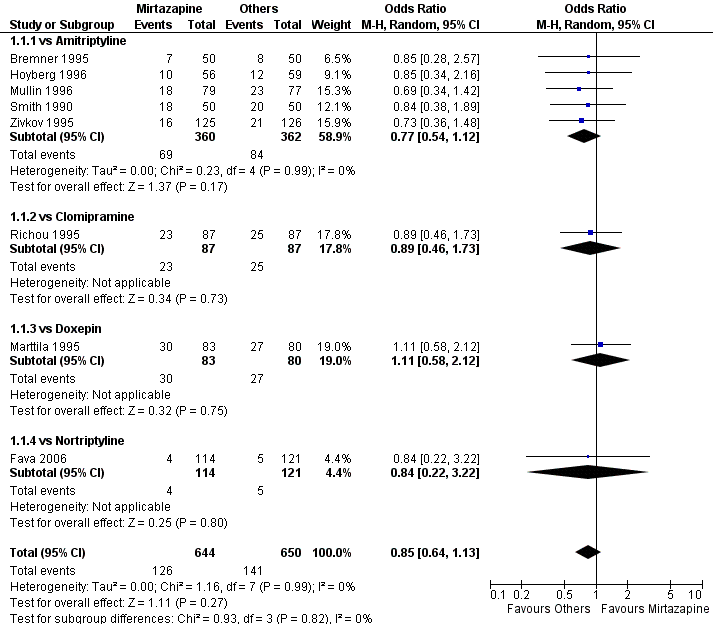
Forest plot of comparison: 1 MIRTAZAPINE vs TCAs, outcome: 1.1 Primary outcome (response) at 2 weeks.

Forest plot of comparison: 1 MIRTAZAPINE vs TCAs, outcome: 1.2 Primary outcome (response) at end of the acute‐phase treatment.
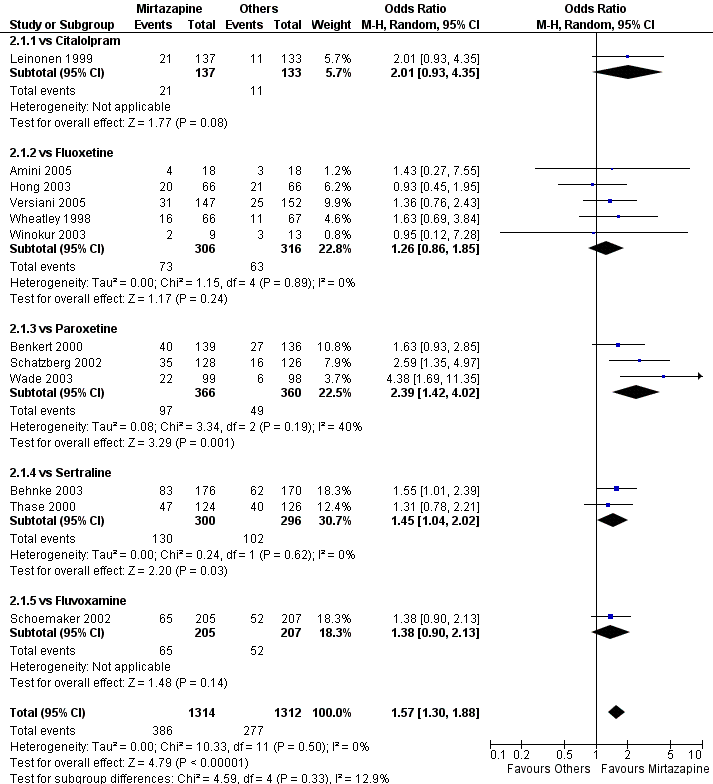
Forest plot of comparison: 2 MIRTAZAPINE vs SSRIs, outcome: 2.1 Primary outcome (response) at 2 weeks.

Forest plot of comparison: 2 MIRTAZAPINE vs SSRIs, outcome: 2.2 Primary outcome (response) at end of the acute‐phase treatment.

Funnel plot of comparison: 6 Funnel plot analysis: Primary outcome (response) at end of the acute‐phase treatment, outcome: 6.1 vs all compounds.
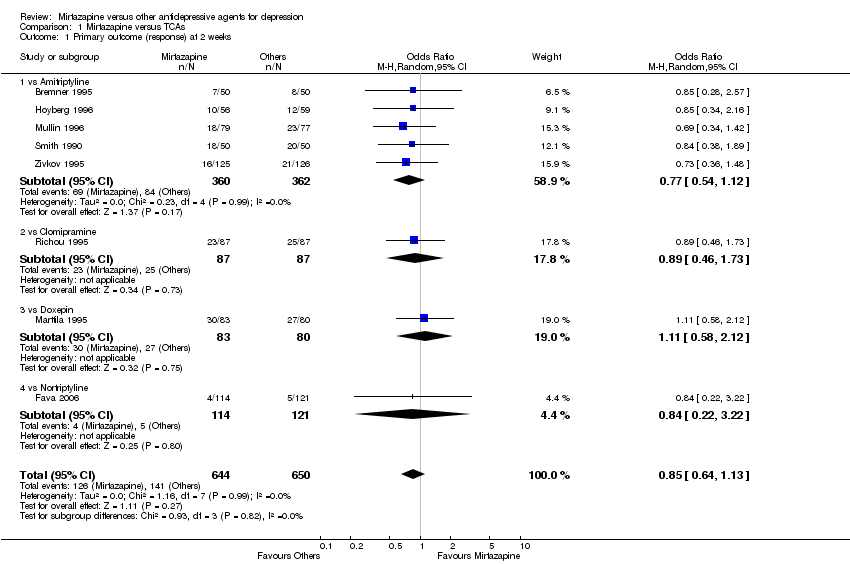
Comparison 1 Mirtazapine versus TCAs, Outcome 1 Primary outcome (response) at 2 weeks.

Comparison 1 Mirtazapine versus TCAs, Outcome 2 Primary outcome (response) at end of the acute‐phase treatment.

Comparison 1 Mirtazapine versus TCAs, Outcome 3 Secondary outcome (remission) at 2 weeks.

Comparison 1 Mirtazapine versus TCAs, Outcome 4 Secondary outcome (remission) at end of the acute‐phase treatment.

Comparison 1 Mirtazapine versus TCAs, Outcome 5 Secondary outcome (depression severity) at 2 weeks.

Comparison 1 Mirtazapine versus TCAs, Outcome 6 Secondary outcome (depression severity) at end of the acute‐phase treatment.

Comparison 1 Mirtazapine versus TCAs, Outcome 7 Secondary outcome (Social adjustment) at 2 weeks.

Comparison 1 Mirtazapine versus TCAs, Outcome 8 Secondary outcome (Social adjustment) at end of the acute‐phase treatment.

Comparison 1 Mirtazapine versus TCAs, Outcome 9 Secondary outcome (withdrawal due to any reason).

Comparison 1 Mirtazapine versus TCAs, Outcome 10 Secondary outcome (withdrawal due to adverse events).
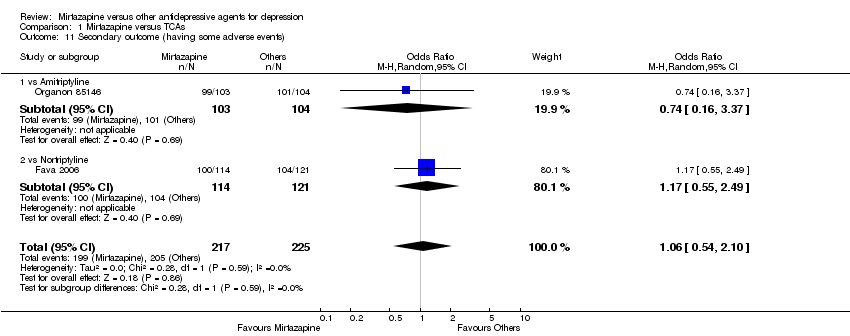
Comparison 1 Mirtazapine versus TCAs, Outcome 11 Secondary outcome (having some adverse events).
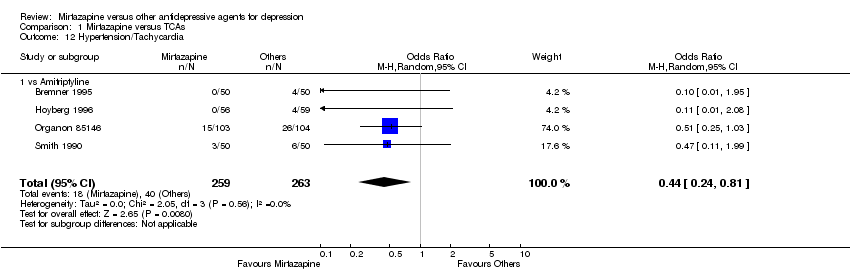
Comparison 1 Mirtazapine versus TCAs, Outcome 12 Hypertension/Tachycardia.

Comparison 1 Mirtazapine versus TCAs, Outcome 13 Hypotension/Bradycardia.

Comparison 1 Mirtazapine versus TCAs, Outcome 14 Sweating.

Comparison 1 Mirtazapine versus TCAs, Outcome 15 Constipation.

Comparison 1 Mirtazapine versus TCAs, Outcome 16 Dry mouth/Decreased salivation.

Comparison 1 Mirtazapine versus TCAs, Outcome 17 Nausea/Vomiting/Gastric distress.
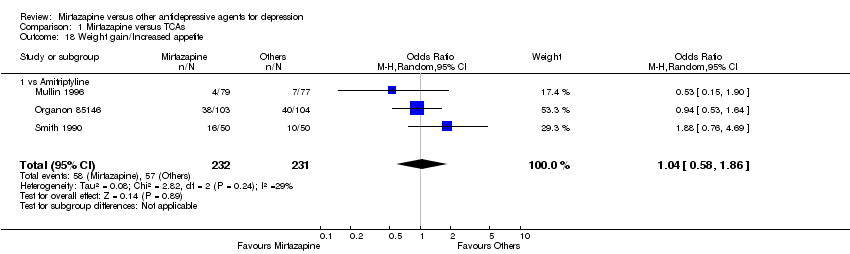
Comparison 1 Mirtazapine versus TCAs, Outcome 18 Weight gain/Increased appetite.
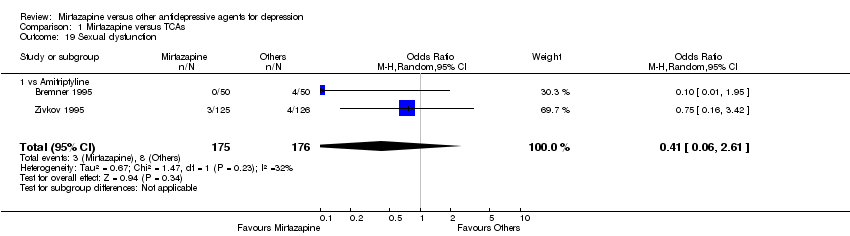
Comparison 1 Mirtazapine versus TCAs, Outcome 19 Sexual dysfunction.
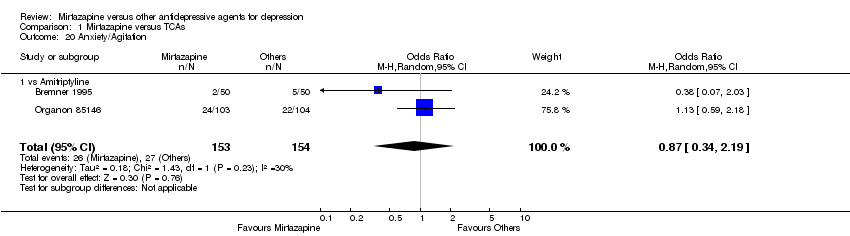
Comparison 1 Mirtazapine versus TCAs, Outcome 20 Anxiety/Agitation.
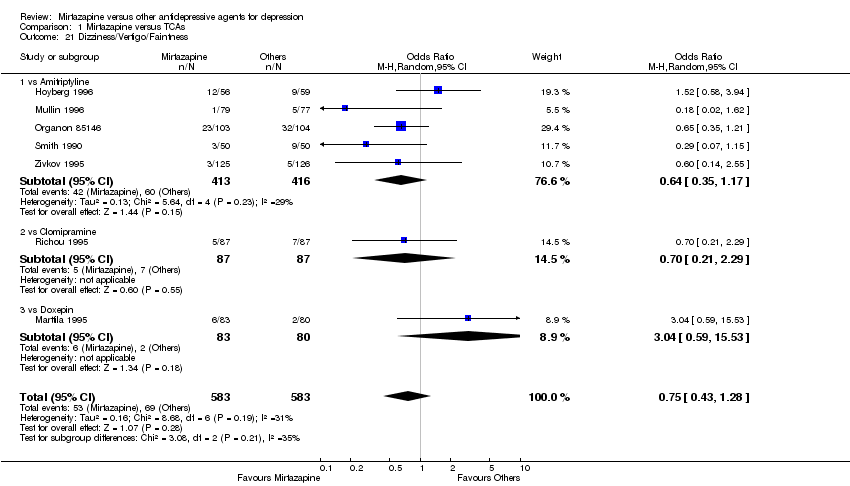
Comparison 1 Mirtazapine versus TCAs, Outcome 21 Dizziness/Vertigo/Faintness.
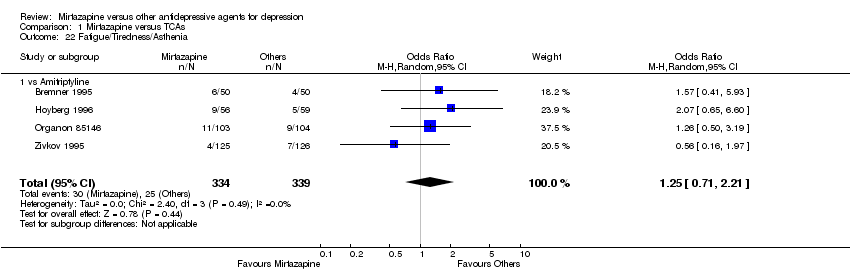
Comparison 1 Mirtazapine versus TCAs, Outcome 22 Fatigue/Tiredness/Asthenia.

Comparison 1 Mirtazapine versus TCAs, Outcome 23 Headache.

Comparison 1 Mirtazapine versus TCAs, Outcome 24 Tremor.
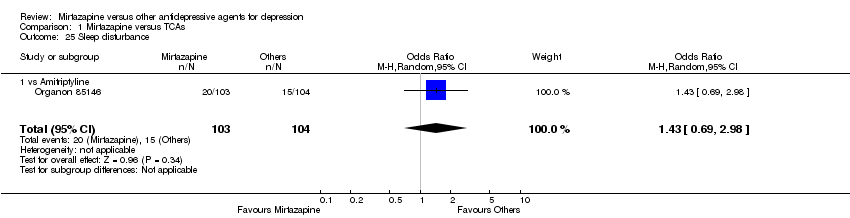
Comparison 1 Mirtazapine versus TCAs, Outcome 25 Sleep disturbance.
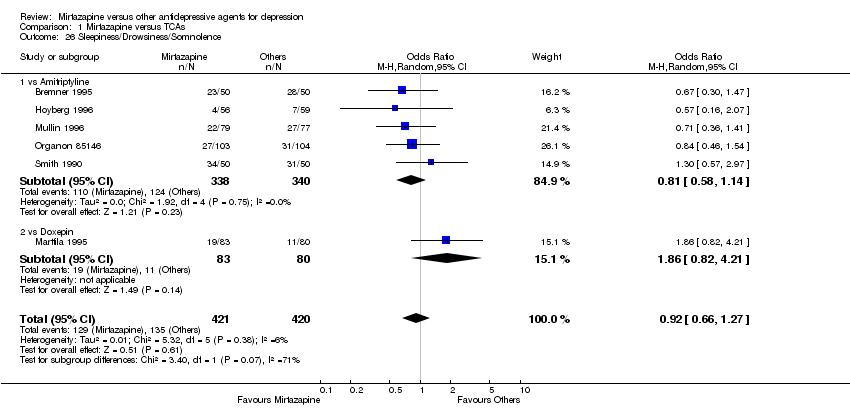
Comparison 1 Mirtazapine versus TCAs, Outcome 26 Sleepiness/Drowsiness/Somnolence.
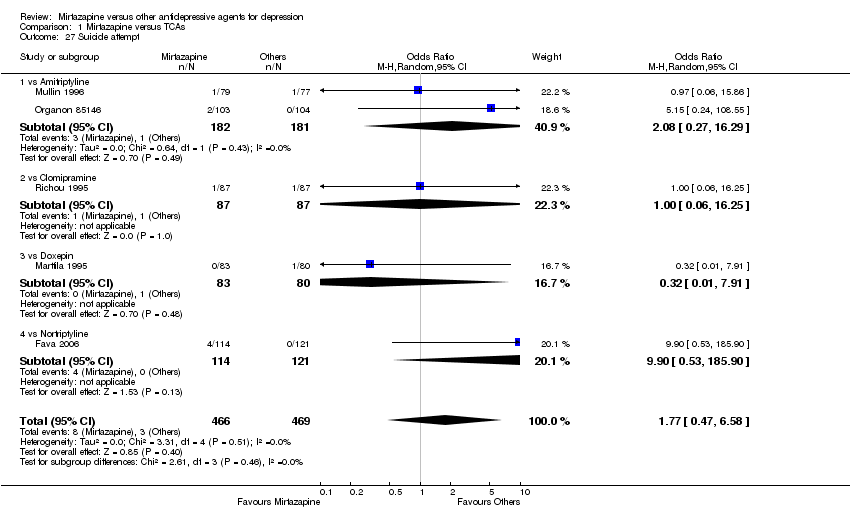
Comparison 1 Mirtazapine versus TCAs, Outcome 27 Suicide attempt.

Comparison 1 Mirtazapine versus TCAs, Outcome 28 Subgroup analysis: Response at 2 weeks: Treatment settings: Psychiatric inpatients.
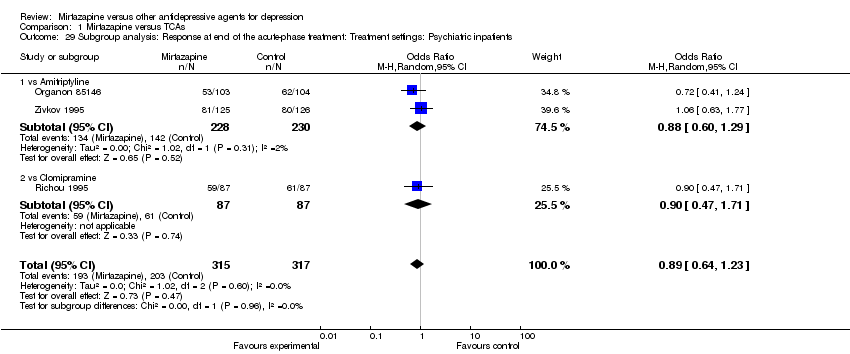
Comparison 1 Mirtazapine versus TCAs, Outcome 29 Subgroup analysis: Response at end of the acute‐phase treatment: Treatment settings: Psychiatric inpatients.

Comparison 1 Mirtazapine versus TCAs, Outcome 30 Sensitivity analysis: Response at 2 weeks: Studies without imputation.
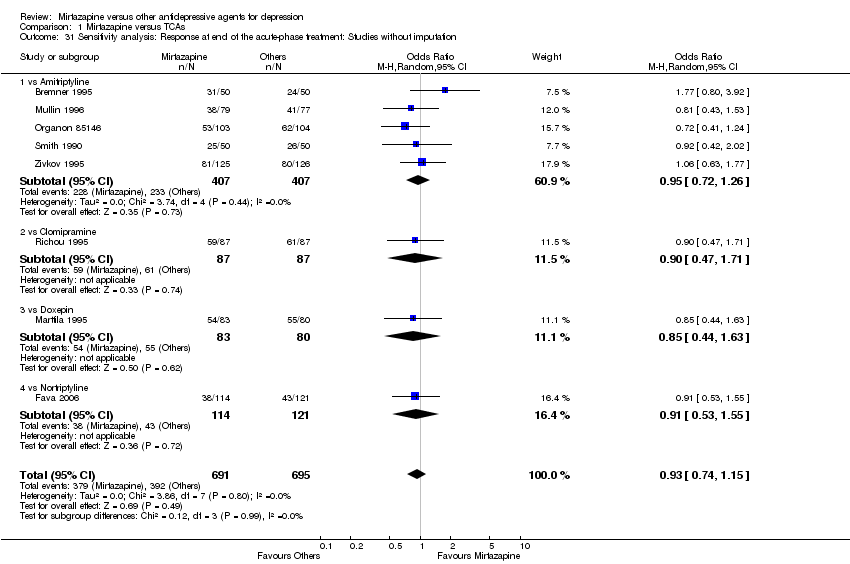
Comparison 1 Mirtazapine versus TCAs, Outcome 31 Sensitivity analysis: Response at end of the acute‐phase treatment: Studies without imputation.
| Study | Comparator drug | Measurement | Mirtazapine: mean | SD | N | Comparator: mean | SD | N | note |
| Hoyberg 1996 | Amitriptyline | HAMD‐21 change score | ‐4.7 | 4.5 | 54 | ‐5.2 | 4.4 | 59 | |
Comparison 1 Mirtazapine versus TCAs, Outcome 32 Secondary outcome (SKEWED DATA: depression severity) at 2 weeks.
| Study | Comparator | Measurement | Mirtazapine: mean | SD | N | Comparator: mean | SD | N | Note |
| Hoyberg 1996 | Amitriptyline | HAMD‐21 change score | ‐11.1 | 7.9 | 54 | ‐13.1 | 7.5 | 59 | |
| Marttila 1995 | Doxepin | HAMD‐17 | 9.15 | 7.5 | 83 | 9.0 | 6.35 | 80 | |
| Mullin 1996 | Amitriptyline | HAMD‐17 | 11.7 | 7.3 | 71 | 10.7 | 6.8 | 71 | |
| Zivkov 1995 | Amitriptyline | HAMD‐21 | 12.8 | 10.1 | 113 | 12.0 | 10.0 | 111 | |
Comparison 1 Mirtazapine versus TCAs, Outcome 33 Secondary outcome (SKEWED DATA: depression severity) at end of the acute‐phase treatment.

Comparison 2 Mirtazapine versus SSRIs, Outcome 1 Primary outcome (response) at 2 weeks.
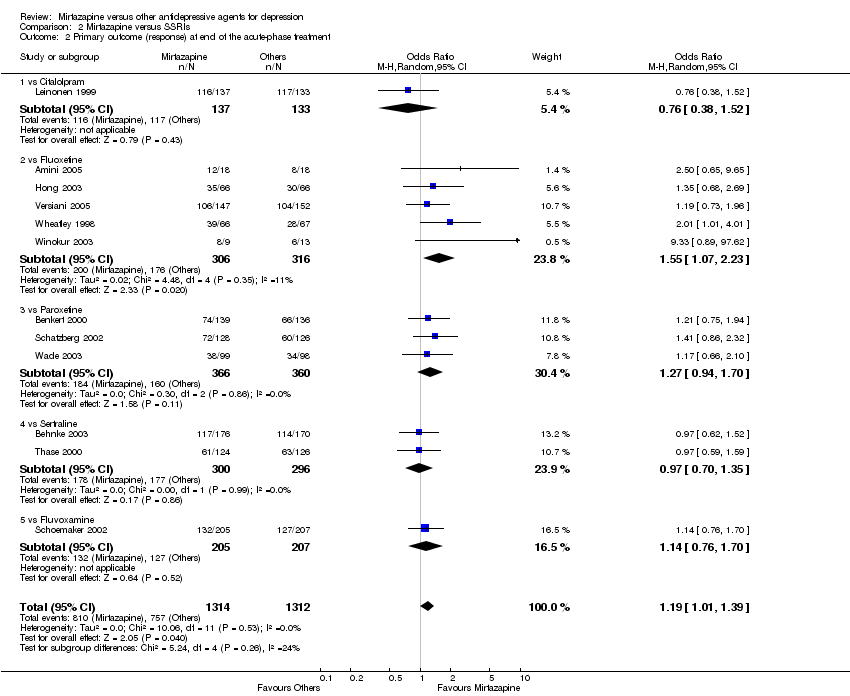
Comparison 2 Mirtazapine versus SSRIs, Outcome 2 Primary outcome (response) at end of the acute‐phase treatment.
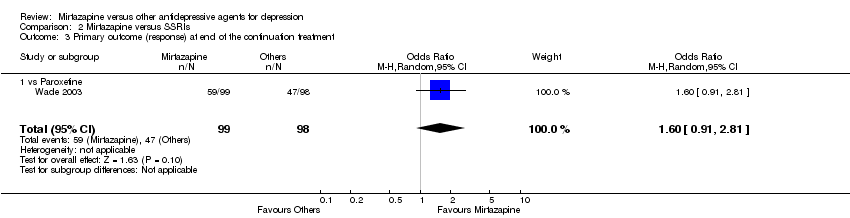
Comparison 2 Mirtazapine versus SSRIs, Outcome 3 Primary outcome (response) at end of the continuation treatment.
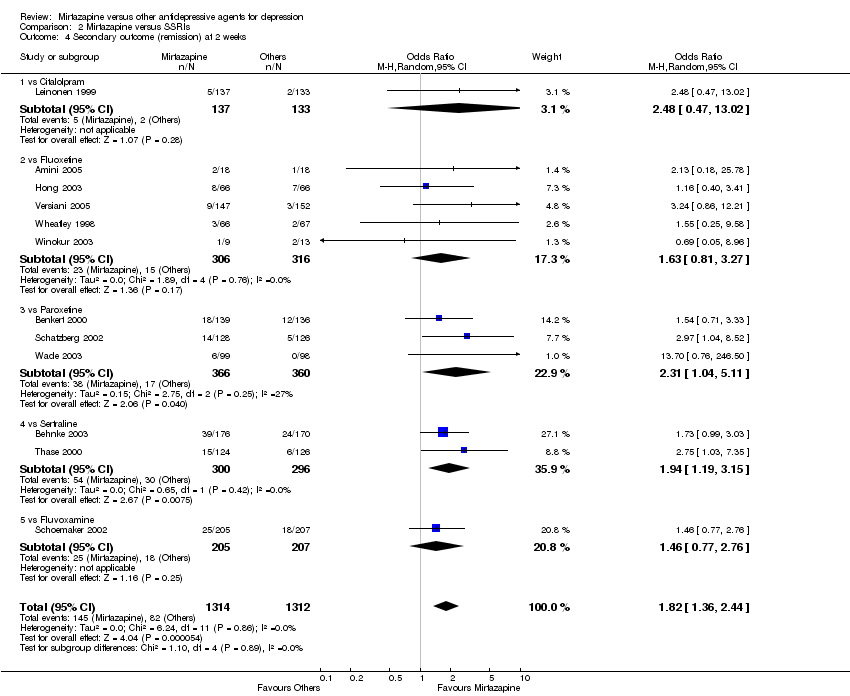
Comparison 2 Mirtazapine versus SSRIs, Outcome 4 Secondary outcome (remission) at 2 weeks.

Comparison 2 Mirtazapine versus SSRIs, Outcome 5 Secondary outcome (remission) at end of the acute‐phase treatment.

Comparison 2 Mirtazapine versus SSRIs, Outcome 6 Secondary outcome (remission) at end of the continuation treatment.
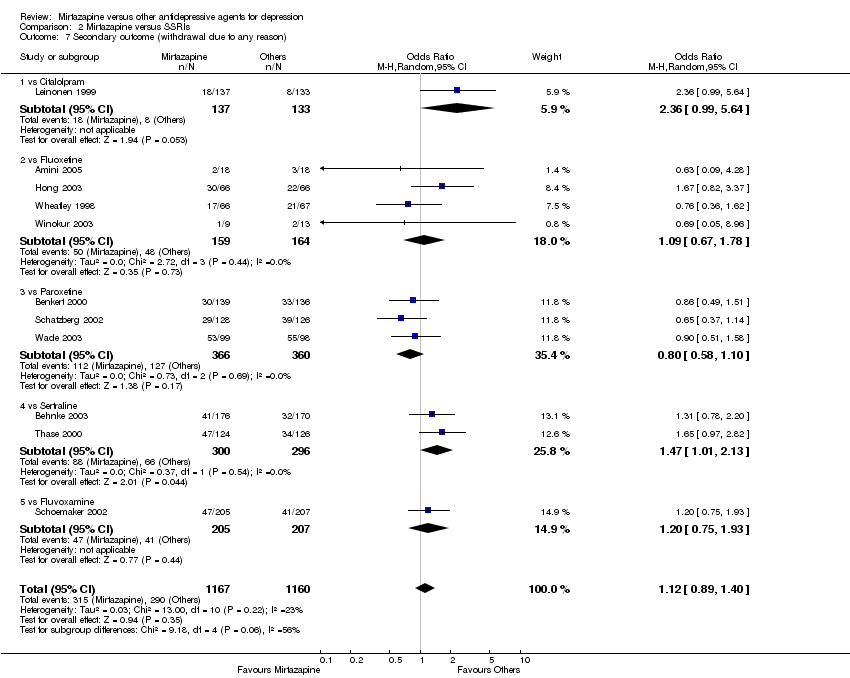
Comparison 2 Mirtazapine versus SSRIs, Outcome 7 Secondary outcome (withdrawal due to any reason).

Comparison 2 Mirtazapine versus SSRIs, Outcome 8 Secondary outcome (withdrawal due to adverse events).
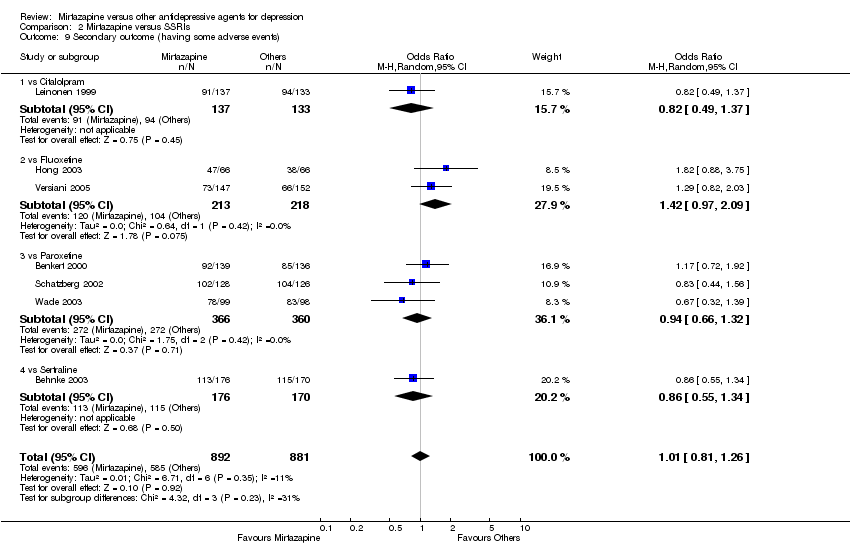
Comparison 2 Mirtazapine versus SSRIs, Outcome 9 Secondary outcome (having some adverse events).
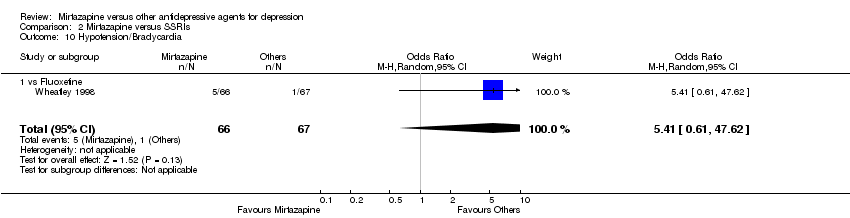
Comparison 2 Mirtazapine versus SSRIs, Outcome 10 Hypotension/Bradycardia.

Comparison 2 Mirtazapine versus SSRIs, Outcome 11 Sweating.
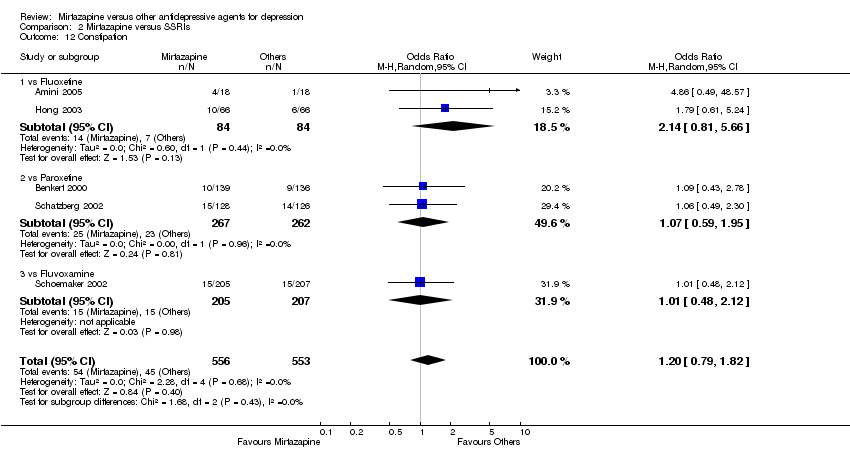
Comparison 2 Mirtazapine versus SSRIs, Outcome 12 Constipation.

Comparison 2 Mirtazapine versus SSRIs, Outcome 13 Diarrhoea.

Comparison 2 Mirtazapine versus SSRIs, Outcome 14 Dry mouth/Decreased salivation.
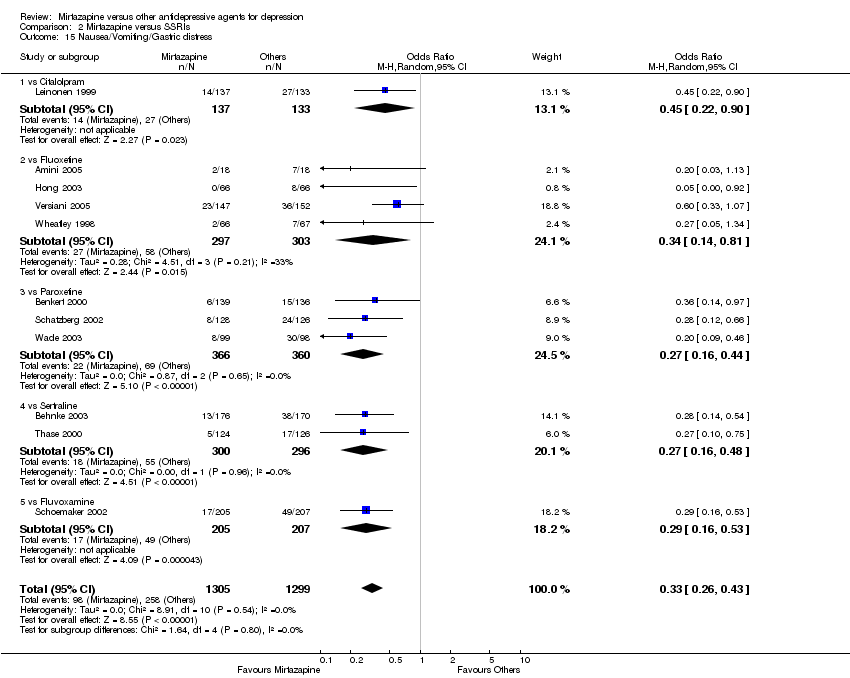
Comparison 2 Mirtazapine versus SSRIs, Outcome 15 Nausea/Vomiting/Gastric distress.
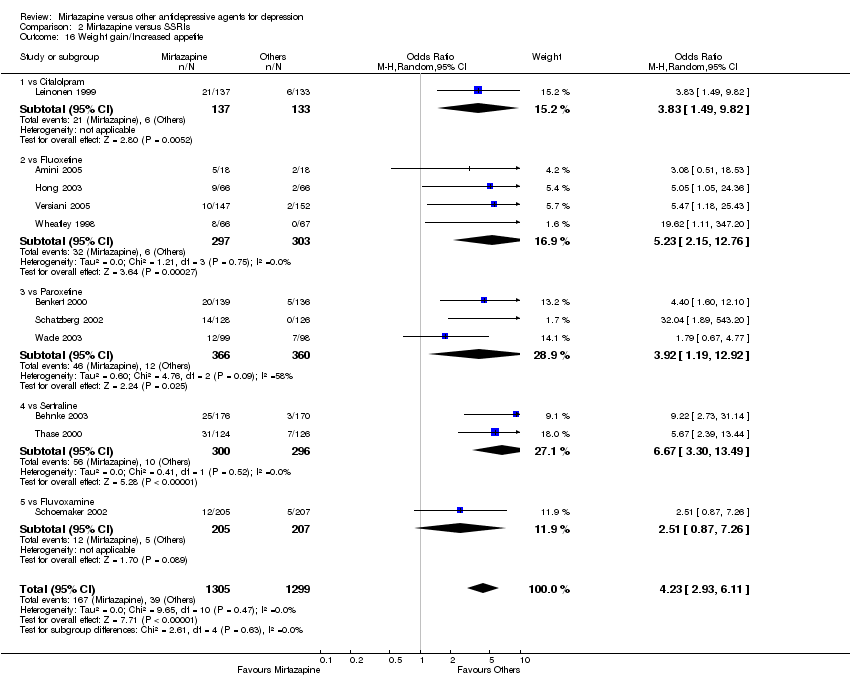
Comparison 2 Mirtazapine versus SSRIs, Outcome 16 Weight gain/Increased appetite.

Comparison 2 Mirtazapine versus SSRIs, Outcome 17 Weight loss/Anorexia.
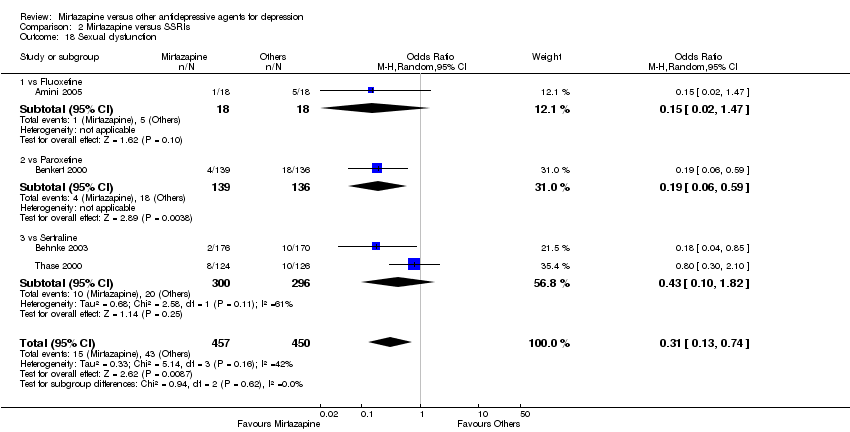
Comparison 2 Mirtazapine versus SSRIs, Outcome 18 Sexual dysfunction.

Comparison 2 Mirtazapine versus SSRIs, Outcome 19 Anxiety/Agitation.

Comparison 2 Mirtazapine versus SSRIs, Outcome 20 Dizziness/Vertigo/Faintness.
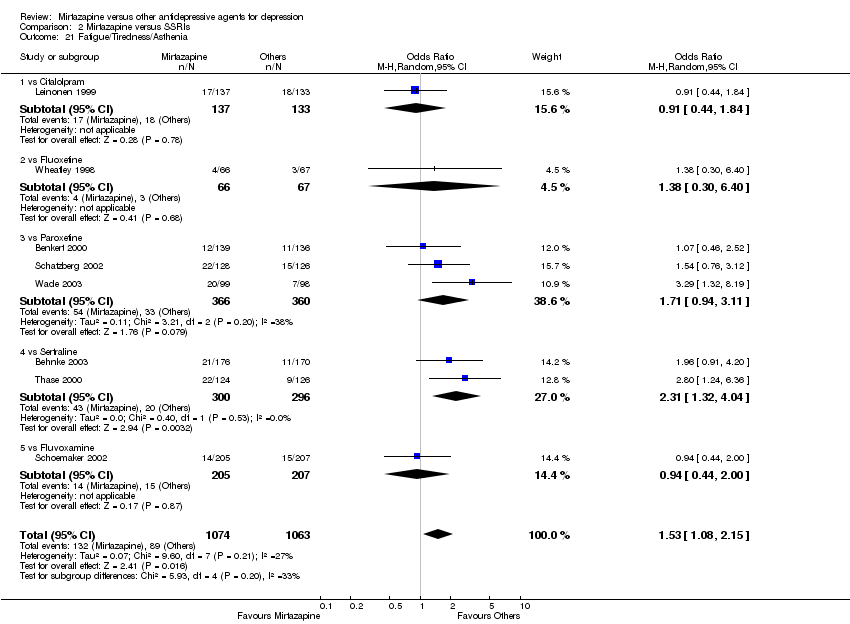
Comparison 2 Mirtazapine versus SSRIs, Outcome 21 Fatigue/Tiredness/Asthenia.
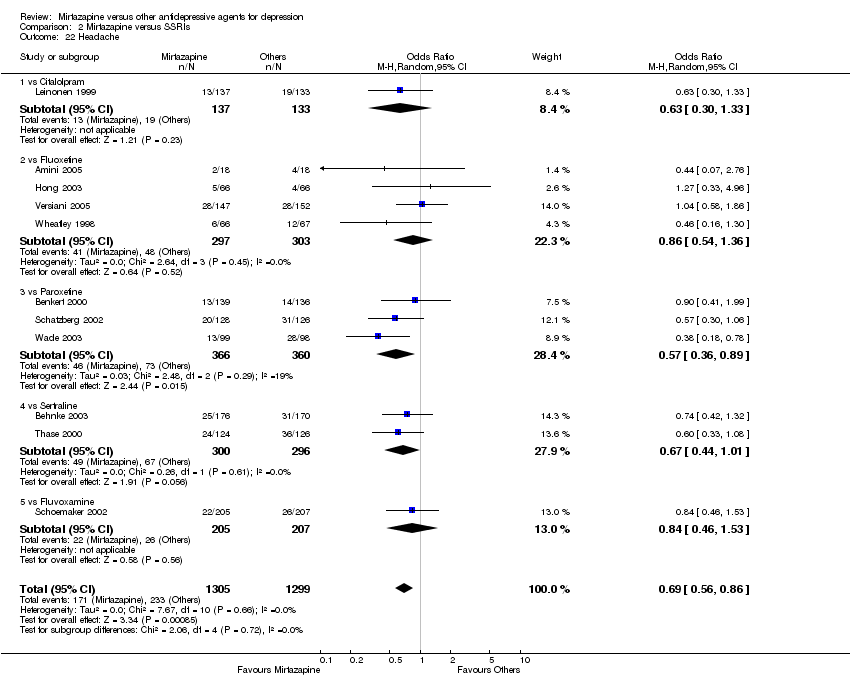
Comparison 2 Mirtazapine versus SSRIs, Outcome 22 Headache.

Comparison 2 Mirtazapine versus SSRIs, Outcome 23 Tremor.

Comparison 2 Mirtazapine versus SSRIs, Outcome 24 Sleep disturbance.
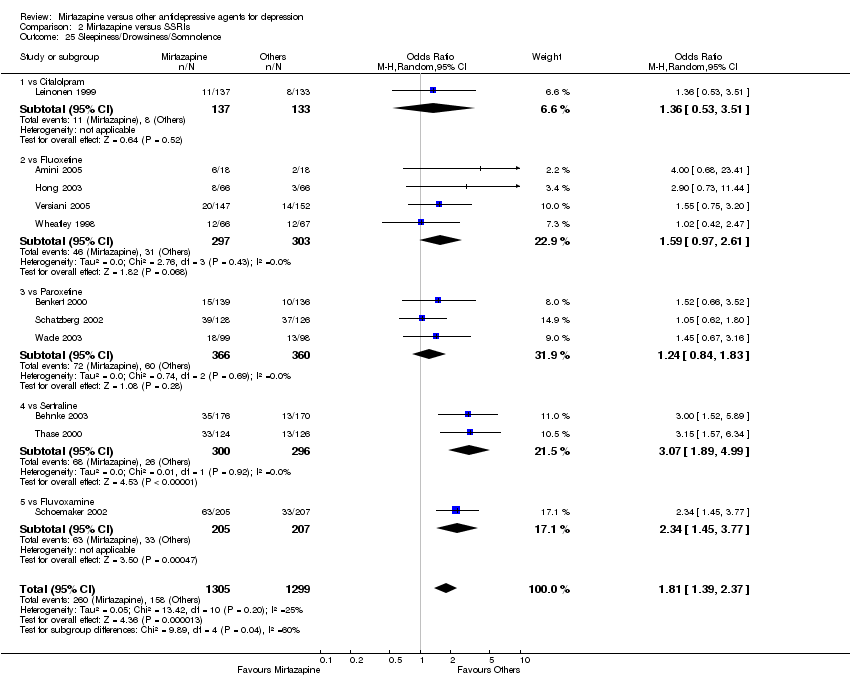
Comparison 2 Mirtazapine versus SSRIs, Outcome 25 Sleepiness/Drowsiness/Somnolence.
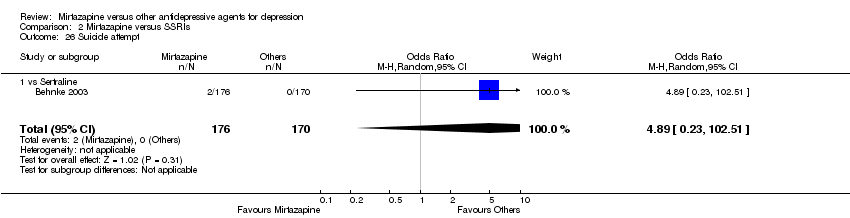
Comparison 2 Mirtazapine versus SSRIs, Outcome 26 Suicide attempt.

Comparison 2 Mirtazapine versus SSRIs, Outcome 27 Subgroup analysis: Response at 2 weeks: Treatment settings: Outpatients in primary care.
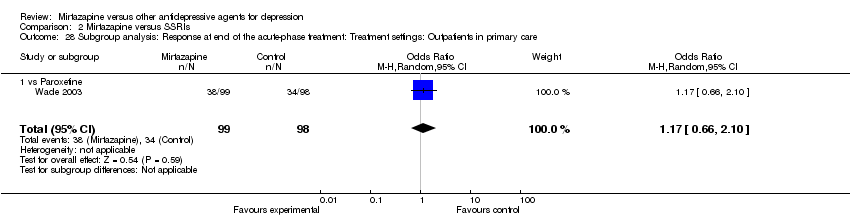
Comparison 2 Mirtazapine versus SSRIs, Outcome 28 Subgroup analysis: Response at end of the acute‐phase treatment: Treatment settings: Outpatients in primary care.

Comparison 2 Mirtazapine versus SSRIs, Outcome 29 Sensitivity analysis: Response at 2 weeks: Studies without imputation.
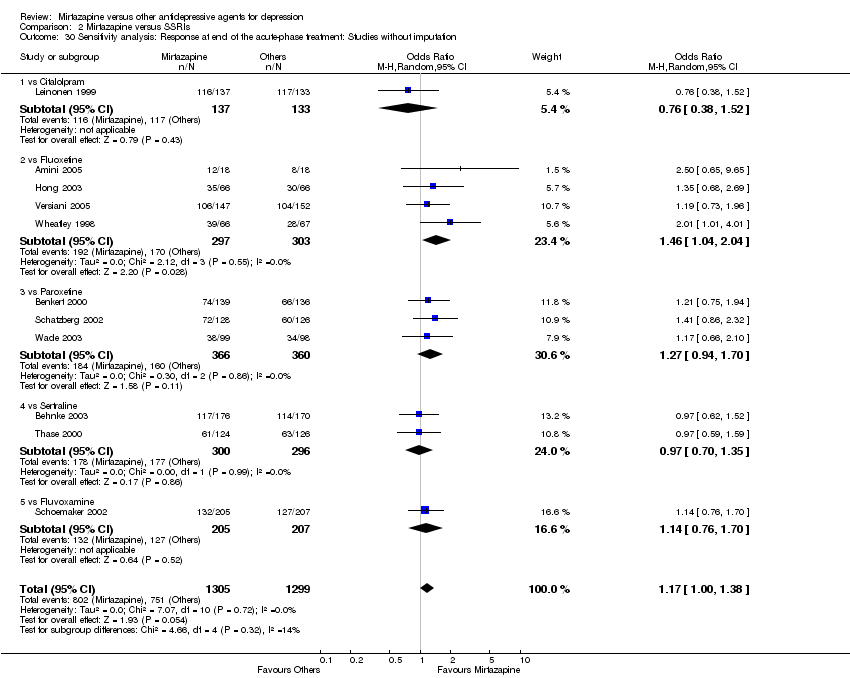
Comparison 2 Mirtazapine versus SSRIs, Outcome 30 Sensitivity analysis: Response at end of the acute‐phase treatment: Studies without imputation.
| Study | Comparator drug | Measurement | Mirtazapine: mean | SD | N | Comparator: mean | SD | N | note |
| Schoemaker 2002 | Fluvoxamine | HAMD‐17 | ‐9.2 | 5.86 | 199 | ‐7.3 | 6.11 | 203 | |
| Winokur 2003 | Fluoxetine | HAMD‐21 | 16.1 | 5.7 | 8 | 18.0 | 9.6 | 11 | |
Comparison 2 Mirtazapine versus SSRIs, Outcome 31 Secondary outcome (SKEWED DATA: depression severity) at 2 weeks.
| Study | Comparator drug | Measurement | Mirtazapine: mean | SD | N | Comparator: mean | SD | N | note |
| Schoemaker 2002 | Fluvoxamine | HAMD‐17 | ‐14.3 | 7.33 | 199 | ‐13.7 | 7.68 | 203 | |
| Thase 2000 | Sertraline | HAMD‐17 | 8.7 | 7.6 | 119 | 10.5 | 7.2 | 124 | |
| Winokur 2003 | Fluoxetine | HAMD‐21 | 7.1 | 3.7 | 8 | 12.2 | 9.2 | 11 | |
Comparison 2 Mirtazapine versus SSRIs, Outcome 32 Secondary outcome (SKEWED DATA: depression severity) at end of the acute‐phase treatment.

Comparison 3 Mirtazapine versus SNRIs, Outcome 1 Primary outcome (response) at 2 weeks.
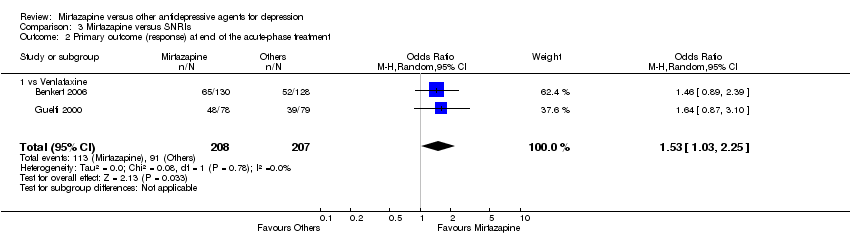
Comparison 3 Mirtazapine versus SNRIs, Outcome 2 Primary outcome (response) at end of the acute‐phase treatment.

Comparison 3 Mirtazapine versus SNRIs, Outcome 3 Secondary outcome (remission) at 2 weeks.

Comparison 3 Mirtazapine versus SNRIs, Outcome 4 Secondary outcome (remission) at end of the acute‐phase treatment.

Comparison 3 Mirtazapine versus SNRIs, Outcome 5 Secondary outcome (withdrawal due to any reason).

Comparison 3 Mirtazapine versus SNRIs, Outcome 6 Secondary outcome (withdrawal due to adverse events).
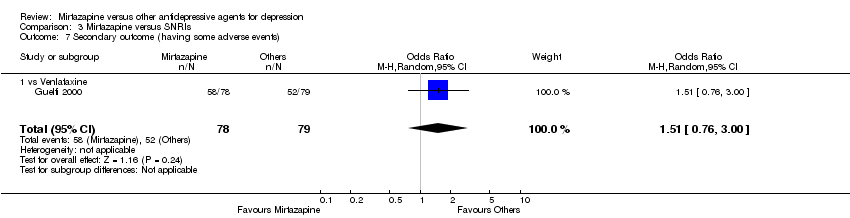
Comparison 3 Mirtazapine versus SNRIs, Outcome 7 Secondary outcome (having some adverse events).

Comparison 3 Mirtazapine versus SNRIs, Outcome 8 Hypotension/Bradycardia.
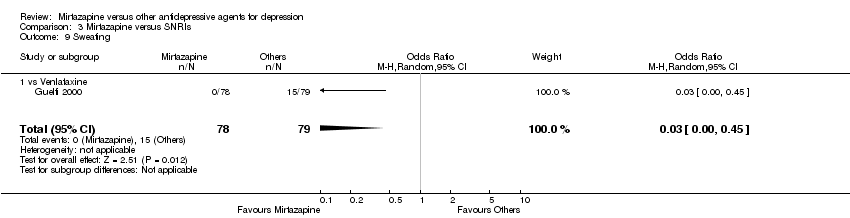
Comparison 3 Mirtazapine versus SNRIs, Outcome 9 Sweating.
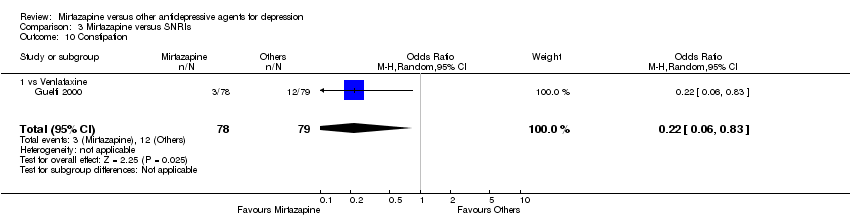
Comparison 3 Mirtazapine versus SNRIs, Outcome 10 Constipation.

Comparison 3 Mirtazapine versus SNRIs, Outcome 11 Dry mouth/Decreased salivation.
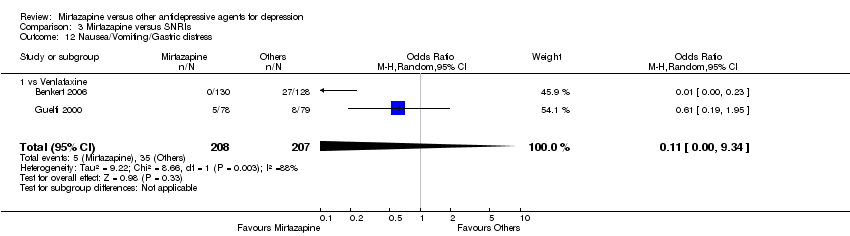
Comparison 3 Mirtazapine versus SNRIs, Outcome 12 Nausea/Vomiting/Gastric distress.
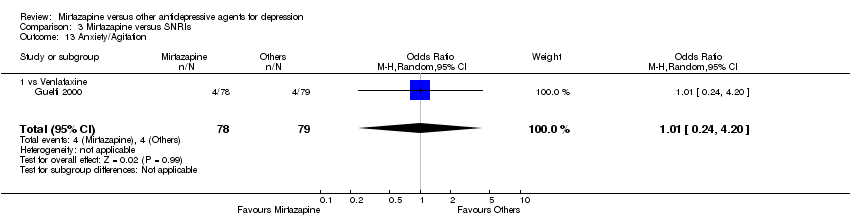
Comparison 3 Mirtazapine versus SNRIs, Outcome 13 Anxiety/Agitation.

Comparison 3 Mirtazapine versus SNRIs, Outcome 14 Fatigue/Tiredness/Asthenia.

Comparison 3 Mirtazapine versus SNRIs, Outcome 15 Headache.

Comparison 3 Mirtazapine versus SNRIs, Outcome 16 Sleep disturbance.

Comparison 3 Mirtazapine versus SNRIs, Outcome 17 Sleepiness/Drowsiness/Somnolence.
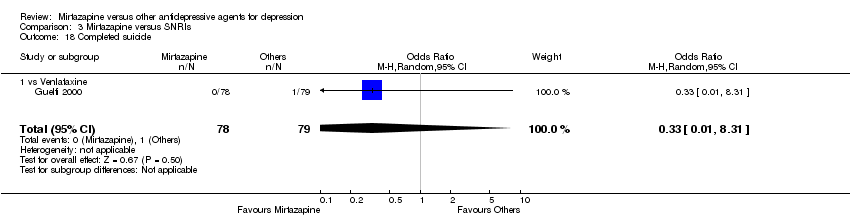
Comparison 3 Mirtazapine versus SNRIs, Outcome 18 Completed suicide.
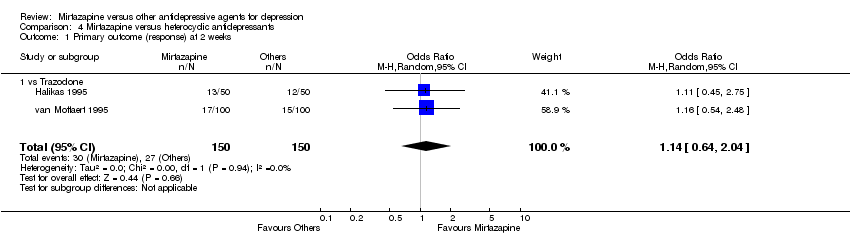
Comparison 4 Mirtazapine versus heterocyclic antidepressants, Outcome 1 Primary outcome (response) at 2 weeks.

Comparison 4 Mirtazapine versus heterocyclic antidepressants, Outcome 2 Primary outcome (response) at end of the acute‐phase treatment.

Comparison 4 Mirtazapine versus heterocyclic antidepressants, Outcome 3 Secondary outcome (remission) at 2 weeks.
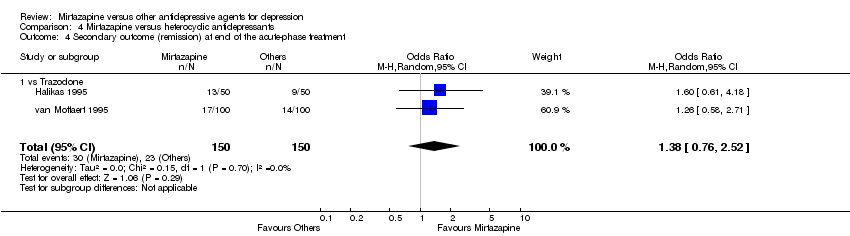
Comparison 4 Mirtazapine versus heterocyclic antidepressants, Outcome 4 Secondary outcome (remission) at end of the acute‐phase treatment.

Comparison 4 Mirtazapine versus heterocyclic antidepressants, Outcome 5 Secondary outcome (withdrawal due to any reason).

Comparison 4 Mirtazapine versus heterocyclic antidepressants, Outcome 6 Secondary outcome (withdrawal due to adverse events).

Comparison 4 Mirtazapine versus heterocyclic antidepressants, Outcome 7 Hypertension/Tachycardia.

Comparison 4 Mirtazapine versus heterocyclic antidepressants, Outcome 8 Hypotension/Bradycardia.

Comparison 4 Mirtazapine versus heterocyclic antidepressants, Outcome 9 Constipation.

Comparison 4 Mirtazapine versus heterocyclic antidepressants, Outcome 10 Dry mouth/Decreased salivation.

Comparison 4 Mirtazapine versus heterocyclic antidepressants, Outcome 11 Nausea/Vomiting/Gastric distress.

Comparison 4 Mirtazapine versus heterocyclic antidepressants, Outcome 12 Weight gain/Increased appetite.

Comparison 4 Mirtazapine versus heterocyclic antidepressants, Outcome 13 Weight loss/Anorexia.
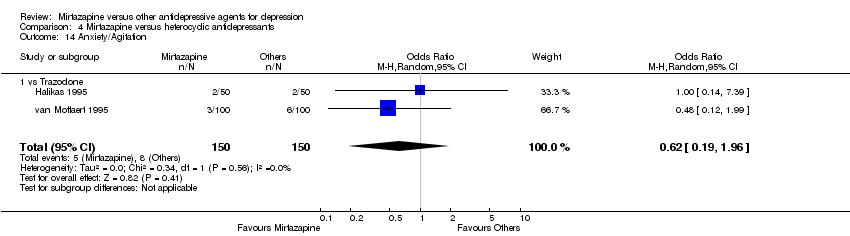
Comparison 4 Mirtazapine versus heterocyclic antidepressants, Outcome 14 Anxiety/Agitation.

Comparison 4 Mirtazapine versus heterocyclic antidepressants, Outcome 15 Dizziness/Vertigo/Faintness.

Comparison 4 Mirtazapine versus heterocyclic antidepressants, Outcome 16 Headache.

Comparison 4 Mirtazapine versus heterocyclic antidepressants, Outcome 17 Sleep disturbance.

Comparison 4 Mirtazapine versus heterocyclic antidepressants, Outcome 18 Sleepiness/Drowsiness/Somnolence.
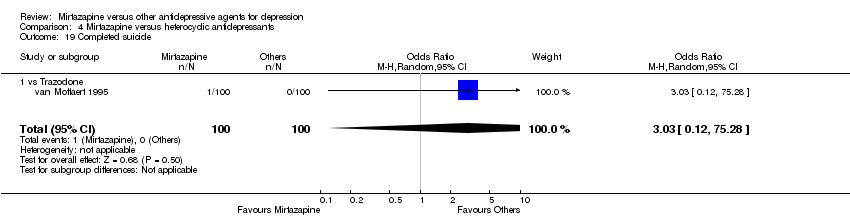
Comparison 4 Mirtazapine versus heterocyclic antidepressants, Outcome 19 Completed suicide.
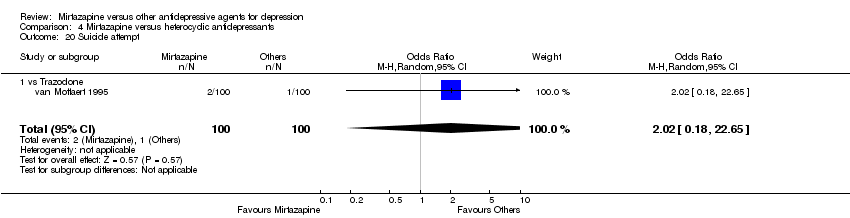
Comparison 4 Mirtazapine versus heterocyclic antidepressants, Outcome 20 Suicide attempt.
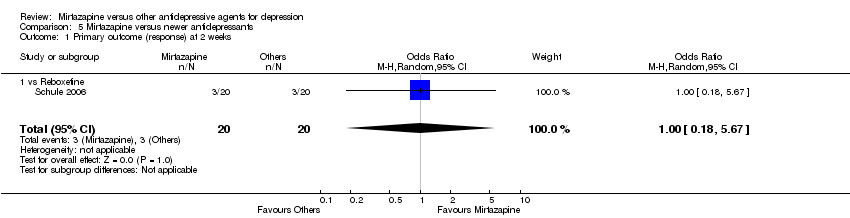
Comparison 5 Mirtazapine versus newer antidepressants, Outcome 1 Primary outcome (response) at 2 weeks.
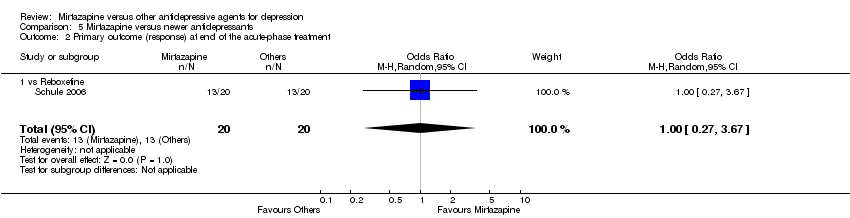
Comparison 5 Mirtazapine versus newer antidepressants, Outcome 2 Primary outcome (response) at end of the acute‐phase treatment.
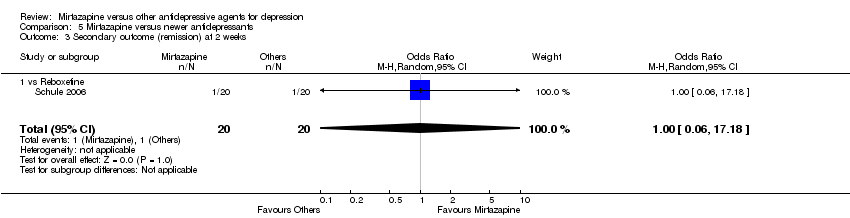
Comparison 5 Mirtazapine versus newer antidepressants, Outcome 3 Secondary outcome (remission) at 2 weeks.

Comparison 5 Mirtazapine versus newer antidepressants, Outcome 4 Secondary outcome (remission) at end of the acute‐phase treatment.
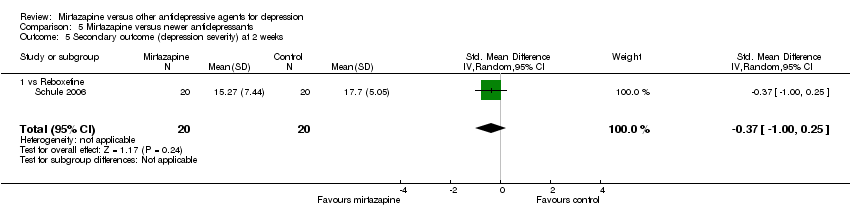
Comparison 5 Mirtazapine versus newer antidepressants, Outcome 5 Secondary outcome (depression severity) at 2 weeks.
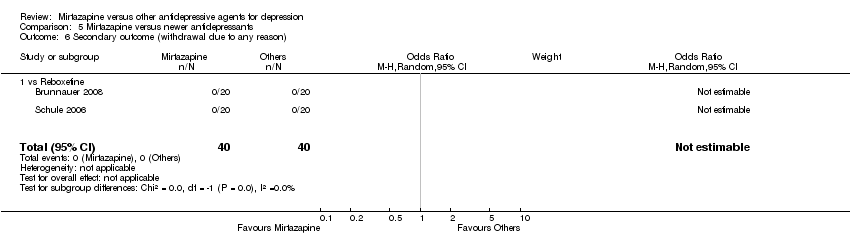
Comparison 5 Mirtazapine versus newer antidepressants, Outcome 6 Secondary outcome (withdrawal due to any reason).

Comparison 5 Mirtazapine versus newer antidepressants, Outcome 7 Secondary outcome (withdrawal due to adverse events).
| Study | Comparator drug | Measurement | Mirtazapine: mean | SD | N | Comparator: mean | SD | N | note |
| Schule 2006 | Reboxetine | 21‐item HAM‐D | 10.87 | 6.91 | 20 | 11.17 | 6.17 | 20 | |
Comparison 5 Mirtazapine versus newer antidepressants, Outcome 8 Secondary outcome (SKEWED DATA: depression severity) at end of the acute‐phase treatment.
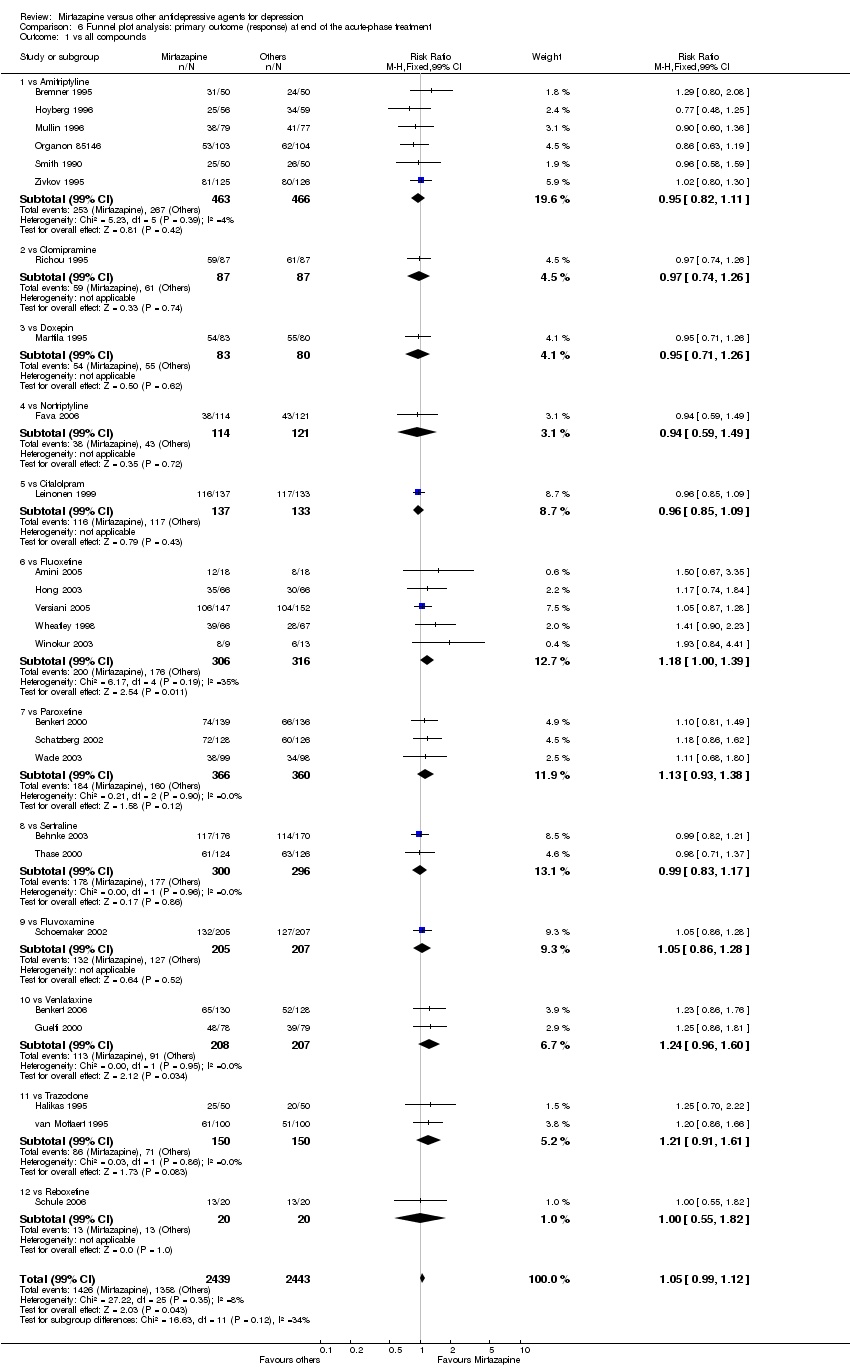
Comparison 6 Funnel plot analysis: primary outcome (response) at end of the acute‐phase treatment, Outcome 1 vs all compounds.
| Outcome or subgroup title | No. of studies | No. of participants | Statistical method | Effect size |
| 1 Primary outcome (response) at 2 weeks Show forest plot | 8 | 1294 | Odds Ratio (M‐H, Random, 95% CI) | 0.85 [0.64, 1.13] |
| 1.1 vs Amitriptyline | 5 | 722 | Odds Ratio (M‐H, Random, 95% CI) | 0.77 [0.54, 1.12] |
| 1.2 vs Clomipramine | 1 | 174 | Odds Ratio (M‐H, Random, 95% CI) | 0.89 [0.46, 1.73] |
| 1.3 vs Doxepin | 1 | 163 | Odds Ratio (M‐H, Random, 95% CI) | 1.11 [0.58, 2.12] |
| 1.4 vs Nortriptyline | 1 | 235 | Odds Ratio (M‐H, Random, 95% CI) | 0.84 [0.22, 3.22] |
| 2 Primary outcome (response) at end of the acute‐phase treatment Show forest plot | 9 | 1501 | Odds Ratio (M‐H, Random, 95% CI) | 0.89 [0.72, 1.10] |
| 2.1 vs Amitriptyline | 6 | 929 | Odds Ratio (M‐H, Random, 95% CI) | 0.90 [0.69, 1.17] |
| 2.2 vs Clomipramine | 1 | 174 | Odds Ratio (M‐H, Random, 95% CI) | 0.90 [0.47, 1.71] |
| 2.3 vs Doxepin | 1 | 163 | Odds Ratio (M‐H, Random, 95% CI) | 0.85 [0.44, 1.63] |
| 2.4 vs Nortriptyline | 1 | 235 | Odds Ratio (M‐H, Random, 95% CI) | 0.91 [0.53, 1.55] |
| 3 Secondary outcome (remission) at 2 weeks Show forest plot | 8 | 1294 | Odds Ratio (M‐H, Random, 95% CI) | 0.85 [0.55, 1.32] |
| 3.1 vs Amitriptyline | 5 | 722 | Odds Ratio (M‐H, Random, 95% CI) | 0.67 [0.35, 1.29] |
| 3.2 vs Clomipramine | 1 | 174 | Odds Ratio (M‐H, Random, 95% CI) | 0.89 [0.34, 2.31] |
| 3.3 vs Doxepin | 1 | 163 | Odds Ratio (M‐H, Random, 95% CI) | 1.27 [0.54, 3.00] |
| 3.4 vs Nortriptyline | 1 | 235 | Odds Ratio (M‐H, Random, 95% CI) | 0.70 [0.12, 4.28] |
| 4 Secondary outcome (remission) at end of the acute‐phase treatment Show forest plot | 9 | 1501 | Odds Ratio (M‐H, Random, 95% CI) | 0.86 [0.69, 1.08] |
| 4.1 vs Amitriptyline | 6 | 929 | Odds Ratio (M‐H, Random, 95% CI) | 0.87 [0.65, 1.16] |
| 4.2 vs Clomipramine | 1 | 174 | Odds Ratio (M‐H, Random, 95% CI) | 0.77 [0.41, 1.45] |
| 4.3 vs Doxepin | 1 | 163 | Odds Ratio (M‐H, Random, 95% CI) | 0.94 [0.50, 1.74] |
| 4.4 vs Nortriptyline | 1 | 235 | Odds Ratio (M‐H, Random, 95% CI) | 0.85 [0.46, 1.56] |
| 5 Secondary outcome (depression severity) at 2 weeks Show forest plot | 2 | 361 | Std. Mean Difference (IV, Random, 95% CI) | 0.10 [‐0.11, 0.31] |
| 5.1 vs Amitritpyline | 2 | 361 | Std. Mean Difference (IV, Random, 95% CI) | 0.10 [‐0.11, 0.31] |
| 6 Secondary outcome (depression severity) at end of the acute‐phase treatment Show forest plot | 1 | 144 | Std. Mean Difference (IV, Random, 95% CI) | 0.12 [‐0.21, 0.45] |
| 6.1 vs Amitritpyline | 1 | 144 | Std. Mean Difference (IV, Random, 95% CI) | 0.12 [‐0.21, 0.45] |
| 7 Secondary outcome (Social adjustment) at 2 weeks Show forest plot | 1 | 138 | Mean Difference (IV, Random, 95% CI) | 1.60 [‐1.98, 5.18] |
| 7.1 vs Amitriptyline | 1 | 138 | Mean Difference (IV, Random, 95% CI) | 1.60 [‐1.98, 5.18] |
| 8 Secondary outcome (Social adjustment) at end of the acute‐phase treatment Show forest plot | 3 | 440 | Std. Mean Difference (IV, Random, 95% CI) | 0.02 [‐0.17, 0.21] |
| 8.1 vs Amitriptyline | 1 | 114 | Std. Mean Difference (IV, Random, 95% CI) | 0.03 [‐0.34, 0.40] |
| 8.2 vs Clomipramine | 1 | 163 | Std. Mean Difference (IV, Random, 95% CI) | 0.12 [‐0.19, 0.43] |
| 8.3 vs Doxepin | 1 | 163 | Std. Mean Difference (IV, Random, 95% CI) | ‐0.09 [‐0.39, 0.22] |
| 9 Secondary outcome (withdrawal due to any reason) Show forest plot | 7 | 1166 | Odds Ratio (M‐H, Random, 95% CI) | 0.83 [0.63, 1.10] |
| 9.1 vs Amitriptyline | 5 | 829 | Odds Ratio (M‐H, Random, 95% CI) | 0.90 [0.65, 1.25] |
| 9.2 vs Clomipramine | 1 | 174 | Odds Ratio (M‐H, Random, 95% CI) | 0.80 [0.42, 1.54] |
| 9.3 vs Doxepin | 1 | 163 | Odds Ratio (M‐H, Random, 95% CI) | 0.51 [0.22, 1.19] |
| 10 Secondary outcome (withdrawal due to adverse events) Show forest plot | 8 | 1266 | Odds Ratio (M‐H, Random, 95% CI) | 0.65 [0.41, 1.03] |
| 10.1 vs Amitriptyline | 6 | 929 | Odds Ratio (M‐H, Random, 95% CI) | 0.60 [0.35, 1.03] |
| 10.2 vs Clomipramine | 1 | 174 | Odds Ratio (M‐H, Random, 95% CI) | 1.14 [0.42, 3.10] |
| 10.3 vs Doxepin | 1 | 163 | Odds Ratio (M‐H, Random, 95% CI) | 0.30 [0.06, 1.56] |
| 11 Secondary outcome (having some adverse events) Show forest plot | 2 | 442 | Odds Ratio (M‐H, Random, 95% CI) | 1.06 [0.54, 2.10] |
| 11.1 vs Amitriptyline | 1 | 207 | Odds Ratio (M‐H, Random, 95% CI) | 0.74 [0.16, 3.37] |
| 11.2 vs Nortriptyline | 1 | 235 | Odds Ratio (M‐H, Random, 95% CI) | 1.17 [0.55, 2.49] |
| 12 Hypertension/Tachycardia Show forest plot | 4 | 522 | Odds Ratio (M‐H, Random, 95% CI) | 0.44 [0.24, 0.81] |
| 12.1 vs Amitriptyline | 4 | 522 | Odds Ratio (M‐H, Random, 95% CI) | 0.44 [0.24, 0.81] |
| 13 Hypotension/Bradycardia Show forest plot | 2 | 215 | Odds Ratio (M‐H, Random, 95% CI) | 0.46 [0.12, 1.81] |
| 13.1 vs Amitriptyline | 2 | 215 | Odds Ratio (M‐H, Random, 95% CI) | 0.46 [0.12, 1.81] |
| 14 Sweating Show forest plot | 2 | 458 | Odds Ratio (M‐H, Random, 95% CI) | 0.42 [0.05, 3.24] |
| 14.1 vs Amitriptyline | 2 | 458 | Odds Ratio (M‐H, Random, 95% CI) | 0.42 [0.05, 3.24] |
| 15 Constipation Show forest plot | 6 | 1003 | Odds Ratio (M‐H, Random, 95% CI) | 0.72 [0.46, 1.12] |
| 15.1 vs Amitriptyline | 5 | 829 | Odds Ratio (M‐H, Random, 95% CI) | 0.72 [0.40, 1.29] |
| 15.2 vs Clomipramine | 1 | 174 | Odds Ratio (M‐H, Random, 95% CI) | 0.62 [0.26, 1.48] |
| 16 Dry mouth/Decreased salivation Show forest plot | 8 | 1266 | Odds Ratio (M‐H, Random, 95% CI) | 0.52 [0.24, 1.14] |
| 16.1 vs Amitriptyline | 6 | 929 | Odds Ratio (M‐H, Random, 95% CI) | 0.36 [0.14, 0.92] |
| 16.2 vs Clomipramine | 1 | 174 | Odds Ratio (M‐H, Random, 95% CI) | 0.81 [0.39, 1.69] |
| 16.3 vs Doxepin | 1 | 163 | Odds Ratio (M‐H, Random, 95% CI) | 2.86 [1.18, 6.94] |
| 17 Nausea/Vomiting/Gastric distress Show forest plot | 4 | 581 | Odds Ratio (M‐H, Random, 95% CI) | 0.29 [0.05, 1.59] |
| 17.1 vs Amitriptyline | 3 | 407 | Odds Ratio (M‐H, Random, 95% CI) | 0.33 [0.04, 2.59] |
| 17.2 vs Clomipramine | 1 | 174 | Odds Ratio (M‐H, Random, 95% CI) | 0.16 [0.02, 1.33] |
| 18 Weight gain/Increased appetite Show forest plot | 3 | 463 | Odds Ratio (M‐H, Random, 95% CI) | 1.04 [0.58, 1.86] |
| 18.1 vs Amitriptyline | 3 | 463 | Odds Ratio (M‐H, Random, 95% CI) | 1.04 [0.58, 1.86] |
| 19 Sexual dysfunction Show forest plot | 2 | 351 | Odds Ratio (M‐H, Random, 95% CI) | 0.41 [0.06, 2.61] |
| 19.1 vs Amitriptyline | 2 | 351 | Odds Ratio (M‐H, Random, 95% CI) | 0.41 [0.06, 2.61] |
| 20 Anxiety/Agitation Show forest plot | 2 | 307 | Odds Ratio (M‐H, Random, 95% CI) | 0.87 [0.34, 2.19] |
| 20.1 vs Amitriptyline | 2 | 307 | Odds Ratio (M‐H, Random, 95% CI) | 0.87 [0.34, 2.19] |
| 21 Dizziness/Vertigo/Faintness Show forest plot | 7 | 1166 | Odds Ratio (M‐H, Random, 95% CI) | 0.75 [0.43, 1.28] |
| 21.1 vs Amitriptyline | 5 | 829 | Odds Ratio (M‐H, Random, 95% CI) | 0.64 [0.35, 1.17] |
| 21.2 vs Clomipramine | 1 | 174 | Odds Ratio (M‐H, Random, 95% CI) | 0.70 [0.21, 2.29] |
| 21.3 vs Doxepin | 1 | 163 | Odds Ratio (M‐H, Random, 95% CI) | 3.04 [0.59, 15.53] |
| 22 Fatigue/Tiredness/Asthenia Show forest plot | 4 | 673 | Odds Ratio (M‐H, Random, 95% CI) | 1.25 [0.71, 2.21] |
| 22.1 vs Amitriptyline | 4 | 673 | Odds Ratio (M‐H, Random, 95% CI) | 1.25 [0.71, 2.21] |
| 23 Headache Show forest plot | 4 | 522 | Odds Ratio (M‐H, Random, 95% CI) | 0.74 [0.31, 1.74] |
| 23.1 vs Amitriptyline | 4 | 522 | Odds Ratio (M‐H, Random, 95% CI) | 0.74 [0.31, 1.74] |
| 24 Tremor Show forest plot | 7 | 1103 | Odds Ratio (M‐H, Random, 95% CI) | 0.36 [0.22, 0.57] |
| 24.1 vs Amitriptyline | 6 | 929 | Odds Ratio (M‐H, Random, 95% CI) | 0.36 [0.20, 0.62] |
| 24.2 vs Clomipramine | 1 | 174 | Odds Ratio (M‐H, Random, 95% CI) | 0.36 [0.15, 0.88] |
| 25 Sleep disturbance Show forest plot | 1 | 207 | Odds Ratio (M‐H, Random, 95% CI) | 1.43 [0.69, 2.98] |
| 25.1 vs Amitriptyline | 1 | 207 | Odds Ratio (M‐H, Random, 95% CI) | 1.43 [0.69, 2.98] |
| 26 Sleepiness/Drowsiness/Somnolence Show forest plot | 6 | 841 | Odds Ratio (M‐H, Random, 95% CI) | 0.92 [0.66, 1.27] |
| 26.1 vs Amitriptyline | 5 | 678 | Odds Ratio (M‐H, Random, 95% CI) | 0.81 [0.58, 1.14] |
| 26.2 vs Doxepin | 1 | 163 | Odds Ratio (M‐H, Random, 95% CI) | 1.86 [0.82, 4.21] |
| 27 Suicide attempt Show forest plot | 5 | 935 | Odds Ratio (M‐H, Random, 95% CI) | 1.77 [0.47, 6.58] |
| 27.1 vs Amitriptyline | 2 | 363 | Odds Ratio (M‐H, Random, 95% CI) | 2.08 [0.27, 16.29] |
| 27.2 vs Clomipramine | 1 | 174 | Odds Ratio (M‐H, Random, 95% CI) | 1.0 [0.06, 16.25] |
| 27.3 vs Doxepin | 1 | 163 | Odds Ratio (M‐H, Random, 95% CI) | 0.32 [0.01, 7.91] |
| 27.4 vs Nortriptyline | 1 | 235 | Odds Ratio (M‐H, Random, 95% CI) | 9.90 [0.53, 185.90] |
| 28 Subgroup analysis: Response at 2 weeks: Treatment settings: Psychiatric inpatients Show forest plot | 2 | 425 | Odds Ratio (M‐H, Random, 95% CI) | 0.81 [0.50, 1.32] |
| 28.1 vs Amitriptyline | 1 | 251 | Odds Ratio (M‐H, Random, 95% CI) | 0.73 [0.36, 1.48] |
| 28.2 vs Clomipramine | 1 | 174 | Odds Ratio (M‐H, Random, 95% CI) | 0.89 [0.46, 1.73] |
| 29 Subgroup analysis: Response at end of the acute‐phase treatment: Treatment settings: Psychiatric inpatients Show forest plot | 3 | 632 | Odds Ratio (M‐H, Random, 95% CI) | 0.89 [0.64, 1.23] |
| 29.1 vs Amitriptyline | 2 | 458 | Odds Ratio (M‐H, Random, 95% CI) | 0.88 [0.60, 1.29] |
| 29.2 vs Clomipramine | 1 | 174 | Odds Ratio (M‐H, Random, 95% CI) | 0.90 [0.47, 1.71] |
| 30 Sensitivity analysis: Response at 2 weeks: Studies without imputation Show forest plot | 7 | 1179 | Odds Ratio (M‐H, Random, 95% CI) | 0.85 [0.64, 1.15] |
| 30.1 vs Amitriptyline | 4 | 607 | Odds Ratio (M‐H, Random, 95% CI) | 0.76 [0.51, 1.13] |
| 30.2 vs Clomipramine | 1 | 174 | Odds Ratio (M‐H, Random, 95% CI) | 0.89 [0.46, 1.73] |
| 30.3 vs Doxepin | 1 | 163 | Odds Ratio (M‐H, Random, 95% CI) | 1.11 [0.58, 2.12] |
| 30.4 vs Nortriptyline | 1 | 235 | Odds Ratio (M‐H, Random, 95% CI) | 0.84 [0.22, 3.22] |
| 31 Sensitivity analysis: Response at end of the acute‐phase treatment: Studies without imputation Show forest plot | 8 | 1386 | Odds Ratio (M‐H, Random, 95% CI) | 0.93 [0.74, 1.15] |
| 31.1 vs Amitriptyline | 5 | 814 | Odds Ratio (M‐H, Random, 95% CI) | 0.95 [0.72, 1.26] |
| 31.2 vs Clomipramine | 1 | 174 | Odds Ratio (M‐H, Random, 95% CI) | 0.90 [0.47, 1.71] |
| 31.3 vs Doxepin | 1 | 163 | Odds Ratio (M‐H, Random, 95% CI) | 0.85 [0.44, 1.63] |
| 31.4 vs Nortriptyline | 1 | 235 | Odds Ratio (M‐H, Random, 95% CI) | 0.91 [0.53, 1.55] |
| 32 Secondary outcome (SKEWED DATA: depression severity) at 2 weeks Show forest plot | Other data | No numeric data | ||
| 33 Secondary outcome (SKEWED DATA: depression severity) at end of the acute‐phase treatment Show forest plot | Other data | No numeric data | ||
| Outcome or subgroup title | No. of studies | No. of participants | Statistical method | Effect size |
| 1 Primary outcome (response) at 2 weeks Show forest plot | 12 | 2626 | Odds Ratio (M‐H, Random, 95% CI) | 1.57 [1.30, 1.88] |
| 1.1 vs Citalolpram | 1 | 270 | Odds Ratio (M‐H, Random, 95% CI) | 2.01 [0.93, 4.35] |
| 1.2 vs Fluoxetine | 5 | 622 | Odds Ratio (M‐H, Random, 95% CI) | 1.26 [0.86, 1.85] |
| 1.3 vs Paroxetine | 3 | 726 | Odds Ratio (M‐H, Random, 95% CI) | 2.39 [1.42, 4.02] |
| 1.4 vs Sertraline | 2 | 596 | Odds Ratio (M‐H, Random, 95% CI) | 1.45 [1.04, 2.02] |
| 1.5 vs Fluvoxamine | 1 | 412 | Odds Ratio (M‐H, Random, 95% CI) | 1.38 [0.90, 2.13] |
| 2 Primary outcome (response) at end of the acute‐phase treatment Show forest plot | 12 | 2626 | Odds Ratio (M‐H, Random, 95% CI) | 1.19 [1.01, 1.39] |
| 2.1 vs Citalolpram | 1 | 270 | Odds Ratio (M‐H, Random, 95% CI) | 0.76 [0.38, 1.52] |
| 2.2 vs Fluoxetine | 5 | 622 | Odds Ratio (M‐H, Random, 95% CI) | 1.55 [1.07, 2.23] |
| 2.3 vs Paroxetine | 3 | 726 | Odds Ratio (M‐H, Random, 95% CI) | 1.27 [0.94, 1.70] |
| 2.4 vs Sertraline | 2 | 596 | Odds Ratio (M‐H, Random, 95% CI) | 0.97 [0.70, 1.35] |
| 2.5 vs Fluvoxamine | 1 | 412 | Odds Ratio (M‐H, Random, 95% CI) | 1.14 [0.76, 1.70] |
| 3 Primary outcome (response) at end of the continuation treatment Show forest plot | 1 | 197 | Odds Ratio (M‐H, Random, 95% CI) | 1.60 [0.91, 2.81] |
| 3.1 vs Paroxetine | 1 | 197 | Odds Ratio (M‐H, Random, 95% CI) | 1.60 [0.91, 2.81] |
| 4 Secondary outcome (remission) at 2 weeks Show forest plot | 12 | 2626 | Odds Ratio (M‐H, Random, 95% CI) | 1.82 [1.36, 2.44] |
| 4.1 vs Citalolpram | 1 | 270 | Odds Ratio (M‐H, Random, 95% CI) | 2.48 [0.47, 13.02] |
| 4.2 vs Fluoxetine | 5 | 622 | Odds Ratio (M‐H, Random, 95% CI) | 1.63 [0.81, 3.27] |
| 4.3 vs Paroxetine | 3 | 726 | Odds Ratio (M‐H, Random, 95% CI) | 2.31 [1.04, 5.11] |
| 4.4 vs Sertraline | 2 | 596 | Odds Ratio (M‐H, Random, 95% CI) | 1.94 [1.19, 3.15] |
| 4.5 vs Fluvoxamine | 1 | 412 | Odds Ratio (M‐H, Random, 95% CI) | 1.46 [0.77, 2.76] |
| 5 Secondary outcome (remission) at end of the acute‐phase treatment Show forest plot | 12 | 2626 | Odds Ratio (M‐H, Random, 95% CI) | 1.17 [0.98, 1.40] |
| 5.1 vs Citalolpram | 1 | 270 | Odds Ratio (M‐H, Random, 95% CI) | 0.92 [0.55, 1.52] |
| 5.2 vs Fluoxetine | 5 | 622 | Odds Ratio (M‐H, Random, 95% CI) | 1.12 [0.80, 1.57] |
| 5.3 vs Paroxetine | 3 | 726 | Odds Ratio (M‐H, Random, 95% CI) | 1.58 [1.16, 2.15] |
| 5.4 vs Sertraline | 2 | 596 | Odds Ratio (M‐H, Random, 95% CI) | 1.18 [0.82, 1.71] |
| 5.5 vs Fluvoxamine | 1 | 412 | Odds Ratio (M‐H, Random, 95% CI) | 0.84 [0.57, 1.23] |
| 6 Secondary outcome (remission) at end of the continuation treatment Show forest plot | 1 | 197 | Odds Ratio (M‐H, Random, 95% CI) | 1.89 [1.01, 3.54] |
| 6.1 vs Paroxetine | 1 | 197 | Odds Ratio (M‐H, Random, 95% CI) | 1.89 [1.01, 3.54] |
| 7 Secondary outcome (withdrawal due to any reason) Show forest plot | 11 | 2327 | Odds Ratio (M‐H, Random, 95% CI) | 1.12 [0.89, 1.40] |
| 7.1 vs Citalolpram | 1 | 270 | Odds Ratio (M‐H, Random, 95% CI) | 2.36 [0.99, 5.64] |
| 7.2 vs Fluoxetine | 4 | 323 | Odds Ratio (M‐H, Random, 95% CI) | 1.09 [0.67, 1.78] |
| 7.3 vs Paroxetine | 3 | 726 | Odds Ratio (M‐H, Random, 95% CI) | 0.80 [0.58, 1.10] |
| 7.4 vs Sertraline | 2 | 596 | Odds Ratio (M‐H, Random, 95% CI) | 1.47 [1.01, 2.13] |
| 7.5 vs Fluvoxamine | 1 | 412 | Odds Ratio (M‐H, Random, 95% CI) | 1.20 [0.75, 1.93] |
| 8 Secondary outcome (withdrawal due to adverse events) Show forest plot | 11 | 2604 | Odds Ratio (M‐H, Random, 95% CI) | 1.26 [0.85, 1.86] |
| 8.1 vs Citalolpram | 1 | 270 | Odds Ratio (M‐H, Random, 95% CI) | 2.0 [0.59, 6.81] |
| 8.2 vs Fluoxetine | 4 | 600 | Odds Ratio (M‐H, Random, 95% CI) | 1.05 [0.62, 1.78] |
| 8.3 vs Paroxetine | 3 | 726 | Odds Ratio (M‐H, Random, 95% CI) | 0.74 [0.45, 1.21] |
| 8.4 vs Sertraline | 2 | 596 | Odds Ratio (M‐H, Random, 95% CI) | 2.88 [1.43, 5.77] |
| 8.5 vs Fluvoxamine | 1 | 412 | Odds Ratio (M‐H, Random, 95% CI) | 1.66 [0.86, 3.21] |
| 9 Secondary outcome (having some adverse events) Show forest plot | 7 | 1773 | Odds Ratio (M‐H, Random, 95% CI) | 1.01 [0.81, 1.26] |
| 9.1 vs Citalolpram | 1 | 270 | Odds Ratio (M‐H, Random, 95% CI) | 0.82 [0.49, 1.37] |
| 9.2 vs Fluoxetine | 2 | 431 | Odds Ratio (M‐H, Random, 95% CI) | 1.42 [0.97, 2.09] |
| 9.3 vs Paroxetine | 3 | 726 | Odds Ratio (M‐H, Random, 95% CI) | 0.94 [0.66, 1.32] |
| 9.4 vs Sertraline | 1 | 346 | Odds Ratio (M‐H, Random, 95% CI) | 0.86 [0.55, 1.34] |
| 10 Hypotension/Bradycardia Show forest plot | 1 | 133 | Odds Ratio (M‐H, Random, 95% CI) | 5.41 [0.61, 47.62] |
| 10.1 vs Fluoxetine | 1 | 133 | Odds Ratio (M‐H, Random, 95% CI) | 5.41 [0.61, 47.62] |
| 11 Sweating Show forest plot | 5 | 1342 | Odds Ratio (M‐H, Random, 95% CI) | 0.25 [0.15, 0.44] |
| 11.1 vs Citalolpram | 1 | 270 | Odds Ratio (M‐H, Random, 95% CI) | 0.13 [0.04, 0.44] |
| 11.2 vs Paroxetine | 3 | 726 | Odds Ratio (M‐H, Random, 95% CI) | 0.32 [0.17, 0.62] |
| 11.3 vs Sertraline | 1 | 346 | Odds Ratio (M‐H, Random, 95% CI) | 0.21 [0.04, 0.97] |
| 12 Constipation Show forest plot | 5 | 1109 | Odds Ratio (M‐H, Random, 95% CI) | 1.20 [0.79, 1.82] |
| 12.1 vs Fluoxetine | 2 | 168 | Odds Ratio (M‐H, Random, 95% CI) | 2.14 [0.81, 5.66] |
| 12.2 vs Paroxetine | 2 | 529 | Odds Ratio (M‐H, Random, 95% CI) | 1.07 [0.59, 1.95] |
| 12.3 vs Fluvoxamine | 1 | 412 | Odds Ratio (M‐H, Random, 95% CI) | 1.01 [0.48, 2.12] |
| 13 Diarrhoea Show forest plot | 8 | 2040 | Odds Ratio (M‐H, Random, 95% CI) | 0.57 [0.41, 0.80] |
| 13.1 vs Citalolpram | 1 | 270 | Odds Ratio (M‐H, Random, 95% CI) | 0.47 [0.14, 1.60] |
| 13.2 vs Fluoxetine | 1 | 36 | Odds Ratio (M‐H, Random, 95% CI) | 1.0 [0.06, 17.33] |
| 13.3 vs Paroxetine | 3 | 726 | Odds Ratio (M‐H, Random, 95% CI) | 0.89 [0.55, 1.46] |
| 13.4 vs Sertraline | 2 | 596 | Odds Ratio (M‐H, Random, 95% CI) | 0.37 [0.21, 0.67] |
| 13.5 vs Fluvoxamine | 1 | 412 | Odds Ratio (M‐H, Random, 95% CI) | 0.34 [0.13, 0.87] |
| 14 Dry mouth/Decreased salivation Show forest plot | 10 | 2305 | Odds Ratio (M‐H, Random, 95% CI) | 1.80 [1.37, 2.36] |
| 14.1 vs Citalolpram | 1 | 270 | Odds Ratio (M‐H, Random, 95% CI) | 1.72 [0.81, 3.68] |
| 14.2 vs Fluoxetine | 3 | 301 | Odds Ratio (M‐H, Random, 95% CI) | 3.68 [1.52, 8.91] |
| 14.3 vs Paroxetine | 3 | 726 | Odds Ratio (M‐H, Random, 95% CI) | 1.73 [0.81, 3.70] |
| 14.4 vs Sertraline | 2 | 596 | Odds Ratio (M‐H, Random, 95% CI) | 1.53 [0.92, 2.55] |
| 14.5 vs Fluvoxamine | 1 | 412 | Odds Ratio (M‐H, Random, 95% CI) | 1.48 [0.77, 2.85] |
| 15 Nausea/Vomiting/Gastric distress Show forest plot | 11 | 2604 | Odds Ratio (M‐H, Random, 95% CI) | 0.33 [0.26, 0.43] |
| 15.1 vs Citalolpram | 1 | 270 | Odds Ratio (M‐H, Random, 95% CI) | 0.45 [0.22, 0.90] |
| 15.2 vs Fluoxetine | 4 | 600 | Odds Ratio (M‐H, Random, 95% CI) | 0.34 [0.14, 0.81] |
| 15.3 vs Paroxetine | 3 | 726 | Odds Ratio (M‐H, Random, 95% CI) | 0.27 [0.16, 0.44] |
| 15.4 vs Sertraline | 2 | 596 | Odds Ratio (M‐H, Random, 95% CI) | 0.27 [0.16, 0.48] |
| 15.5 vs Fluvoxamine | 1 | 412 | Odds Ratio (M‐H, Random, 95% CI) | 0.29 [0.16, 0.53] |
| 16 Weight gain/Increased appetite Show forest plot | 11 | 2604 | Odds Ratio (M‐H, Random, 95% CI) | 4.23 [2.93, 6.11] |
| 16.1 vs Citalolpram | 1 | 270 | Odds Ratio (M‐H, Random, 95% CI) | 3.83 [1.49, 9.82] |
| 16.2 vs Fluoxetine | 4 | 600 | Odds Ratio (M‐H, Random, 95% CI) | 5.23 [2.15, 12.76] |
| 16.3 vs Paroxetine | 3 | 726 | Odds Ratio (M‐H, Random, 95% CI) | 3.92 [1.19, 12.92] |
| 16.4 vs Sertraline | 2 | 596 | Odds Ratio (M‐H, Random, 95% CI) | 6.67 [3.30, 13.49] |
| 16.5 vs Fluvoxamine | 1 | 412 | Odds Ratio (M‐H, Random, 95% CI) | 2.51 [0.87, 7.26] |
| 17 Weight loss/Anorexia Show forest plot | 4 | 576 | Odds Ratio (M‐H, Random, 95% CI) | 0.35 [0.10, 1.18] |
| 17.1 vs Fluoxetine | 3 | 301 | Odds Ratio (M‐H, Random, 95% CI) | 0.42 [0.11, 1.62] |
| 17.2 vs Paroxetine | 1 | 275 | Odds Ratio (M‐H, Random, 95% CI) | 0.14 [0.01, 2.67] |
| 18 Sexual dysfunction Show forest plot | 4 | 907 | Odds Ratio (M‐H, Random, 95% CI) | 0.31 [0.13, 0.74] |
| 18.1 vs Fluoxetine | 1 | 36 | Odds Ratio (M‐H, Random, 95% CI) | 0.15 [0.02, 1.47] |
| 18.2 vs Paroxetine | 1 | 275 | Odds Ratio (M‐H, Random, 95% CI) | 0.19 [0.06, 0.59] |
| 18.3 vs Sertraline | 2 | 596 | Odds Ratio (M‐H, Random, 95% CI) | 0.43 [0.10, 1.82] |
| 19 Anxiety/Agitation Show forest plot | 4 | 1134 | Odds Ratio (M‐H, Random, 95% CI) | 1.46 [0.59, 3.65] |
| 19.1 vs Paroxetine | 2 | 472 | Odds Ratio (M‐H, Random, 95% CI) | 0.71 [0.32, 1.60] |
| 19.2 vs Sertraline | 1 | 250 | Odds Ratio (M‐H, Random, 95% CI) | 1.65 [0.69, 3.98] |
| 19.3 vs Fluvoxamine | 1 | 412 | Odds Ratio (M‐H, Random, 95% CI) | 5.76 [1.65, 20.07] |
| 20 Dizziness/Vertigo/Faintness Show forest plot | 10 | 2568 | Odds Ratio (M‐H, Random, 95% CI) | 1.04 [0.77, 1.41] |
| 20.1 vs Citalolpram | 1 | 270 | Odds Ratio (M‐H, Random, 95% CI) | 2.03 [0.74, 5.58] |
| 20.2 vs Fluoxetine | 3 | 564 | Odds Ratio (M‐H, Random, 95% CI) | 0.92 [0.54, 1.56] |
| 20.3 vs Paroxetine | 3 | 726 | Odds Ratio (M‐H, Random, 95% CI) | 0.84 [0.47, 1.50] |
| 20.4 vs Sertraline | 2 | 596 | Odds Ratio (M‐H, Random, 95% CI) | 1.16 [0.36, 3.70] |
| 20.5 vs Fluvoxamine | 1 | 412 | Odds Ratio (M‐H, Random, 95% CI) | 1.31 [0.69, 2.48] |
| 21 Fatigue/Tiredness/Asthenia Show forest plot | 8 | 2137 | Odds Ratio (M‐H, Random, 95% CI) | 1.53 [1.08, 2.15] |
| 21.1 vs Citalolpram | 1 | 270 | Odds Ratio (M‐H, Random, 95% CI) | 0.91 [0.44, 1.84] |
| 21.2 vs Fluoxetine | 1 | 133 | Odds Ratio (M‐H, Random, 95% CI) | 1.38 [0.30, 6.40] |
| 21.3 vs Paroxetine | 3 | 726 | Odds Ratio (M‐H, Random, 95% CI) | 1.71 [0.94, 3.11] |
| 21.4 vs Sertraline | 2 | 596 | Odds Ratio (M‐H, Random, 95% CI) | 2.31 [1.32, 4.04] |
| 21.5 vs Fluvoxamine | 1 | 412 | Odds Ratio (M‐H, Random, 95% CI) | 0.94 [0.44, 2.00] |
| 22 Headache Show forest plot | 11 | 2604 | Odds Ratio (M‐H, Random, 95% CI) | 0.69 [0.56, 0.86] |
| 22.1 vs Citalolpram | 1 | 270 | Odds Ratio (M‐H, Random, 95% CI) | 0.63 [0.30, 1.33] |
| 22.2 vs Fluoxetine | 4 | 600 | Odds Ratio (M‐H, Random, 95% CI) | 0.86 [0.54, 1.36] |
| 22.3 vs Paroxetine | 3 | 726 | Odds Ratio (M‐H, Random, 95% CI) | 0.57 [0.36, 0.89] |
| 22.4 vs Sertraline | 2 | 596 | Odds Ratio (M‐H, Random, 95% CI) | 0.67 [0.44, 1.01] |
| 22.5 vs Fluvoxamine | 1 | 412 | Odds Ratio (M‐H, Random, 95% CI) | 0.84 [0.46, 1.53] |
| 23 Tremor Show forest plot | 5 | 996 | Odds Ratio (M‐H, Random, 95% CI) | 0.34 [0.18, 0.66] |
| 23.1 vs Fluoxetine | 3 | 467 | Odds Ratio (M‐H, Random, 95% CI) | 0.42 [0.17, 1.07] |
| 23.2 vs Paroxetine | 2 | 529 | Odds Ratio (M‐H, Random, 95% CI) | 0.27 [0.11, 0.70] |
| 24 Sleep disturbance Show forest plot | 5 | 1346 | Odds Ratio (M‐H, Random, 95% CI) | 0.52 [0.31, 0.86] |
| 24.1 vs Fluoxetine | 1 | 299 | Odds Ratio (M‐H, Random, 95% CI) | 0.53 [0.21, 1.38] |
| 24.2 vs Paroxetine | 2 | 451 | Odds Ratio (M‐H, Random, 95% CI) | 0.68 [0.25, 1.85] |
| 24.3 vs Sertraline | 2 | 596 | Odds Ratio (M‐H, Random, 95% CI) | 0.37 [0.16, 0.85] |
| 25 Sleepiness/Drowsiness/Somnolence Show forest plot | 11 | 2604 | Odds Ratio (M‐H, Random, 95% CI) | 1.81 [1.39, 2.37] |
| 25.1 vs Citalolpram | 1 | 270 | Odds Ratio (M‐H, Random, 95% CI) | 1.36 [0.53, 3.51] |
| 25.2 vs Fluoxetine | 4 | 600 | Odds Ratio (M‐H, Random, 95% CI) | 1.59 [0.97, 2.61] |
| 25.3 vs Paroxetine | 3 | 726 | Odds Ratio (M‐H, Random, 95% CI) | 1.24 [0.84, 1.83] |
| 25.4 vs Sertraline | 2 | 596 | Odds Ratio (M‐H, Random, 95% CI) | 3.07 [1.89, 4.99] |
| 25.5 vs Fluvoxamine | 1 | 412 | Odds Ratio (M‐H, Random, 95% CI) | 2.34 [1.45, 3.77] |
| 26 Suicide attempt Show forest plot | 1 | 346 | Odds Ratio (M‐H, Random, 95% CI) | 4.89 [0.23, 102.51] |
| 26.1 vs Sertraline | 1 | 346 | Odds Ratio (M‐H, Random, 95% CI) | 4.89 [0.23, 102.51] |
| 27 Subgroup analysis: Response at 2 weeks: Treatment settings: Outpatients in primary care Show forest plot | 1 | 197 | Odds Ratio (M‐H, Random, 95% CI) | 4.38 [1.69, 11.35] |
| 27.1 vs Paroxetine | 1 | 197 | Odds Ratio (M‐H, Random, 95% CI) | 4.38 [1.69, 11.35] |
| 28 Subgroup analysis: Response at end of the acute‐phase treatment: Treatment settings: Outpatients in primary care Show forest plot | 1 | 197 | Odds Ratio (M‐H, Random, 95% CI) | 1.17 [0.66, 2.10] |
| 28.1 vs Paroxetine | 1 | 197 | Odds Ratio (M‐H, Random, 95% CI) | 1.17 [0.66, 2.10] |
| 29 Sensitivity analysis: Response at 2 weeks: Studies without imputation Show forest plot | 11 | 2604 | Odds Ratio (M‐H, Random, 95% CI) | 1.58 [1.31, 1.90] |
| 29.1 vs Citalolpram | 1 | 270 | Odds Ratio (M‐H, Random, 95% CI) | 2.01 [0.93, 4.35] |
| 29.2 vs Fluoxetine | 4 | 600 | Odds Ratio (M‐H, Random, 95% CI) | 1.27 [0.86, 1.88] |
| 29.3 vs Paroxetine | 3 | 726 | Odds Ratio (M‐H, Random, 95% CI) | 2.39 [1.42, 4.02] |
| 29.4 vs Sertraline | 2 | 596 | Odds Ratio (M‐H, Random, 95% CI) | 1.45 [1.04, 2.02] |
| 29.5 vs Fluvoxamine | 1 | 412 | Odds Ratio (M‐H, Random, 95% CI) | 1.38 [0.90, 2.13] |
| 30 Sensitivity analysis: Response at end of the acute‐phase treatment: Studies without imputation Show forest plot | 11 | 2604 | Odds Ratio (M‐H, Random, 95% CI) | 1.17 [1.00, 1.38] |
| 30.1 vs Citalolpram | 1 | 270 | Odds Ratio (M‐H, Random, 95% CI) | 0.76 [0.38, 1.52] |
| 30.2 vs Fluoxetine | 4 | 600 | Odds Ratio (M‐H, Random, 95% CI) | 1.46 [1.04, 2.04] |
| 30.3 vs Paroxetine | 3 | 726 | Odds Ratio (M‐H, Random, 95% CI) | 1.27 [0.94, 1.70] |
| 30.4 vs Sertraline | 2 | 596 | Odds Ratio (M‐H, Random, 95% CI) | 0.97 [0.70, 1.35] |
| 30.5 vs Fluvoxamine | 1 | 412 | Odds Ratio (M‐H, Random, 95% CI) | 1.14 [0.76, 1.70] |
| 31 Secondary outcome (SKEWED DATA: depression severity) at 2 weeks Show forest plot | Other data | No numeric data | ||
| 32 Secondary outcome (SKEWED DATA: depression severity) at end of the acute‐phase treatment Show forest plot | Other data | No numeric data | ||
| Outcome or subgroup title | No. of studies | No. of participants | Statistical method | Effect size |
| 1 Primary outcome (response) at 2 weeks Show forest plot | 2 | 415 | Odds Ratio (M‐H, Random, 95% CI) | 2.29 [1.45, 3.59] |
| 1.1 vs Venlafaxine | 2 | 415 | Odds Ratio (M‐H, Random, 95% CI) | 2.29 [1.45, 3.59] |
| 2 Primary outcome (response) at end of the acute‐phase treatment Show forest plot | 2 | 415 | Odds Ratio (M‐H, Random, 95% CI) | 1.53 [1.03, 2.25] |
| 2.1 vs Venlafaxine | 2 | 415 | Odds Ratio (M‐H, Random, 95% CI) | 1.53 [1.03, 2.25] |
| 3 Secondary outcome (remission) at 2 weeks Show forest plot | 2 | 415 | Odds Ratio (M‐H, Random, 95% CI) | 2.34 [1.07, 5.13] |
| 3.1 vs Venlafaxine | 2 | 415 | Odds Ratio (M‐H, Random, 95% CI) | 2.34 [1.07, 5.13] |
| 4 Secondary outcome (remission) at end of the acute‐phase treatment Show forest plot | 2 | 415 | Odds Ratio (M‐H, Random, 95% CI) | 1.55 [0.98, 2.47] |
| 4.1 vs Venlafaxine | 2 | 415 | Odds Ratio (M‐H, Random, 95% CI) | 1.55 [0.98, 2.47] |
| 5 Secondary outcome (withdrawal due to any reason) Show forest plot | 2 | 415 | Odds Ratio (M‐H, Random, 95% CI) | 0.65 [0.43, 0.99] |
| 5.1 vs Venlafaxine | 2 | 415 | Odds Ratio (M‐H, Random, 95% CI) | 0.65 [0.43, 0.99] |
| 6 Secondary outcome (withdrawal due to adverse events) Show forest plot | 2 | 415 | Odds Ratio (M‐H, Random, 95% CI) | 0.55 [0.24, 1.24] |
| 6.1 vs Venlafaxine | 2 | 415 | Odds Ratio (M‐H, Random, 95% CI) | 0.55 [0.24, 1.24] |
| 7 Secondary outcome (having some adverse events) Show forest plot | 1 | 157 | Odds Ratio (M‐H, Random, 95% CI) | 1.51 [0.76, 3.00] |
| 7.1 vs Venlafaxine | 1 | 157 | Odds Ratio (M‐H, Random, 95% CI) | 1.51 [0.76, 3.00] |
| 8 Hypotension/Bradycardia Show forest plot | 1 | 157 | Odds Ratio (M‐H, Random, 95% CI) | 0.19 [0.02, 1.68] |
| 8.1 vs Venlafaxine | 1 | 157 | Odds Ratio (M‐H, Random, 95% CI) | 0.19 [0.02, 1.68] |
| 9 Sweating Show forest plot | 1 | 157 | Odds Ratio (M‐H, Random, 95% CI) | 0.03 [0.00, 0.45] |
| 9.1 vs Venlafaxine | 1 | 157 | Odds Ratio (M‐H, Random, 95% CI) | 0.03 [0.00, 0.45] |
| 10 Constipation Show forest plot | 1 | 157 | Odds Ratio (M‐H, Random, 95% CI) | 0.22 [0.06, 0.83] |
| 10.1 vs Venlafaxine | 1 | 157 | Odds Ratio (M‐H, Random, 95% CI) | 0.22 [0.06, 0.83] |
| 11 Dry mouth/Decreased salivation Show forest plot | 2 | 415 | Odds Ratio (M‐H, Random, 95% CI) | 8.61 [0.35, 211.85] |
| 11.1 vs Venlafaxine | 2 | 415 | Odds Ratio (M‐H, Random, 95% CI) | 8.61 [0.35, 211.85] |
| 12 Nausea/Vomiting/Gastric distress Show forest plot | 2 | 415 | Odds Ratio (M‐H, Random, 95% CI) | 0.11 [0.00, 9.34] |
| 12.1 vs Venlafaxine | 2 | 415 | Odds Ratio (M‐H, Random, 95% CI) | 0.11 [0.00, 9.34] |
| 13 Anxiety/Agitation Show forest plot | 1 | 157 | Odds Ratio (M‐H, Random, 95% CI) | 1.01 [0.24, 4.20] |
| 13.1 vs Venlafaxine | 1 | 157 | Odds Ratio (M‐H, Random, 95% CI) | 1.01 [0.24, 4.20] |
| 14 Fatigue/Tiredness/Asthenia Show forest plot | 1 | 258 | Odds Ratio (M‐H, Random, 95% CI) | 2.43 [1.30, 4.55] |
| 14.1 vs Venlafaxine | 1 | 258 | Odds Ratio (M‐H, Random, 95% CI) | 2.43 [1.30, 4.55] |
| 15 Headache Show forest plot | 2 | 415 | Odds Ratio (M‐H, Random, 95% CI) | 0.95 [0.53, 1.72] |
| 15.1 vs Venlafaxine | 2 | 415 | Odds Ratio (M‐H, Random, 95% CI) | 0.95 [0.53, 1.72] |
| 16 Sleep disturbance Show forest plot | 1 | 258 | Odds Ratio (M‐H, Random, 95% CI) | 0.02 [0.00, 0.41] |
| 16.1 vs Venlafaxine | 1 | 258 | Odds Ratio (M‐H, Random, 95% CI) | 0.02 [0.00, 0.41] |
| 17 Sleepiness/Drowsiness/Somnolence Show forest plot | 1 | 157 | Odds Ratio (M‐H, Random, 95% CI) | 1.56 [0.42, 5.77] |
| 17.1 vs Venlafaxine | 1 | 157 | Odds Ratio (M‐H, Random, 95% CI) | 1.56 [0.42, 5.77] |
| 18 Completed suicide Show forest plot | 1 | 157 | Odds Ratio (M‐H, Random, 95% CI) | 0.33 [0.01, 8.31] |
| 18.1 vs Venlafaxine | 1 | 157 | Odds Ratio (M‐H, Random, 95% CI) | 0.33 [0.01, 8.31] |
| Outcome or subgroup title | No. of studies | No. of participants | Statistical method | Effect size |
| 1 Primary outcome (response) at 2 weeks Show forest plot | 2 | 300 | Odds Ratio (M‐H, Random, 95% CI) | 1.14 [0.64, 2.04] |
| 1.1 vs Trazodone | 2 | 300 | Odds Ratio (M‐H, Random, 95% CI) | 1.14 [0.64, 2.04] |
| 2 Primary outcome (response) at end of the acute‐phase treatment Show forest plot | 2 | 300 | Odds Ratio (M‐H, Random, 95% CI) | 1.50 [0.95, 2.37] |
| 2.1 vs Trazodone | 2 | 300 | Odds Ratio (M‐H, Random, 95% CI) | 1.50 [0.95, 2.37] |
| 3 Secondary outcome (remission) at 2 weeks Show forest plot | 2 | 300 | Odds Ratio (M‐H, Random, 95% CI) | 1.0 [0.36, 2.80] |
| 3.1 vs Trazodone | 2 | 300 | Odds Ratio (M‐H, Random, 95% CI) | 1.0 [0.36, 2.80] |
| 4 Secondary outcome (remission) at end of the acute‐phase treatment Show forest plot | 2 | 300 | Odds Ratio (M‐H, Random, 95% CI) | 1.38 [0.76, 2.52] |
| 4.1 vs Trazodone | 2 | 300 | Odds Ratio (M‐H, Random, 95% CI) | 1.38 [0.76, 2.52] |
| 5 Secondary outcome (withdrawal due to any reason) Show forest plot | 2 | 300 | Odds Ratio (M‐H, Random, 95% CI) | 0.90 [0.47, 1.72] |
| 5.1 vs Trazodone | 2 | 300 | Odds Ratio (M‐H, Random, 95% CI) | 0.90 [0.47, 1.72] |
| 6 Secondary outcome (withdrawal due to adverse events) Show forest plot | 2 | 300 | Odds Ratio (M‐H, Random, 95% CI) | 0.61 [0.25, 1.51] |
| 6.1 vs Trazodone | 2 | 300 | Odds Ratio (M‐H, Random, 95% CI) | 0.61 [0.25, 1.51] |
| 7 Hypertension/Tachycardia Show forest plot | 1 | 100 | Odds Ratio (M‐H, Random, 95% CI) | 0.31 [0.06, 1.59] |
| 7.1 vs Trazodone | 1 | 100 | Odds Ratio (M‐H, Random, 95% CI) | 0.31 [0.06, 1.59] |
| 8 Hypotension/Bradycardia Show forest plot | 2 | 300 | Odds Ratio (M‐H, Random, 95% CI) | 0.17 [0.03, 1.00] |
| 8.1 vs Trazodone | 2 | 300 | Odds Ratio (M‐H, Random, 95% CI) | 0.17 [0.03, 1.00] |
| 9 Constipation Show forest plot | 1 | 100 | Odds Ratio (M‐H, Random, 95% CI) | 0.70 [0.26, 1.83] |
| 9.1 vs Trazodone | 1 | 100 | Odds Ratio (M‐H, Random, 95% CI) | 0.70 [0.26, 1.83] |
| 10 Dry mouth/Decreased salivation Show forest plot | 2 | 300 | Odds Ratio (M‐H, Random, 95% CI) | 0.39 [0.11, 1.37] |
| 10.1 vs Trazodone | 2 | 300 | Odds Ratio (M‐H, Random, 95% CI) | 0.39 [0.11, 1.37] |
| 11 Nausea/Vomiting/Gastric distress Show forest plot | 1 | 100 | Odds Ratio (M‐H, Random, 95% CI) | 0.68 [0.20, 2.32] |
| 11.1 vs Trazodone | 1 | 100 | Odds Ratio (M‐H, Random, 95% CI) | 0.68 [0.20, 2.32] |
| 12 Weight gain/Increased appetite Show forest plot | 1 | 100 | Odds Ratio (M‐H, Random, 95% CI) | 4.95 [1.30, 18.81] |
| 12.1 vs Trazodone | 1 | 100 | Odds Ratio (M‐H, Random, 95% CI) | 4.95 [1.30, 18.81] |
| 13 Weight loss/Anorexia Show forest plot | 1 | 100 | Odds Ratio (M‐H, Random, 95% CI) | 0.33 [0.01, 8.21] |
| 13.1 vs Trazodone | 1 | 100 | Odds Ratio (M‐H, Random, 95% CI) | 0.33 [0.01, 8.21] |
| 14 Anxiety/Agitation Show forest plot | 2 | 300 | Odds Ratio (M‐H, Random, 95% CI) | 0.62 [0.19, 1.96] |
| 14.1 vs Trazodone | 2 | 300 | Odds Ratio (M‐H, Random, 95% CI) | 0.62 [0.19, 1.96] |
| 15 Dizziness/Vertigo/Faintness Show forest plot | 2 | 300 | Odds Ratio (M‐H, Random, 95% CI) | 0.64 [0.30, 1.39] |
| 15.1 vs Trazodone | 2 | 300 | Odds Ratio (M‐H, Random, 95% CI) | 0.64 [0.30, 1.39] |
| 16 Headache Show forest plot | 1 | 100 | Odds Ratio (M‐H, Random, 95% CI) | 0.65 [0.23, 1.87] |
| 16.1 vs Trazodone | 1 | 100 | Odds Ratio (M‐H, Random, 95% CI) | 0.65 [0.23, 1.87] |
| 17 Sleep disturbance Show forest plot | 1 | 200 | Odds Ratio (M‐H, Random, 95% CI) | 0.42 [0.13, 1.42] |
| 17.1 vs Trazodone | 1 | 200 | Odds Ratio (M‐H, Random, 95% CI) | 0.42 [0.13, 1.42] |
| 18 Sleepiness/Drowsiness/Somnolence Show forest plot | 2 | 300 | Odds Ratio (M‐H, Random, 95% CI) | 0.62 [0.29, 1.36] |
| 18.1 vs Trazodone | 2 | 300 | Odds Ratio (M‐H, Random, 95% CI) | 0.62 [0.29, 1.36] |
| 19 Completed suicide Show forest plot | 1 | 200 | Odds Ratio (M‐H, Random, 95% CI) | 3.03 [0.12, 75.28] |
| 19.1 vs Trazodone | 1 | 200 | Odds Ratio (M‐H, Random, 95% CI) | 3.03 [0.12, 75.28] |
| 20 Suicide attempt Show forest plot | 1 | 200 | Odds Ratio (M‐H, Random, 95% CI) | 2.02 [0.18, 22.65] |
| 20.1 vs Trazodone | 1 | 200 | Odds Ratio (M‐H, Random, 95% CI) | 2.02 [0.18, 22.65] |
| Outcome or subgroup title | No. of studies | No. of participants | Statistical method | Effect size |
| 1 Primary outcome (response) at 2 weeks Show forest plot | 1 | 40 | Odds Ratio (M‐H, Random, 95% CI) | 1.0 [0.18, 5.67] |
| 1.1 vs Reboxetine | 1 | 40 | Odds Ratio (M‐H, Random, 95% CI) | 1.0 [0.18, 5.67] |
| 2 Primary outcome (response) at end of the acute‐phase treatment Show forest plot | 1 | 40 | Odds Ratio (M‐H, Random, 95% CI) | 1.0 [0.27, 3.67] |
| 2.1 vs Reboxetine | 1 | 40 | Odds Ratio (M‐H, Random, 95% CI) | 1.0 [0.27, 3.67] |
| 3 Secondary outcome (remission) at 2 weeks Show forest plot | 1 | 40 | Odds Ratio (M‐H, Random, 95% CI) | 1.0 [0.06, 17.18] |
| 3.1 vs Reboxetine | 1 | 40 | Odds Ratio (M‐H, Random, 95% CI) | 1.0 [0.06, 17.18] |
| 4 Secondary outcome (remission) at end of the acute‐phase treatment Show forest plot | 1 | 40 | Odds Ratio (M‐H, Random, 95% CI) | 1.26 [0.33, 4.73] |
| 4.1 vs Reboxetine | 1 | 40 | Odds Ratio (M‐H, Random, 95% CI) | 1.26 [0.33, 4.73] |
| 5 Secondary outcome (depression severity) at 2 weeks Show forest plot | 1 | 40 | Std. Mean Difference (IV, Random, 95% CI) | ‐0.37 [‐1.00, 0.25] |
| 5.1 vs Reboxetine | 1 | 40 | Std. Mean Difference (IV, Random, 95% CI) | ‐0.37 [‐1.00, 0.25] |
| 6 Secondary outcome (withdrawal due to any reason) Show forest plot | 2 | 80 | Odds Ratio (M‐H, Random, 95% CI) | 0.0 [0.0, 0.0] |
| 6.1 vs Reboxetine | 2 | 80 | Odds Ratio (M‐H, Random, 95% CI) | 0.0 [0.0, 0.0] |
| 7 Secondary outcome (withdrawal due to adverse events) Show forest plot | 2 | 80 | Odds Ratio (M‐H, Random, 95% CI) | 0.0 [0.0, 0.0] |
| 7.1 vs Reboxetine | 2 | 80 | Odds Ratio (M‐H, Random, 95% CI) | 0.0 [0.0, 0.0] |
| 8 Secondary outcome (SKEWED DATA: depression severity) at end of the acute‐phase treatment Show forest plot | Other data | No numeric data | ||
| Outcome or subgroup title | No. of studies | No. of participants | Statistical method | Effect size |
| 1 vs all compounds Show forest plot | 26 | 4882 | Risk Ratio (M‐H, Fixed, 99% CI) | 1.05 [0.99, 1.12] |
| 1.1 vs Amitriptyline | 6 | 929 | Risk Ratio (M‐H, Fixed, 99% CI) | 0.95 [0.82, 1.11] |
| 1.2 vs Clomipramine | 1 | 174 | Risk Ratio (M‐H, Fixed, 99% CI) | 0.97 [0.74, 1.26] |
| 1.3 vs Doxepin | 1 | 163 | Risk Ratio (M‐H, Fixed, 99% CI) | 0.95 [0.71, 1.26] |
| 1.4 vs Nortriptyline | 1 | 235 | Risk Ratio (M‐H, Fixed, 99% CI) | 0.94 [0.59, 1.49] |
| 1.5 vs Citalolpram | 1 | 270 | Risk Ratio (M‐H, Fixed, 99% CI) | 0.96 [0.85, 1.09] |
| 1.6 vs Fluoxetine | 5 | 622 | Risk Ratio (M‐H, Fixed, 99% CI) | 1.18 [1.00, 1.39] |
| 1.7 vs Paroxetine | 3 | 726 | Risk Ratio (M‐H, Fixed, 99% CI) | 1.13 [0.93, 1.38] |
| 1.8 vs Sertraline | 2 | 596 | Risk Ratio (M‐H, Fixed, 99% CI) | 0.99 [0.83, 1.17] |
| 1.9 vs Fluvoxamine | 1 | 412 | Risk Ratio (M‐H, Fixed, 99% CI) | 1.05 [0.86, 1.28] |
| 1.10 vs Venlafaxine | 2 | 415 | Risk Ratio (M‐H, Fixed, 99% CI) | 1.24 [0.96, 1.60] |
| 1.11 vs Trazodone | 2 | 300 | Risk Ratio (M‐H, Fixed, 99% CI) | 1.21 [0.91, 1.61] |
| 1.12 vs Reboxetine | 1 | 40 | Risk Ratio (M‐H, Fixed, 99% CI) | 1.0 [0.55, 1.82] |