Tratamiento de la invaginación intestinal en niños
Appendices
Appendix 1. CENTRAL search strategy
CENTRAL (2016, Issue 8)
#1 MeSH descriptor Intussusception explode all trees
#2 ((intestin* and invagination*) or intususcep* or intussuscep*):ti,ab,kw
#3 (#1 OR #2)
#4 MeSH descriptor Infant explode all trees
#5 MeSH descriptor Child explode all trees
#6 (infant* or child* or newborn*):ti,ab,kw
#7 (#4 OR #5 OR #6)
#8 (#3 AND #7)
Appendix 2. MEDLINE search strategy
MEDLINE (Ovid 1950 to September 2016)
1. exp Intussusception/
2. ((intestin* and invagination*) or intususcep* or intussuscep*).mp.
3. 1 or 2
4. exp Infant/
5. exp Child/
6. (infant* or child* or newborn*).mp.
7. 4 or 5 or 6
8. 3 and 7
9. randomized controlled trial.pt.
10. controlled clinical trial.pt.
11. randomized.ab.
12. placebo.ab.
13. drug therapy.fs.
14. Randomly.ab.
15. trial.ab.
16. groups.ab.
17. 9 or 10 or 11 or 12 or 13 or 14 or 15 or 16
18. exp animals/ not humans.sh.
19. 17 not 18
20. 8 and 19
Appendix 3. Embase search strategy
Embase (Ovid, 1974 to September 2016)
1. exp intussusception/
2. ((intestin* and invagination*) or intususcep* or intussuscep*).mp.
3. 1 or 2
4. exp child/
5. (infant* or child* or newborn*).mp.
6. 4 or 5
7. 3 and 6
8. CROSSOVER PROCEDURE.sh.
9. DOUBLE‐BLIND PROCEDURE.sh.
10. SINGLE‐BLIND PROCEDURE.sh.
11. (crossover* or cross over*).ti,ab.
12. placebo*.ti,ab.
13. (doubl* adj blind*).ti,ab.
14. allocat*.ti,ab.
15. trial.ti.
16. RANDOMIZED CONTROLLED TRIAL.sh.
17. random*.ti,ab.
18. 8 or 9 or 10 or 11 or 12 or 13 or 14 or 15 or 16 or 17
19. (exp animal/ or exp invertebrate/ or animal.hw. or nonhuman/) not (exp human/ or human cell/ or (human or humans or man or men or wom?n).ti.)
20. 18 not 19
21. 7 and 20
Appendix 4. Science Citation Index search strategy
Science Citation Index Expanded (via Web of Science) (1900 to September 2016)
#1 Topic=(((intestin* and invagination*) or intususcep* or intussuscep*))
#2 Topic=((infant* or child* or newborn*))
#3 Topic=((controlled trial or controlled clinical trial or placebo or clinical trial or random* or trial or cct or rct))
#4 (#3 AND #2 AND #1)
Appendix 5. Biosis Previews search strategy
Biosis Previews (via Web of Science) (1969 to September 2016)
#1 Topic=(((intestin* and invagination*) or intususcep* or intussuscep*))
#2 Topic=((infant* or child* or newborn*))
#3 Topic=((controlled trial or controlled clinical trial or placebo or clinical trial or random* or trial or cct or rct))
#4 (#3 AND #2 AND #1)
Appendix 6. Criteria for judging risk of bias in the 'Risk of bias' assessment tool
| RANDOM SEQUENCE GENERATION Selection bias (biased allocation to interventions) due to inadequate generation of a randomised sequence | |
| Criteria for a judgement of ‘Low risk’ of bias | The investigators describe a random component in the sequence generation process such as:
*Minimization may be implemented without a random element, and this is considered to be equivalent to being random. |
| Criteria for the judgement of ‘High risk’ of bias. | The investigators describe a non‐random component in the sequence generation process. Usually, the description would involve some systematic, non‐random approach, for example:
Other non‐random approaches happen much less frequently than the systematic approaches mentioned above and tend to be obvious. They usually involve judgement or some method of non‐random categorization of participants, for example:
|
| Criteria for the judgement of ‘Unclear risk’ of bias. | Insufficient information about the sequence generation process to permit judgement of ‘Low risk’ or ‘High risk’. |
| ALLOCATION CONCEALMENT Selection bias (biased allocation to interventions) due to inadequate concealment of allocations prior to assignment. | |
| Criteria for a judgement of ‘Low risk’ of bias. | Participants and investigators enrolling participants could not foresee assignment because one of the following, or an equivalent method, was used to conceal allocation:
|
| Criteria for the judgement of ‘High risk’ of bias. | Participants or investigators enrolling participants could possibly foresee assignments and thus introduce selection bias, such as allocation based on:
|
| Criteria for the judgement of ‘Unclear risk’ of bias. | Insufficient information to permit judgement of ‘Low risk’ or ‘High risk’. This is usually the case if the method of concealment is not described or not described in sufficient detail to allow a definite judgement – for example if the use of assignment envelopes is described, but it remains unclear whether envelopes were sequentially numbered, opaque and sealed. |
| BLINDING OF PARTICIPANTS AND PERSONNEL Performance bias due to knowledge of the allocated interventions by participants and personnel during the study. | |
| Criteria for a judgement of ‘Low risk’ of bias. | Any one of the following:
|
| Criteria for the judgement of ‘High risk’ of bias. | Any one of the following:
|
| Criteria for the judgement of ‘Unclear risk’ of bias. | Any one of the following:
|
| BLINDING OF OUTCOME ASSESSMENT Detection bias due to knowledge of the allocated interventions by outcome assessors. | |
| Criteria for a judgement of ‘Low risk’ of bias. | Any one of the following: · No blinding of outcome assessment, but the review authors judge that the outcome measurement is not likely to be influenced by lack of blinding; · Blinding of outcome assessment ensured, and unlikely that the blinding could have been broken. |
| Criteria for the judgement of ‘High risk’ of bias. | Any one of the following:
|
| Criteria for the judgement of ‘Unclear risk’ of bias. | Any one of the following:
|
| INCOMPLETE OUTCOME DATA Attrition bias due to amount, nature or handling of incomplete outcome data. | |
| Criteria for a judgement of ‘Low risk’ of bias. | Any one of the following:
|
| Criteria for the judgement of ‘High risk’ of bias. | Any one of the following:
|
| Criteria for the judgement of ‘Unclear risk’ of bias. | Any one of the following:
|
| SELECTIVE REPORTING Reporting bias due to selective outcome reporting. | |
| Criteria for a judgement of ‘Low risk’ of bias. | Any of the following:
|
| Criteria for the judgement of ‘High risk’ of bias. | Any one of the following:
|
| Criteria for the judgement of ‘Unclear risk’ of bias. | Insufficient information to permit judgement of ‘Low risk’ or ‘High risk’. It is likely that the majority of studies will fall into this category. |
| OTHER BIAS Bias due to problems not covered elsewhere in the table. | |
| Criteria for a judgement of ‘Low risk’ of bias. | The study appears to be free of other sources of bias. |
| Criteria for the judgement of ‘High risk’ of bias. | There is at least one important risk of bias. For example, the study:
|
| Criteria for the judgement of ‘Unclear risk’ of bias. | There may be a risk of bias, but there is either:
|

Study flow diagram for identification of randomised trials exploring management of intussusception in children.

Risk of bias summary: review authors' judgements about each risk of bias item for each included study.

Risk of bias graph: review authors' judgements about each risk of bias item presented as percentages across all included studies.
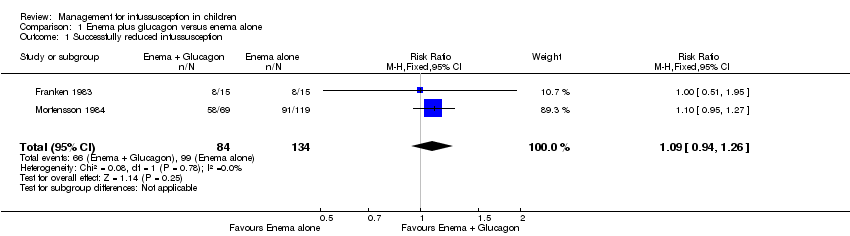
Comparison 1 Enema plus glucagon versus enema alone, Outcome 1 Successfully reduced intussusception.
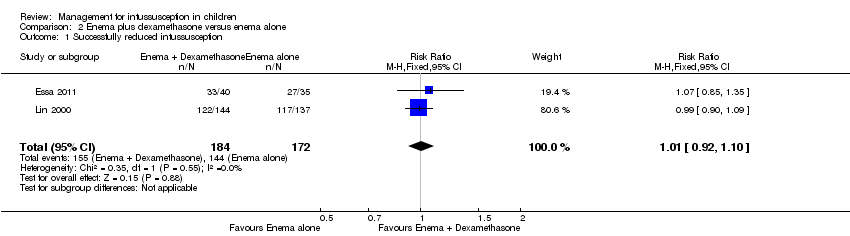
Comparison 2 Enema plus dexamethasone versus enema alone, Outcome 1 Successfully reduced intussusception.

Comparison 2 Enema plus dexamethasone versus enema alone, Outcome 2 Bowel perforation(s).

Comparison 2 Enema plus dexamethasone versus enema alone, Outcome 3 Recurrent intussusception.

Comparison 2 Enema plus dexamethasone versus enema alone, Outcome 4 Bowel resection.
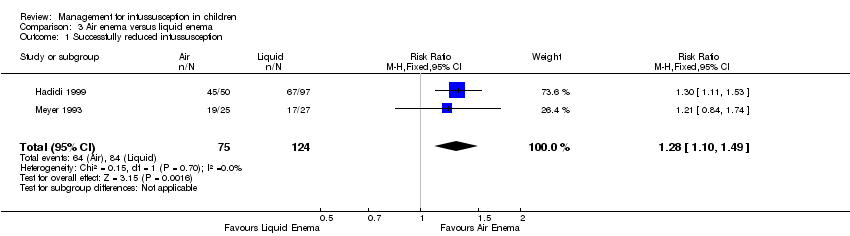
Comparison 3 Air enema versus liquid enema, Outcome 1 Successfully reduced intussusception.
| Enema plus glucagon versus enema alone summary of findings table | |||||
| Patient or population: children with intussusception | |||||
| Outcomes | Anticipated absolute effects* (95% CI) | Relative effect | Number of participants | Quality of the evidence | |
| Risk with liquid enema alone | Risk with liquid enema plus glucagon | ||||
| Successfully reduced intussusception | Study population | RR 1.09 | 218 | Lowa | |
| 739 per 1000 | 805 per 1000 | ||||
| Moderate | |||||
| 649 per 1000 | 707 per 1000 | ||||
| Bowel perforation(s) | Outcome not reported in any studies | ||||
| Recurrent intussusception (follow‐up: 6 months) | Outcome not reported in any studies | ||||
| Bowel resection | Outcome not reported in any studies | ||||
| Postoperative complication(s) | Outcome not reported in any studies | ||||
| *The risk in the intervention group (and its 95% confidence interval) is based on assumed risk in the comparison group and relative effect of the intervention (and its 95% CI) | |||||
| GRADE Working Group grades of evidence | |||||
| aDowngraded two levels for serious concerns for high risk of selection, attrition, and performance bias | |||||
| Enema plus dexamethasone versus enema alone summary of findings table | |||||
| Patient or population: children with intussusception | |||||
| Outcomes | Anticipated absolute effects* (95% CI) | Relative effect | Number of participants | Quality of the evidence | |
| Risk with enema alone | Risk with enema plus dexamethasone | ||||
| Successfully reduced intussusception | Study population | RR 1.01 | 356 | Lowa | |
| 157 per 1000 | 159 per 1000 | ||||
| Moderate | |||||
| 771 per 1000 | 779 per 1000 | ||||
| Bowel perforation(s) | Study population | RR 2.63 | 75 | Lowb,c | |
| 125 per 1000 | 329 per 1000 | ||||
| Moderate | |||||
| 125 per 1000 | 48 per 1000 | ||||
| Recurrent intussusception (follow‐up: 6 months) | Study population | RR 0.14 | 299 | Lowa | |
| 69 per 1000 | 10 per 1000 | ||||
| Moderate | |||||
| 370 per 1000 | 52 per 1000 | ||||
| Bowel resection | Study population | RR 0.88 | 75 | Lowb,c | |
| 86 per 1000 | 75 per 1000 | ||||
| Moderate | |||||
| 375 per 1000 | 330 per 1000 | ||||
| Postoperative complication(s) | Outcome not reported in any studies | ||||
| *The risk in the intervention group (and its 95% confidence interval) is based on assumed risk in the comparison group and relative effect of the intervention (and its 95% CI) | |||||
| GRADE Working Group grades of evidence | |||||
| aDowngraded two levels for serious concerns for high risk of attrition and performance bias bDowngraded one level for serious imprecision (95% CI is wide and includes null effect) cDowngraded one level for concerns for high risk of performance bias | |||||
| Air enema versus liquid enema summary of findings table | |||||
| Patient or population: children with intussusception | |||||
| Outcomes | Anticipated absolute effects* (95% CI) | Relative effect | Number of participants | Quality of the evidence | |
| Risk with liquid contrast enema | Risk with air enema | ||||
| Successfully reduced intussusception | Study population | RR 1.28 | 199 | Lowa | |
| 677 per 1000 | 867 per 1000 | ||||
| Moderate | |||||
| 712 per 1000 | 911 per 1000 | ||||
| Bowel perforation(s) | Outcome not reported in any studies | ||||
| Recurrence of intussusception (follow‐up: 6 months) | Outcome not reported in any studies | ||||
| Bowel resection | Outcome not reported in any studies | ||||
| Postoperative complication(s) | Outcome not reported in any studies | ||||
| *The risk in the intervention group (and its 95% confidence interval) is based on assumed risk in the comparison group and relative effect of the intervention (and its 95% CI) | |||||
| GRADE Working Group grades of evidence | |||||
| aDowngraded two levels for serious concerns for high risk of selection, performance, and detection bias | |||||
| Outcome or subgroup title | No. of studies | No. of participants | Statistical method | Effect size |
| 1 Successfully reduced intussusception Show forest plot | 2 | 218 | Risk Ratio (M‐H, Fixed, 95% CI) | 1.09 [0.94, 1.26] |
| Outcome or subgroup title | No. of studies | No. of participants | Statistical method | Effect size |
| 1 Successfully reduced intussusception Show forest plot | 2 | 356 | Risk Ratio (M‐H, Fixed, 95% CI) | 1.01 [0.92, 1.10] |
| 2 Bowel perforation(s) Show forest plot | 1 | 75 | Risk Ratio (M‐H, Fixed, 95% CI) | 2.63 [0.11, 62.66] |
| 3 Recurrent intussusception Show forest plot | 2 | 299 | Risk Ratio (M‐H, Fixed, 95% CI) | 0.14 [0.03, 0.60] |
| 4 Bowel resection Show forest plot | 1 | 75 | Risk Ratio (M‐H, Fixed, 95% CI) | 0.88 [0.19, 4.06] |
| Outcome or subgroup title | No. of studies | No. of participants | Statistical method | Effect size |
| 1 Successfully reduced intussusception Show forest plot | 2 | 199 | Risk Ratio (M‐H, Fixed, 95% CI) | 1.28 [1.10, 1.49] |