Scolaris Content Display Scolaris Content Display

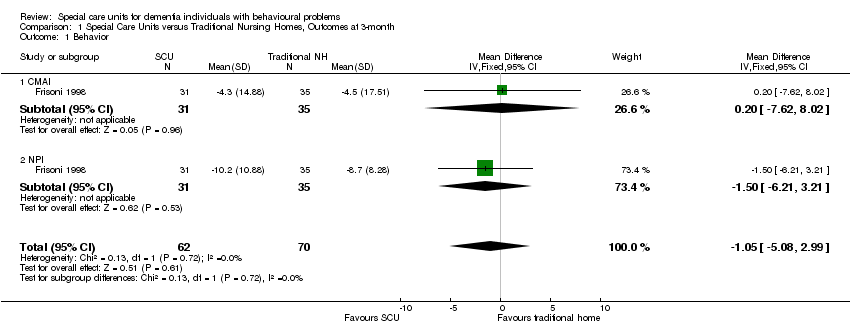
Comparison 1 Special Care Units versus Traditional Nursing Homes, Outcomes at 3‐month, Outcome 1 Behavior.
Figuras y tablas -
Analysis 1.1

Comparison 1 Special Care Units versus Traditional Nursing Homes, Outcomes at 3‐month, Outcome 1 Behavior.

Comparison 1 Special Care Units versus Traditional Nursing Homes, Outcomes at 3‐month, Outcome 2 Mood and/or Affect.
Figuras y tablas -
Analysis 1.2

Comparison 1 Special Care Units versus Traditional Nursing Homes, Outcomes at 3‐month, Outcome 2 Mood and/or Affect.

Comparison 1 Special Care Units versus Traditional Nursing Homes, Outcomes at 3‐month, Outcome 3 Psychotropic Drug Use.
Figuras y tablas -
Analysis 1.3

Comparison 1 Special Care Units versus Traditional Nursing Homes, Outcomes at 3‐month, Outcome 3 Psychotropic Drug Use.

Comparison 1 Special Care Units versus Traditional Nursing Homes, Outcomes at 3‐month, Outcome 4 Use of Physical Restraint.
Figuras y tablas -
Analysis 1.4

Comparison 1 Special Care Units versus Traditional Nursing Homes, Outcomes at 3‐month, Outcome 4 Use of Physical Restraint.

Comparison 2 Special Care Units versus Traditional Nursing Homes, Outcomes at 6‐month, Outcome 1 Behavior.
Figuras y tablas -
Analysis 2.1

Comparison 2 Special Care Units versus Traditional Nursing Homes, Outcomes at 6‐month, Outcome 1 Behavior.

Comparison 2 Special Care Units versus Traditional Nursing Homes, Outcomes at 6‐month, Outcome 2 Behavior at 6 months (change scores not available).
Figuras y tablas -
Analysis 2.2

Comparison 2 Special Care Units versus Traditional Nursing Homes, Outcomes at 6‐month, Outcome 2 Behavior at 6 months (change scores not available).

Study

SCU

Mean pre‐test score (SD not reported)

Traditional NH

Mean pre‐test score (SD not reported)

SCU

Mean post‐test score (SD not reported)

Traditional NH

Mean post‐test score (SD not reported)

SCU

Mean change score (Pooled SD not reported)

Traditional NH

Mean change score (Pooled SD not reported)

Feeling Tone Score ‐ Verbal

Webber 1995

n=12

n=10

n=12

n=10

n=12

n=10

Webber 1995

7.6

8.4

6.5

4.7

‐1.1

‐3.7

Feeling Tone Score ‐ Non verbal

Webber 1995

n=12

n=10

n=12

n=10

n=12

Tn=10

Webber 1995

55.7

38.9

42.0

36.4

‐13.7

‐2.5

Figuras y tablas -
Analysis 2.3

Comparison 2 Special Care Units versus Traditional Nursing Homes, Outcomes at 6‐month, Outcome 3 Mood and/or Affect.

Comparison 2 Special Care Units versus Traditional Nursing Homes, Outcomes at 6‐month, Outcome 4 Quality of Life.
Figuras y tablas -
Analysis 2.4

Comparison 2 Special Care Units versus Traditional Nursing Homes, Outcomes at 6‐month, Outcome 4 Quality of Life.

Comparison 2 Special Care Units versus Traditional Nursing Homes, Outcomes at 6‐month, Outcome 5 Psychotropic Drug Use.
Figuras y tablas -
Analysis 2.5

Comparison 2 Special Care Units versus Traditional Nursing Homes, Outcomes at 6‐month, Outcome 5 Psychotropic Drug Use.

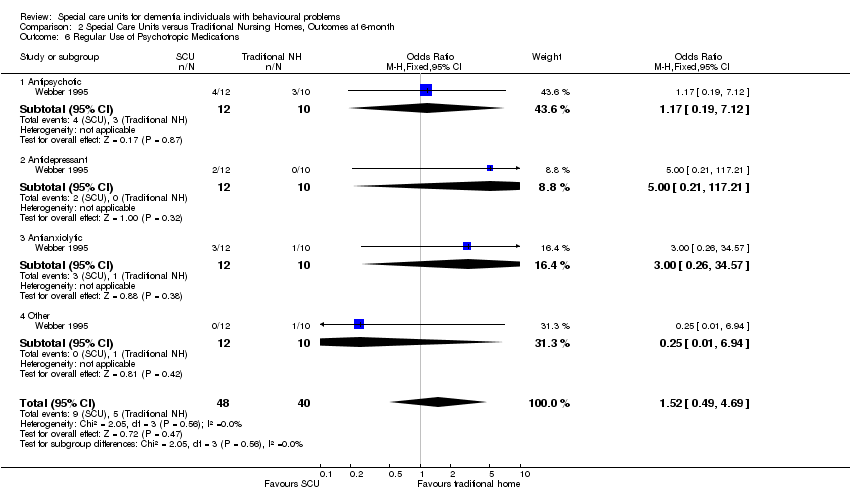
Comparison 2 Special Care Units versus Traditional Nursing Homes, Outcomes at 6‐month, Outcome 6 Regular Use of Psychotropic Medications.
Figuras y tablas -
Analysis 2.6

Comparison 2 Special Care Units versus Traditional Nursing Homes, Outcomes at 6‐month, Outcome 6 Regular Use of Psychotropic Medications.

Comparison 2 Special Care Units versus Traditional Nursing Homes, Outcomes at 6‐month, Outcome 7 PRN Use of Psychotropic Medication.
Figuras y tablas -
Analysis 2.7

Comparison 2 Special Care Units versus Traditional Nursing Homes, Outcomes at 6‐month, Outcome 7 PRN Use of Psychotropic Medication.

Comparison 2 Special Care Units versus Traditional Nursing Homes, Outcomes at 6‐month, Outcome 8 Use of Physical Restraint.
Figuras y tablas -
Analysis 2.8

Comparison 2 Special Care Units versus Traditional Nursing Homes, Outcomes at 6‐month, Outcome 8 Use of Physical Restraint.

Comparison 3 Special Care Units versus Traditional Nursing Homes, Outcomes at 12‐month, Outcome 1 Behaviour.
Figuras y tablas -
Analysis 3.1

Comparison 3 Special Care Units versus Traditional Nursing Homes, Outcomes at 12‐month, Outcome 1 Behaviour.

Comparison 3 Special Care Units versus Traditional Nursing Homes, Outcomes at 12‐month, Outcome 2 Quality of Life.
Figuras y tablas -
Analysis 3.2

Comparison 3 Special Care Units versus Traditional Nursing Homes, Outcomes at 12‐month, Outcome 2 Quality of Life.

Comparison 3 Special Care Units versus Traditional Nursing Homes, Outcomes at 12‐month, Outcome 3 Psychotrophic Drug Use.
Figuras y tablas -
Analysis 3.3

Comparison 3 Special Care Units versus Traditional Nursing Homes, Outcomes at 12‐month, Outcome 3 Psychotrophic Drug Use.

Comparison 3 Special Care Units versus Traditional Nursing Homes, Outcomes at 12‐month, Outcome 4 Use of Physical Restraint.
Figuras y tablas -
Analysis 3.4

Comparison 3 Special Care Units versus Traditional Nursing Homes, Outcomes at 12‐month, Outcome 4 Use of Physical Restraint.

Study

SCU

Mean no. of times pre‐intervention

SCU

Mean no. of times post‐intervention

SCU

Change: pre‐ and post‐intervention

Traditional NH units

Mean no. of times pre‐intervention

Traditional NH units

Mean no. of times post‐intervention

Traditional NH units

Change: pre‐ and post‐intervention

P‐value

Swanson 1993

n=13

n=13
Mean no. of times

n=13

n=9
Mean no. of times pre‐intervention

n=9
Mean no. of times post‐intervention

n=9
Change from pre‐ to post‐intervention

Reported p‐value comparing pre‐ and post‐intervention

Swanson 1993

156

48

‐ 108

82

46

‐36

0.035

Figuras y tablas -
Analysis 3.5

Comparison 3 Special Care Units versus Traditional Nursing Homes, Outcomes at 12‐month, Outcome 5 Other Behaviour ‐ Catastrophic Reactions.

Comparison 4 Special Care Units versus Traditional Nursing Homes, Outcomes at 18‐month, Outcome 1 Behaviour.
Figuras y tablas -
Analysis 4.1

Comparison 4 Special Care Units versus Traditional Nursing Homes, Outcomes at 18‐month, Outcome 1 Behaviour.

Comparison 4 Special Care Units versus Traditional Nursing Homes, Outcomes at 18‐month, Outcome 2 Psychotropic Drug Use.
Figuras y tablas -
Analysis 4.2

Comparison 4 Special Care Units versus Traditional Nursing Homes, Outcomes at 18‐month, Outcome 2 Psychotropic Drug Use.

Comparison 4 Special Care Units versus Traditional Nursing Homes, Outcomes at 18‐month, Outcome 3 Use of Physical Restraint.
Figuras y tablas -
Analysis 4.3

Comparison 4 Special Care Units versus Traditional Nursing Homes, Outcomes at 18‐month, Outcome 3 Use of Physical Restraint.

Table 1. Outcome Measures Used in Included Studies

Name of measure

Source

Descriptioin

Maximum score

How to complete

Cohen‐Mansfield Agitation Inventory (CMAI)

Cohen‐Mansfield et al. 1989

Assess agitated behaviours, 29 items using a 7‐point scale. There is also a short form (14 items)

203; maximum 70 for CMAI short‐form; higher score means higher level of agitation

Caregiver rating the frequency of occurrence in the last 14 days

Neuropsychiatric Inventory

Cummings et al. 1994

Assess the presence, frequency and severity of 12 neuropsychiatric behaviours in the previous month

144

Caregiver rating

Cornell Scale for Depression in Dementia

Alexopoulos 1988

A 19‐item scale measuring depressive symptoms

0‐38

Caregiver and patient interviews

Feeling Tone Interview Instrument

Toner 1991

A 16‐items questionnaire assessing an individual's affect

16‐80

Patient interview

Figuras y tablas -
Table 1. Outcome Measures Used in Included Studies
Table 2. Search Results for Non‐RCT review

Category

CDCIG search

Subsequent search

Irrelevant, not related to SCU

13

2

Studies related aspects of dementia care but irrelevant to the review topic, e.g., an intervention

7

5

Excluded because studies did not compare between SCU and non‐SCU

3

6

Excluded because of methodological concerns, e.g., postal questionnaire, retrospective chart audit, biased sample

7

Included (Referring to the same study: (i) Swanson 1993 & 1994; (ii) Gozzetti & Frisoni

5

9

Total

28

29

Figuras y tablas -
Table 2. Search Results for Non‐RCT review
Table 3. Number of Eligible Non‐RCTs for Review

Category

CDCIG Search

Subsequent Search

Eligible studies

5 (Frisoni 1998; Leon 1999; Nobili 2006; Swanson 1993 & 1994)

9 (Chappell 2000; Frisoni 1998; Gozzetti 1999; Nobili 2006; Reimer 2004; Swanson 1993 & 1994, Weyerer 2005)

Referring to the same study

Swanson 1993 & 1994

Frisoni 1998 & Gozzetti 1999

Overlaps between CDCIG and subsequent search

4 (Frisoni 1998; Nobili 2006; Swanson 1993 & 1994)

4 (Frisoni 1998; Nobili 2006; Swanson 1993 & 1994)

Total number of eligible non‐RCTs for review = 8

4 (Frisoni 1998; Leon 1999; Nobili 2006; Swanson 1993)

4 (other than those already located by CDCIG search ‐ Chappell 2000; Reimer 2004; Webber 1995; Weyerer 2005)

Figuras y tablas -
Table 3. Number of Eligible Non‐RCTs for Review
Table 4. Special care units versus traditional nursing homes: summary of overall effect

Outcome measure

3‐month WMD (95% CI)

3‐month z score (P)

6‐month WMD (95% CI)

6‐month z score (P)

12‐month WMD (95% CI

12‐month z score (P)

18‐month WMD (95% CI

18‐month z score (P)

Agitation
(NPI & CMAI)
Agitation
(NPI & CMAI)

‐1.05
(‐5.08, 2.99)

0.51
(p=0.61)

‐4.30
(‐7.22, ‐1.38)

2.88
(p=0.004) *

‐5.9
(‐8.99, ‐2.81)

3.74
(p=0.0002) *

‐5.40
(‐9.16, ‐1.65)

2.82
(p=0.005) *

Agitation
(CMAI at 6‐month)
Agitation
(CMAI at 6‐month)

0.74
(‐0.34, 1.82)

1.34
(p=0.18)

Agitation
(Catastrophic reactions)

No analysable data

No analysable data

Mood &/or Affect
(Cornell Scale)

‐6.30
(‐7.88, ‐4.72)

7.81
(p<0.00001) *

Not estimable

Not estimable

QOL
(Activity participation and interactions)
QOL
(Activity participation and interactions)

OR: 0.90
(0.36, 2.22)

0.24
(P=0.81)

5.49
(‐2.17, 13.16)

1.40
(p=0.16)

Psychotropic Drug Use

‐0.10
(‐0.50, 0.30)

0.49
(p=0.62)

0.20
(0.00, 0.40)

1.96
(p=0.05) †

0.10
(0.12, 0.32)

0.91
(p=0.36)

0.10
(0.12, 0.32)

0.88
(p=0.38)

Regular Psychotropic Drug Use

OR: 1.52
(0.49, 4.69)

0.72
(p=0.47)

PRN Psychotropic Drug Use

OR: 2.84
(0.41, 19.89)

1.05
(p=0.29)

Physical Restraint Use

OR
(95% CI) 0.23
(0.05, 1.19)

1.75
(p=0.08)

OR
(95% CI) 0.46
(0.27, 0.80)

2.75
(p=0.006) *

OR
(95% CI) 0.49
(0.27, 0.88)

2.36
(p=0.02) *

OR
(95% CI) 0.54
(0.29, 1.03)

1.88
(p=0.06)

WMD: Weighted mean difference.

OR: Odds ratio.

PRN: Pro re nata "As needed".

* Favours treatment group.

† Favours control group.

Note: All results shown were computed from only one study except for "Physical Restraint Use" at six months, which included the results from Nobili 2006 and Webber 1985.

Figuras y tablas -
Table 4. Special care units versus traditional nursing homes: summary of overall effect
Comparison 1. Special Care Units versus Traditional Nursing Homes, Outcomes at 3‐month

Outcome or subgroup title

No. of studies

No. of participants

Statistical method

Effect size

1 Behavior Show forest plot

1

132

Mean Difference (IV, Fixed, 95% CI)

‐1.05 [‐5.08, 2.99]

1.1 CMAI

1

66

Mean Difference (IV, Fixed, 95% CI)

0.20 [‐7.62, 8.02]

1.2 NPI

1

66

Mean Difference (IV, Fixed, 95% CI)

‐1.50 [‐6.21, 3.21]

2 Mood and/or Affect Show forest plot

1

66

Mean Difference (IV, Fixed, 95% CI)

‐6.3 [‐7.88, ‐4.72]

2.1 Cornell Depression Scale

1

66

Mean Difference (IV, Fixed, 95% CI)

‐6.3 [‐7.88, ‐4.72]

3 Psychotropic Drug Use Show forest plot

1

66

Mean Difference (IV, Fixed, 95% CI)

‐0.1 [‐0.50, 0.30]

3.1 Mean number of Psychotropic Drugs

1

66

Mean Difference (IV, Fixed, 95% CI)

‐0.1 [‐0.50, 0.30]

4 Use of Physical Restraint Show forest plot

1

66

Odds Ratio (M‐H, Fixed, 95% CI)

0.23 [0.05, 1.19]

4.1 Use of Physical Restraint (All types)

1

66

Odds Ratio (M‐H, Fixed, 95% CI)

0.23 [0.05, 1.19]

Figuras y tablas -
Comparison 1. Special Care Units versus Traditional Nursing Homes, Outcomes at 3‐month
Comparison 2. Special Care Units versus Traditional Nursing Homes, Outcomes at 6‐month

Outcome or subgroup title

No. of studies

No. of participants

Statistical method

Effect size

1 Behavior Show forest plot

1

337

Mean Difference (IV, Fixed, 95% CI)

‐4.3 [‐7.22, ‐1.38]

1.1 NPI

1

337

Mean Difference (IV, Fixed, 95% CI)

‐4.3 [‐7.22, ‐1.38]

2 Behavior at 6 months (change scores not available) Show forest plot

1

596

Mean Difference (IV, Fixed, 95% CI)

0.74 [‐0.34, 1.82]

2.1 CMAI

1

596

Mean Difference (IV, Fixed, 95% CI)

0.74 [‐0.34, 1.82]

3 Mood and/or Affect Show forest plot

Other data

No numeric data

3.1 Feeling Tone Score ‐ Verbal

Other data

No numeric data

3.2 Feeling Tone Score ‐ Non verbal

Other data

No numeric data

4 Quality of Life Show forest plot

1

88

Odds Ratio (M‐H, Fixed, 95% CI)

0.90 [0.36, 2.22]

4.1 Activity Participation ‐ Formal

1

22

Odds Ratio (M‐H, Fixed, 95% CI)

7.35 [0.31, 173.13]

4.2 Activity Participation ‐ Informal

1

22

Odds Ratio (M‐H, Fixed, 95% CI)

0.09 [0.01, 0.65]

4.3 Exercise

1

22

Odds Ratio (M‐H, Fixed, 95% CI)

1.25 [0.14, 10.94]

4.4 Individual

1

22

Odds Ratio (M‐H, Fixed, 95% CI)

2.33 [0.40, 13.61]

5 Psychotropic Drug Use Show forest plot

1

340

Mean Difference (IV, Fixed, 95% CI)

0.20 [0.00, 0.40]

5.1 Mean number of Psychotropic Drugs

1

340

Mean Difference (IV, Fixed, 95% CI)

0.20 [0.00, 0.40]

6 Regular Use of Psychotropic Medications Show forest plot

1

88

Odds Ratio (M‐H, Fixed, 95% CI)

1.52 [0.49, 4.69]

6.1 Antipsychotic

1

22

Odds Ratio (M‐H, Fixed, 95% CI)

1.17 [0.19, 7.12]

6.2 Antidepressant

1

22

Odds Ratio (M‐H, Fixed, 95% CI)

5.0 [0.21, 117.21]

6.3 Antianxiolytic

1

22

Odds Ratio (M‐H, Fixed, 95% CI)

3.0 [0.26, 34.57]

6.4 Other

1

22

Odds Ratio (M‐H, Fixed, 95% CI)

0.25 [0.01, 6.94]

7 PRN Use of Psychotropic Medication Show forest plot

1

88

Odds Ratio (M‐H, Fixed, 95% CI)

2.84 [0.41, 19.89]

7.1 Antipsychotic

1

22

Odds Ratio (M‐H, Fixed, 95% CI)

1.80 [0.14, 23.37]

7.2 Antidepressant

1

22

Odds Ratio (M‐H, Fixed, 95% CI)

0.0 [0.0, 0.0]

7.3 Antianxiolytic

1

22

Odds Ratio (M‐H, Fixed, 95% CI)

5.0 [0.21, 117.21]

7.4 Other

1

22

Odds Ratio (M‐H, Fixed, 95% CI)

0.0 [0.0, 0.0]

8 Use of Physical Restraint Show forest plot

2

354

Odds Ratio (M‐H, Fixed, 95% CI)

0.46 [0.27, 0.80]

8.1 Use of Physical Restraint at 6 months (Change scores not available)

2

354

Odds Ratio (M‐H, Fixed, 95% CI)

0.46 [0.27, 0.80]

Figuras y tablas -
Comparison 2. Special Care Units versus Traditional Nursing Homes, Outcomes at 6‐month
Comparison 3. Special Care Units versus Traditional Nursing Homes, Outcomes at 12‐month

Outcome or subgroup title

No. of studies

No. of participants

Statistical method

Effect size

1 Behaviour Show forest plot

1

282

Mean Difference (IV, Fixed, 95% CI)

‐5.9 [‐8.99, ‐2.81]

1.1 NPI

1

282

Mean Difference (IV, Fixed, 95% CI)

‐5.9 [‐8.99, ‐2.81]

2 Quality of Life Show forest plot

1

44

Mean Difference (IV, Fixed, 95% CI)

5.49 [‐2.17, 13.16]

2.1 Mean Number of Interactions with Staff

1

22

Mean Difference (IV, Fixed, 95% CI)

235.90 [161.93, 309.87]

2.2 Mean Number of Interactions with Family

1

22

Mean Difference (IV, Fixed, 95% CI)

2.99 [‐4.72, 10.70]

3 Psychotrophic Drug Use Show forest plot

1

282

Mean Difference (IV, Fixed, 95% CI)

0.10 [‐0.12, 0.32]

3.1 Mean number of Psychotropic Drugs

1

282

Mean Difference (IV, Fixed, 95% CI)

0.10 [‐0.12, 0.32]

4 Use of Physical Restraint Show forest plot

1

285

Odds Ratio (M‐H, Fixed, 95% CI)

0.49 [0.27, 0.88]

4.1 Use of Physical Restraint

1

285

Odds Ratio (M‐H, Fixed, 95% CI)

0.49 [0.27, 0.88]

5 Other Behaviour ‐ Catastrophic Reactions Show forest plot

Other data

No numeric data

Figuras y tablas -
Comparison 3. Special Care Units versus Traditional Nursing Homes, Outcomes at 12‐month
Comparison 4. Special Care Units versus Traditional Nursing Homes, Outcomes at 18‐month

Outcome or subgroup title

No. of studies

No. of participants

Statistical method

Effect size

1 Behaviour Show forest plot

1

242

Mean Difference (IV, Fixed, 95% CI)

‐5.4 [‐9.15, ‐1.65]

1.1 NPI

1

242

Mean Difference (IV, Fixed, 95% CI)

‐5.4 [‐9.15, ‐1.65]

2 Psychotropic Drug Use Show forest plot

1

268

Mean Difference (IV, Fixed, 95% CI)

0.10 [‐0.12, 0.32]

2.1 Mean number of Psychotropic Drugs

1

268

Mean Difference (IV, Fixed, 95% CI)

0.10 [‐0.12, 0.32]

3 Use of Physical Restraint Show forest plot

1

242

Odds Ratio (M‐H, Fixed, 95% CI)

0.54 [0.29, 1.03]

3.1 Use of Physical Restraint

1

242

Odds Ratio (M‐H, Fixed, 95% CI)

0.54 [0.29, 1.03]

Figuras y tablas -
Comparison 4. Special Care Units versus Traditional Nursing Homes, Outcomes at 18‐month