Раннее введение дополнительного питания и жидкостей здоровым доношенным детям, находящимся на грудном вскармливании
Abstract
Background
Widespread recommendations from health organisations encourage exclusive breastfeeding for six months. However, the addition of other fluids or foods before six months is common in many countries and communities. This practice suggests perceived benefits of early supplementation or lack of awareness of the possible risks.
Objectives
To assess the benefits and harms of supplementation for full‐term healthy breastfed infants and to examine the timing and type of supplementation.
Search methods
We searched the Cochrane Pregnancy and Childbirth Group's Trials Register (21 March 2014) and reference lists of all relevant retrieved papers.
Selection criteria
Randomised or quasi‐randomised controlled trials in infants under six months of age comparing exclusive breastfeeding versus breastfeeding with any additional food or fluids.
Data collection and analysis
Two review authors independently selected the trials, extracted data and assessed risk of bias.
Main results
We included eight trials (984 randomised infants/mothers). Six trials (n = 613 analysed) provided data on outcomes of interest to this review. The variation in outcome measures and time points made it difficult to pool results from trials. Data could only be combined in a meta‐analysis for one secondary outcome (weight change). The trials that provided outcome data compared exclusively breastfed infants with breastfed infants who were allowed additional nutrients in the form of artificial milk, glucose, water or solid foods.
In relation to the majority of the older trials, the description of study methods was inadequate to assess the risk of bias. The two more recent trials, were found to be at low risk of bias for selection and detection bias. The overall quality of the evidence for the main comparison was low.
In one trial (170 infants) comparing exclusively breastfeeding infants with infants who were allowed additional glucose water, there was a significant difference favouring exclusive breastfeeding up to and including week 20 (risk ratio (RR) 1.45, 95% confidence interval (CI) 1.05 to 1.99), with more infants in the exclusive breastfed group still exclusively breastfeeding. Conversely in one small trial (39 infants) comparing exclusive breastfed infants with non‐exclusive breastfed infants who were provided with artificial milk, fewer infants in the exclusive breastfed group were exclusively breastfeeding at one week (RR 0.58, 95% CI 0.37 to 0.92) and at three months (RR 0.44, 95% CI 0.26 to 0.76) and there was no significant difference in the proportion of infants continuing any breastfeeding at three months between groups (RR 0.76, 95% CI 0.56 to 1.03).
For infant morbidity (six trials), one newborn trial (170 infants) found a statistically, but not clinically, significant difference in temperature at 72 hours (mean difference (MD) 0.10 degrees, 95% CI 0.01 to 0.19), and that serum glucose levels were higher in glucose supplemented infants in the first 24 hours, though not at 48 hours (MD ‐0.24 mmol/L, 95% CI ‐0.51 to 0.03). Weight loss was also higher (grams) in infants at six, 12, 24 and 48 hours of life in the exclusively breastfed infants compared to those who received additional glucose water (MD 7.00 g, 95% CI 0.76 to 13.24; MD 11.50 g, 95% CI 1.71 to 21.29; MD 13.40 g, 95% CI 0.43 to 26.37; MD 32.50 g, 95% CI 12.91 to 52.09), but no difference between groups was observed at 72 hours of life. In another trial (47 infants analysed), we found no significant difference in weight loss between the exclusively breastfeeding group and the group allowed either water or glucose water on either day three or day five (MD 1.03%, 95% CI ‐0.18 to 2.24) and (MD 0.20%, 95% CI ‐1.18 to 1.58).
Three trials with four‐ to six‐month‐old infants provided no evidence to support any benefit from the addition of complementary foods at four months versus exclusive breastfeeding to six months nor any risks related either morbidity or weight change (or both).
None of the trials reported on the remaining primary outcomes, infant mortality or physiological jaundice.
Authors' conclusions
We were unable to fully assess the benefits or harms of supplementation or to determine the impact from timing and type of supplementation.
We found no evidence of benefit to newborn infants and possible negative effects on the duration of breastfeeding from the brief use of additional water or glucose water, and the quality of the evidence from a small pilot study on formula supplementation was insufficient to suggest a change in practice away from exclusive breastfeeding. For infants at four to six months, we found no evidence of benefit from additional foods nor any risks related to morbidity or weight change. Future studies should examine the longer‐term effects on infants and mothers, though randomising infants to receive supplements without medical need may be problematic.
We found no evidence for disagreement with the recommendation of international health associations that exclusive breastfeeding should be recommended for healthy infants for the first six months.
PICO
Резюме на простом языке
Раннее введение дополнительного питания и жидкостей здоровым доношенным детям, находящимся на грудном вскармливании
Грудное (человеческое) молоко необходимо для обеспечения роста, защиты и развития детей. Это важно и для здоровья матери. Исключительно грудное вскармливание это потребление ребенком грудного молока без каких‐либо добавок любого типа (включая воду, сок, нечеловеческое молоко или продукты питания). Раннее введение добавок (дополнительного питания) может привести к снижению выработки молока из‐за уменьшенного удаления молока из груди, трудностям в развитии эффективного грудного вскармливания и снижению уверенности в способности кормить грудью. Несмотря на широкое распространение рекомендаций в поддержку исключительно грудного вскармливания в течение первых шести месяцев жизни, практика часто не демонстрирует отражения этих рекомендаций, тем самым предполагая, что существует предполагаемая польза от добавок (дополнительного питания). Мы рассмотрели исследования по добавкам (дополнительному введению) жидкостей в первые недели жизни ребенка или по добавкам (дополнительному введению) пищи младенцам в возрасте 4‐6 месяцев. Мы выявили восемь рандомизированных контролируемых исследований с участием 984 детей и их матерей, которые рассматривали исключительно грудное вскармливание в сравнении с грудным вскармливанием с дополнительным введением жидкостей и продуктов питания.
Из испытаний, которые мы нашли, два испытания с участием 217 детей не обнаружили доказательств пользы для здорового ребенка, находящегося на грудном вскармливании, при дополнительном введении воды или раствора глюкозы в отношении показателей уровня глюкозы, температуры, потери веса у новорожденных. Одно из этих испытаний (проанализировано N = 170) обнаружило повышенный риск раннего прекращения грудного вскармливания при коротком (недолгом) дополнительном введении воды или раствора глюкозы. Одно пилотное исследование, с данными от 39 детей, которые потеряли более 5% массы тела при рождении к 36 часам жизни, представило доказательства, что небольшие количества добавок в первые дни жизни могли бы помочь успешно продолжать грудное вскармливание, хотя исследователи этого испытания утверждают, что существующих доказательств не достаточно для того, чтобы рекомендовать это для регулярной практики. Для детей, получающих добавки продуктов питания в возрасте 4‐6 месяцев, мы не нашли достаточных данных высокого качества в этих трех выявленных испытаниях, чтобы показать пользу для ребенка в предоставлении дополнительного питания, без каких‐либо рисков, связанных с заболеваемостью и/или изменением веса.
Результаты этих испытаний были опубликованы в период между 1982 и 2014 годами. Два испытания были проведены в Гондурасе, два в США и по одному в Испании, Нигерии, Исландии и Великобритании.
Этот обзор не нашел доказательств, чтобы не согласиться с рекомендацией Всемирной организации здравоохранения и других международных медицинских ассоциаций, что в качестве общей политики детям в первые шесть месяцев после рождения следует рекомендовать исключительно грудное вскармливание, без дополнительных продуктов питания или жидкостей.
Authors' conclusions
Background
Human milk for human babies is the biological norm. It has long been recognised as both the unequalled way of providing all the nutritional, immunological and psychological requirements that a healthy, term infant needs to thrive, and important to the health and well‐being of the mother. Reviews of studies in both economically advantaged and disadvantaged settings have shown short‐term and long‐term risks to the child and to the mother from not breastfeeding (Chen 2004; Horta 2013a; Ip 2007; Kramer 2002; Leon‐Cava 2002).
Description of the condition
Exclusive breastfeeding is defined as an infant's consumption of human milk with no supplementation of any type, including no water, juice, non‐human milk or foods, although medicines, vitamins and minerals are allowed (WHO 2008). A review of interventions in 42 developing countries estimated that exclusive breastfeeding for six months and continued breastfeeding for the first year of life could prevent 13% of the over 10 million deaths per annum of children less than five years old. Breastfeeding is identified as the single most important preventative intervention in saving such lives (Black 2013; Jones 2003). Compared to exclusive breastfeeding, the risks from partial or non‐exclusive breastfeeding have been recognised for many years, including a higher rate of infant morbidity and mortality from diarrhoea and respiratory illness (Arifeen 2001; Brown 1989; Chantry 2006; Feachem 1984; Horta 2013b; Kramer 2003; Quigley 2007; Talayero 2006; Victora 1987; Wilson 1998). Non‐exclusive breastfeeding may result in an earlier return of the mother's fertility and a shorter inter‐birth interval (WHO 1999).
International actions work to improve the health of children and their mothers through the promotion of exclusive breastfeeding. The Baby Friendly Hospital Initiative (BFHI) is a global programme started in 1989 to protect and support exclusive breastfeeding through improvement of healthcare practices that affect infant feeding. It has an assessment criterion of 'Give newborn infants no food or drink other than breast milk unless medically indicated' (UNICEF/WHO 2009). In 2002, the World Health Assembly, supported by many national and international health associations, reiterated the importance of exclusive breastfeeding in the Global Strategy for Infant and Young Child Feeding. Their previous recommendation for exclusive breastfeeding for "four to six months" was amended to state that as a global public health recommendation, infants should be exclusively breastfed for the first six months of life and thereafter breastfeeding continued up to two years of age or beyond with the addition of adequate and safe complementary foods (WHO 2003).
From the data in the WHO Global Data Bank on Infant and Young Child Feeding 2009, it is estimated that only 34.8% of infants are exclusively breastfed for the first six months. There are indications that in many countries exclusive breastfeeding, though still low, has increased in the last decade (WHO 2009).
Supplementary feedings are classified as feeds provided in place of breastfeeding. These may include artificial baby milk, glucose water, teas, water, semi‐solid or solid foods. Thus, any foods or fluids given before six months, the recommended duration of exclusive breastfeeding, are therefore defined as supplementary (AAP 2012; ABM 2009).
Studies on supplementation tend to involve either supplementation with additional fluids in the early weeks or supplementation with the addition of foods at four to six months of age. Numerous health services, personal, socioeconomic and cultural factors influence the decision to supplement human milk. These factors include:
-
pre‐lacteal feeds may be given in the belief that colostrum is harmful, or to clean the infant's gut (Davies‐Adetugbo 1997);
-
early supplementation is more likely following caesarean section (Ladomenou 2007), if hospital practices separate mother and infant at birth (Gagnon 2005; Kurinij 1991), or if hospital does not follow practices in accordance with the WHO/UNICEF Baby Friendly Hospital Initiative (AAP 2012; Biro 2011);
-
supplements may be given in the belief they will reduce maternal fatigue, by health workers (Cloherty 2004; Gagnon 2005) and by family members (Cohen 1999);
-
lack of health worker time to assist breastfeeding (Furber 2006; Gagnon 2005);
-
supplementation as the solution to the perception that the baby is unsettled due to low milk supply (Akuse 2002; Blomquist 1994; Gagnon 2005; Graffy 1992; Nicoll 1982) or to make the baby sleep longer;
-
maternal unrealistic expectations of newborn behaviour, difficulty in caring for a newborn, or other maternal concerns, and supplementation is seen as the solution to difficulties (DaMota 2012; Wagner 2013);
-
weight charts that are based on formula‐fed infants may imply that breastfeeding infants are underweight and supplemental feeding is given in the belief it will result in higher weight gain that is thought to be beneficial (Sachs 2006);
-
supplements are given in a belief that they will prevent dehydration, hypoglycaemia and neonatal jaundice (Akuse 2002; Nicoll 1982);
-
early maternal return to employment and lack of facilities in the workplace to breastfeed (Gielen 1991; Ladomenou 2007), and mothers perceive disapproval from society of breastfeeding outside her home (Bai 2009);
-
marketing of formula (Chezem 1998; Yee 2007);
-
translation of research into practice, even with the provision of information and development of professional guidelines (ABM 2011), is sometimes met with barriers and delays (Brodribb 2008; Brodribb 2011).
Additional foods or fluids may be needed for medical reasons in specific situations related to the infant or mother. This review deals with the healthy, term infant and does not address individual needs in medical conditions.
How the intervention might work
Effects of early additional foods or fluids
It is difficult to obtain robust evidence about the effect of early additional foods and fluids (supplementation) on full‐term, healthy, babies due in part to problems in the consistency of breastfeeding definitions (Labbok 2012), poor research design (McNiel 2010; Renfrew 2007) and the belief that supplementation is a routine acceptable practice, not an intervention, and thus does not need to be noted (Martin‐Calama 1997; Mulford 1995). Supplementing or not supplementing may potentially affect the duration of breastfeeding, infant morbidity and mortality, as well as infant weight change, length of postnatal hospital stay, maternal self‐confidence and physiological jaundice.
Effect on duration of breastfeeding
Observational studies and surveys have found associations between supplementation and shorter duration of breastfeeding (Blomquist 1994; Chantry 2014; Giovannini 2005; Hornell 2001; Kurinij 1991). The effect of early supplementation on reducing breastfeeding duration may include decreased milk production due to reduced removal of milk from the breast; difficulties in developing effective breastfeeding skills when the newborn infant is also feeding from an artificial teat which may result in low infant weight gain; or maternal sore nipples and breasts; all of which may result in early cessation of breastfeeding, as well as reduced maternal confidence in the ability to successfully breastfeed and the reinforcement of a negative belief that human milk is insufficient for an infant. Qualitative studies in the UK (Cloherty 2004; Furber 2006) have indicated that, despite their awareness of policies supporting exclusive breastfeeding, some midwives think that providing an occasional formula supplement in hospital may give the mother an opportunity to rest and be more likely to continue to breastfeed, thus an aid to longer duration.
Effect on infant morbidity and mortality
As mentioned earlier, infant mortality and morbidity may be affected by the addition of other fluids or foods to the infant in the first six months. The effect of early supplementation on infant morbidity and mortality may be related to a single factor or a combination of factors, including incorrectly prepared supplement, contamination of the supplement or the device used to give the supplement (Horman 2010; Renfrew 2008; WHO 2007); receiving a reduced amount of the anti‐infective nutrients in human milk (Ballard 2013); the effect of the non‐human milk supplement on the infant's developing immune and digestive systems; or other reasons (Turin 2014). Longer‐term indications of morbidity related to immune reactions may include eczema and other skin conditions, asthma and digestive related conditions (Horta 2013a; Ip 2007). Short‐term indications of possible morbidity include hypo‐ or hyperthermia, hypo‐ or hyperglycaemia, diarrhoea, respiratory symptoms and otitis media (Horta 2013b; Kramer 2003; Victora 1987). An increased or reduced temperature may indicate an infection or other immune reaction. Normal temperature range is considered 36 to 38 degrees Celsius (97 to 100.4 degrees Fahrenheit). The advent of cot‐side testing of blood glucose in the early 1970s led to attempts to define a level of asymptomatic hypoglycaemia that could be classified as a risk level, in the belief that treating at this level would reduce the risk of symptomatic hypoglycaemia occurring (Williams/WHO 1997). These older studies and textbooks were likely to use formula‐fed infants as the norm and consider the values found in healthy breastfeeding infants as low. Transient hypoglycaemia is now understood as a normal adaptive response to the establishment of ex‐utero feeding (ABM 2014), though extended hypoglycaemia may be an indication of illness. There is no agreed definition of hypoglycaemia as the value varies with the infant's maturity, pathology, clinical signs and method of testing. A suggested range of values considered as hypoglycaemia are between 30 and 50 mg/dL (1.7 to 2.8 mmol/L) (Wright 2006); however, older studies may use different values. Feeding healthy infants cow's milk formula in an attempt to raise their blood glucose levels to an unphysiological high level introduces non‐human milk proteins which may result in immunological reactions, possible bacterial contaminants and reduce the appetite of the infant to feed at the breast. Glucose water has additional risks from providing fewer calories than a similar volume of milk, thus filling the infant's stomach while providing insufficient nutrients. This increases the risks of hypoglycaemia and poor weight gain. There is no evidence that high blood glucose levels are of benefit to the infant, and high levels may affect the metabolic response, with later effects on risks of obesity and diabetes. Diarrhoea may indicate an infection or an intolerance to foreign proteins or carbohydrates in non‐milk feeds. As normal stools of a breastfeeding infant are much looser than the stools of a cow's milk formula‐fed infant this makes the definition of diarrhoea open to interpretation. Breastfeeding provides for optimal immune system functioning and thus the level of respiratory infections and otitis media occurrences can indicate if there is an effect on the immune system.
Effect on physiological jaundice
Babies are born with fetal red blood cells which are no longer needed and must be metabolised and excreted. Bilirubin is a product of this breakdown, released in the blood stream and ultimately excreted in the baby's stool. A newborn’s serum bilirubin level normally rises from birth until the third or fourth day postpartum and a significant proportion will have total serum bilirubin concentrations greater than 5.0 mg/dL (86 umol/L) while remaining healthy. This is termed physiological jaundice (ABM 2009). Ineffective feeding and thus reduced calorie intake can increase bilirubin levels (De Carvalho 1981; Yamauchi 1990). The normal initial fluid loss in newborn infants and situations of ineffective feeding leading to dehydration may lead to a belief that fluid supplements will prevent dehydration and jaundice, though the replacement of milk with water will further reduce the infant's calorie intake and has not been shown to reduce bilirubin levels (De Carvalho 1981; Houston 1984; Nicoll 1982). The replacement of breastfeeding with formula has been tested as a treatment to reduce high levels of serum bilirubin (Amato 1985; Osborn 1985), which may have led some health workers to use supplements to prevent high levels of bilirubin occurring (Akuse 2002).
Effect on weight change
Weight loss in the newborn represents mainly fluid loss but may also involve loss of fat stores during the establishment of feeding (Wright 2004). A breastfed baby will commonly lose up to 5% to 7% in the first few days with no adverse effects. There may be a fear that the baby will become dehydrated until breastfeeding is established, and such babies are supplemented with water, glucose or artificial milk. Water, and glucose in particular, have no or little calorific value and may cause a baby to be full but remain deficient in calorific intake. Supplementation in such instances, as well as interfering with breastfeeding, will in fact contribute to further weight loss in the early postpartum period (Glover 1990). Evidence from studies in tropical climates demonstrate that breastfed babies will not become dehydrated if allowed to fully breastfeed on demand (Almroth 1990).
The WHO published comprehensive infant growth charts developed from data on breastfeeding infants (De Onis 2004). This long‐term multi‐centre study indicated that previous charts were likely to have categorised healthy breastfeeding infants as underweight, which may have contributed to the addition of foods and fluids before six months of age. Additional foods and fluids above the nutritional needs of the infant may result in the infant becoming overweight. Early introduction of solid foods to breastfeeding infants is likely to result in less breast milk consumed, which may affect nutritional and immune status (Heinig 1993). For the older infant, the decision to add formula or solid foods may affect the duration of breastfeeding. Hornell suggests that formula given by bottle, because the mother perceived that she did not have sufficient milk, may reduce the duration of breastfeeding more so than solid foods that are added because the mother thought the infant had reached an appropriate age (Hornell 2001).
Maternal self‐confidence in breastfeeding
Antenatal or early postnatal breastfeeding self‐efficacy is associated with more exclusive breastfeeding and longer duration of breastfeeding (Blyth 2004; Noel‐Weiss 2006). Low maternal confidence in the ability to breastfeed may lead to formula supplementation and the feeling of failure (Hoddinott 1999; Wagner 2013).
Why it is important to do this review
Despite many years of widespread recommendations to support exclusive breastfeeding for four and more recently six months, common practice does not appear to reflect these recommendations suggesting there are perceived benefits from supplementation. Given the potential risks from supplementation, this review aims to summarise the existing evidence on the effects of additional food and fluids for breastfeeding full‐term infants.
Objectives
The main objective of the review was to assess the benefits and harms of additional foods and fluids for full‐term healthy breastfed infants. We also aimed to determine what impact the timing of supplementation (during early phase of initiation of breastfeeding versus later on for maintenance) and type of supplementation (water, artificial milk, foods) had on these infants.
Methods
Criteria for considering studies for this review
Types of studies
Randomised or quasi‐randomised controlled trials (RCTs).
Types of participants
Full‐term (that is 37 to 42 completed weeks' gestation (singleton or multiple births)) breastfed infants up to the age of six months (the currently recommended age after which complementary foods should commence), or the mothers of these infants.
Types of interventions
Exclusive breastfeeding (as defined in the trial) versus breastfeeding supplemented (once or more) with any additional food or fluids.
Types of outcome measures
Primary outcomes
-
Duration of breastfeeding
-
Incidence of infant morbidity, for example, gastro‐intestinal infection, ear infection, asthma and eczema (depending on how defined in individual trials)
-
Infant mortality (at discharge, 28 days or one year)
-
Physiological jaundice, absence or presence, and if present, duration (days) (as defined in the Background)
Secondary outcomes
-
Weight change (kg) (as defined by trial authors)
-
Duration of hospital stay (days)
-
Maternal self‐confidence in breastfeeding (however assessed in individual trials)
-
Maximum serum bilirubin levels
-
Phototherapy in hospital or home setting if required, absence or presence, and if present, duration (days)
Search methods for identification of studies
The following methods section of this review is based on a standard template used by the Cochrane Pregnancy and Childbirth Group.
Electronic searches
We searched the Cochrane Pregnancy and Childbirth Group’s Trials Register by contacting the Trials Search Co‐ordinator (21 March 2014).
The Cochrane Pregnancy and Childbirth Group’s Trials Register is maintained by the Trials Search Co‐ordinator and contains trials identified from:
-
monthly searches of the Cochrane Central Register of Controlled Trials (CENTRAL);
-
weekly searches of MEDLINE;
-
weekly searches of Embase;
-
handsearches of 30 journals and the proceedings of major conferences;
-
weekly current awareness alerts for a further 44 journals plus monthly BioMed Central email alerts.
Details of the search strategies for CENTRAL, MEDLINE and Embase, the list of handsearched journals and conference proceedings, and the list of journals reviewed via the current awareness service can be found in the ‘Specialized Register’ section within the editorial information about the Cochrane Pregnancy and Childbirth Group.
Trials identified through the searching activities described above are each assigned to a review topic (or topics). The Trials Search Co‐ordinator searches the register for each review using the topic list rather than keywords.
Searching other resources
We examined reference lists of all relevant retrieved papers to identify further studies.
We did not apply any language or date restrictions.
Data collection and analysis
For methods used in the previous version, please see Becker 2011.
For this update the following methods, which are based on a standard template used by the Cochrane Pregnancy and Childbirth Group, were used.
Selection of studies
Two review authors independently applied the inclusion criteria to all potential trials. We performed this without blinding. No discrepancy occurred in the trial selection, but had there been, we would have resolved this by discussion. We considered studies available as published conference abstracts or posters for inclusion.
Data extraction and management
Both review authors independently extracted the data (using a customised data extraction form) and assessed the risk of bias of the selected trials. We resolved any disagreements through discussion. Both authors entered data into Review Manager software (RevMan 2014).
Assessment of risk of bias in included studies
Both review authors assessed each trial using a simple form and followed the domain‐based evaluation as described in the Cochrane Handbook for Systematic Reviews of Interventions (Higgins 2011).
We also reported on whether the investigators had performed a sample‐size calculation.
We compared assessments and resolved any inconsistencies by discussion.
(1) Random sequence generation (checking for possible selection bias)
We described for each included study the method used to generate the allocation sequence in sufficient detail to allow an assessment of whether it should produce comparable groups.
We assessed the method as:
-
low risk of bias (any truly random process, e.g. random number table; computer random number generator);
-
high risk of bias (any non‐random process, e.g. odd or even date of birth; hospital or clinic record number);
-
unclear risk of bias.
(2) Allocation concealment (checking for possible selection bias)
We described for each included study the method used to conceal allocation to interventions prior to assignment and assessed whether intervention allocation could have been foreseen in advance of, or during recruitment, or changed after assignment.
We assessed the methods as:
-
low risk of bias (e.g. telephone or central randomisation; consecutively numbered sealed opaque envelopes);
-
high risk of bias (open random allocation; unsealed or non‐opaque envelopes, alternation; date of birth);
-
unclear risk of bias.
(3.1) Blinding of participants and personnel (checking for possible performance bias)
Given the nature of the interventions, blinding was not possible for participants and caregivers and so this has not been assessed within this review.
(3.2) Blinding of outcome assessment (checking for possible detection bias)
We described for each included study the methods used, if any, to blind outcome assessors from knowledge of which intervention a participant received. We assessed blinding separately for different outcomes or classes of outcomes.
We assessed methods used to blind outcome assessment as:
-
low, high or unclear risk of bias.
(4) Incomplete outcome data (checking for possible attrition bias due to the amount, nature and handling of incomplete outcome data)
We described for each included study, and for each outcome or class of outcomes, the completeness of data including attrition and exclusions from the analysis. We stated whether attrition and exclusions were reported and the numbers included in the analysis at each stage (compared with the total randomised participants), reasons for attrition or exclusion where reported, and whether missing data were balanced across groups or were related to outcomes. Where sufficient information was reported, or could be supplied by the trial authors, we planned to re‐include missing data in the analyses which we undertook.
We assessed methods as:
-
low risk of bias (e.g. no missing outcome data; missing outcome data balanced across groups);
-
high risk of bias (e.g. numbers or reasons for missing data imbalanced across groups; ‘as treated’ analysis done with substantial departure of intervention received from that assigned at randomisation);
-
unclear risk of bias.
(5) Selective reporting (checking for reporting bias)
We described for each included study how we investigated the possibility of selective outcome reporting bias and what we found.
We assessed the methods as:
-
low risk of bias (where it is clear that all of the study’s pre‐specified outcomes and all expected outcomes of interest to the review have been reported);
-
high risk of bias (where not all the study’s pre‐specified outcomes have been reported; one or more reported primary outcomes were not pre‐specified; outcomes of interest are reported incompletely and so cannot be used; study fails to include results of a key outcome that would have been expected to have been reported);
-
unclear risk of bias.
(6) Other bias (checking for bias due to problems not covered by (1) to (5) above)
We described for each included study any important concerns we had about other possible sources of bias.
(7) Overall risk of bias
We made explicit judgements about whether studies were at high risk of bias, according to the criteria given in the Handbook (Higgins 2011). With reference to (1) to (6) above, we planned to assess the likely magnitude and direction of the bias and whether we considered it is likely to impact on the findings. In future updates, we will explore the impact of the level of bias through undertaking sensitivity analyses ‐ seeSensitivity analysis.
Measures of treatment effect
Dichotomous data
For dichotomous data, we present results as summary risk ratio (RR) with 95% confidence intervals, where appropriate.
Continuous data
For continuous outcomes, we recorded either mean relative change from baseline for each group or mean post‐treatment or post‐intervention values and standard deviation. When standard errors were reported we converted these to standard deviations (as with Nicoll 1982). We calculated a pooled estimate of treatment effect by calculating the mean difference (MD).
Unit of analysis issues
The protocol for this review does not include cross‐over trials or cluster‐randomised trials. For studies that had multi‐intervention arms, we first assessed which groups were relevant to this review and the appropriate method of analysis. If groups were similar, e.g. water and glucose water, then we combined the groups. If we found that more than two comparison groups were applicable, then we entered data as a single pair‐wise comparison into RevMan. In instances in which there were more than two groups to be compared, we took measures to avoid double counting or inappropriate totaling.
Dealing with missing data
We planned to enter the data on the number of participants by allocated treated group, irrespective of compliance and whether or not the participant was later thought to be ineligible or otherwise excluded from treatment or follow‐up in order to allow an intention‐to‐treat analysis. However, this was not always possible, as for example, within some included trials, mothers who ceased to comply during the trial were excluded from the analysis (these trial authors did not provide outcome data on the full allocated group).
Assessment of heterogeneity
When a sufficient number of trials are included in a meta‐analysis, we plan to assess statistical heterogeneity in each meta‐analysis using the Tau², I² and Chi² statistics. We will regard heterogeneity as substantial if an I² is greater than 30% and either a Tau² is greater than zero, or there is a low P value (less than 0.10) in the Chi² test for heterogeneity.
Assessment of reporting biases
In future updates of this review, if there are 10 or more studies in a meta‐analysis we will investigate reporting biases (such as publication bias) using funnel plots. We will assess funnel plot asymmetry visually. If we asymmetry is suggested by a visual assessment, we will perform exploratory analyses to investigate it.
Data synthesis
We carried out statistical analysis using the Review Manager software (RevMan 2014). We used fixed‐effect meta‐analysis for combining data where it was reasonable to assume that studies are estimating the same underlying treatment effect: i.e. where trials are examining the same intervention, and we judged the trials’ populations and methods to be sufficiently similar. In future updates, if there is clinical heterogeneity sufficient to expect that the underlying treatment effects differ between trials, or if we detect substantial statistical heterogeneity, we will use random‐effects meta‐analysis to produce an overall summary if an average treatment effect across trials is considered clinically meaningful. We will treat the random‐effects summary as the average range of possible treatment effects and we will discuss the clinical implications of treatment effects differing between trials. If the average treatment effect is not clinically meaningful, we will not combine trials.
Where multiple timepoints have been reported within the included trial reports we have clearly reported when measurements were taken by the primary investigators during the trial, what measurements were reported within the published paper and what data we are reporting in the review.
Subgroup analysis and investigation of heterogeneity
When more data are included in the review, if we identify substantial heterogeneity, we will investigate it using subgroup analyses and sensitivity analyses.
In future updates of this review we plan to carry out the following subgroup analysis:
-
timing of supplementation: given at early phase of initiation of breastfeeding (neonatal period ‐ up to and including the first four weeks of life) compared with later on, for maintenance (after neonatal period) ‐ (relating to primary outcomes (1), (2) and (3);
-
type of supplementation: water/ formula/glucose/food compared with each other ‐ (relating to primary outcomes (1), (2) and (3);
-
geographical location: trials conducted in disadvantaged populations versus trials in advantaged populations ‐ (relating to primary outcomes (2) and (3)).
We will assess subgroup differences by interaction tests available within RevMan (RevMan 2014). We will report the results of subgroup analyses quoting the Chi² statistic and P value, and the interaction test I² value.
Sensitivity analysis
When sufficient trials are included in the review, for primary outcomes only, we plan to perform a sensitivity analysis based on the risk of bias of the trials, including and excluding quasi‐randomised trials.
Results
Description of studies
Results of the search
For the original version of this review, the Pregnancy and Childbirth Group Register search identified 22 potentially relevant trials, with one additional trial found with secondary searching by one of the review authors (GB) (Schutzman 1986). After assessment, we identified six trials which we considered fulfilled the inclusion criteria for that review (Cohen 1994; Dewey 1999; Martin‐Calama 1997; Nicoll 1982; Ojofeitimi 1982; Schutzman 1986). In this update, a similar search to March 2014, identified 11 potentially relevant trials, with two further publications plus a PhD thesis related to one of the trials identified through secondary searching, with one additional ongoing trial found by one of the review authors (GB). After assessment, of the 11 trials identified, we considered that two fulfilled the inclusion criteria for this review (Flaherman 2013; Jonsdottir 2012). Two trials have been listed as ongoing trials (ISRCTN14254740; NCT01330667).
Included studies
This review now includes eight trials, in which a total of 984 breastfeeding infants or their mothers were randomised. (seeCharacteristics of included studies table).
Three of the trials have multiple references; the Cohen trial has been reported in five individual papers, the Dewey trial in four, and the Jonsdottir in five plus a PhD thesis (Cohen 1994; Dewey 1999; Jonsdottir 2012). For each of the remaining five trials there is one paper published on each (Flaherman 2013; Martin‐Calama 1997; Nicoll 1982; Ojofeitimi 1982; Schutzman 1986).
Setting
Two trials were carried out in San Pedro Sula, Honduras (Cohen 1994; Dewey 1999) (these were associated trials); one in Teruel, Spain (Martin‐Calama 1997); one in Ile‐Ife, Nigeria (Ojofeitimi 1982); one in Philadelphia, USA (Schutzman 1986); one in London, UK (Nicoll 1982); one in San Francisco, USA (Flaherman 2013) and one across seven centres in Iceland (Jonsdottir 2012).
Interventions
Five trials were carried out in the first few days after birth and compared exclusive breastfeeding to supplementation with water and/or glucose water in four trials and supplementation with formula in one trial (Flaherman 2013; Martin‐Calama 1997; Nicoll 1982; Ojofeitimi 1982; Schutzman 1986). One two‐arm trial compared a 'glucose water' group (who received 5% glucose ad libitum from a bottle for the first three days of life in addition to breastfeeding), to a 'non‐glucose water' group (who did not receive any alternative solution to human milk) (Martin‐Calama 1997). In a further two‐arm trial, one group received glucose water feedings and the other colostrum (Ojofeitimi 1982). Another two‐arm trial compared exclusive on‐demand breastfeeding versus on‐demand breastfeeding plus supplemental water where the choice of sterile water or 5% glucose water was left to the mother (Schutzman 1986). A three‐arm trial compared a water supplement group to a non‐supplement group to a glucose supplement group (Nicoll 1982). One two‐armed trial compared exclusive breastfeeding versus breastfeeding plus a specific amount of formula supplementation at specific intervals (Flaherman 2013).
Three trials compared continued exclusive breastfeeding to six months versus complementary feeding (solid foods) plus breastfeeding from four to six months (Cohen 1994; Dewey 1999; Jonsdottir 2012). One three‐arm trial included an exclusive breastfeeding (EBF) group versus a solid foods (SF) group, with the introduction of solid foods at 16 weeks, with ad libitum breastfeeding; or solid foods and maintenance (SF‐M), with the introduction of solid foods at 16 weeks with maintenance of pre‐intervention breastfeeding frequency (Cohen 1994). Two two‐armed trials compared a group of continued exclusive breastfeeding to six months versus complementary feeding (solid foods) plus breastfeeding from four to six months (Dewey 1999; Jonsdottir 2012). In the Dewey trial it was stated that mothers were encouraged to maintain baseline (16‐week) breastfeeding frequency (Dewey 1999).
Outcomes
Outcomes (unless otherwise indicated) were to be measured at discharge, three months and six months. However, only three trials reported data within these time periods (four to six months), which we have presented (Cohen 1994; Dewey 1999; Jonsdottir 2012). We stated in the protocol that if outcome data were recorded at other time periods, we would consider examining these as well. Therefore, we have presented data for these other shorter time periods that were reported in full within the review.
Both of the included three‐arm trials reported data for secondary outcomes 'weight change'; Nicoll also reported on 'maximum serum bilirubin levels' (Cohen 1994; Nicoll 1982). For each trial, we decided to combine the data for both of the supplemented interventions (water and glucose groups for the Nicoll trial; solid foods and solid foods with maintenance for the Cohen trial) into single intervention groups (supplemented group) to enable us to present these data within the RevMan analyses. In order to convert the sample sizes, means and standard deviations, we used the formulae as presented in the Handbook (Higgins 2011).
For the Martin‐Calama trial and the outcome 'Duration of breastfeeding' we estimated from the graph the percentage of mothers breastfeeding at each time period (seeTable 1) and calculated the number of women breastfeeding at each time period from these estimates, which enabled us to enter data on this outcome into the RevMan analysis.
| % of mothers who continued either exclusive or partial breastfeeding | Exclusive breastfeeding on day 1‐3 group (non‐glucose water) (n = 87) | Glucose water on day 1‐3 (n = 83) |
| At 4 weeks | 93% | 77% |
| At 8 weeks | 81% | 64% |
| At 12 weeks | 75% | 51% |
| At 16 weeks | 67% | 43% |
| At 20 weeks | 57% | 40% |
These figures were estimated from a graph (Figure 2) on page 212 of the Martin‐Calama 1997 paper.
The six included trials which provided data for analysis (n = 613) reported on one (Flaherman 2013) or two of the four primary outcomes (Cohen 1994; Dewey 1999; Martin‐Calama 1997) and/or one (Flaherman 2013; Jonsdottir 2012) or two of the five secondary outcomes (Cohen 1994; Dewey 1999; Martin‐Calama 1997; Nicoll 1982).
Two of the included trials did not report any data that were eligible for inclusion in the review (Ojofeitimi 1982; Schutzman 1986). In the Ojofeitimi trial, bacterial counts in fluids (colostrum and glucose water) and stools were reported, but no actual data on morbidity were reported (Ojofeitimi 1982). The outcome in the Schutzman trial was "arrival of true milk" (Schutzman 1986). As it is over 20 years since these two studies were published, we concluded that it was not feasible to seek further data from the trial authors (Ojofeitimi 1982; Schutzman 1986).
Excluded studies
We excluded 23 trials from the review (see the Characteristics of excluded studies table). We excluded 15 because, on closer inspection, we identified that there was no exclusively breastfed group (Bannert 1995; Corchia 1985; Cronenwett 1992; French 2012; Gray‐Donald 1985; Kearney 1990; Ly 2006; Rosegger 1985; Rosegger 1986; Sachdev 1991; Schiess 2010; Schmitz 1992; Schubiger 1997; Simondon 1996; Ziegler 2011). We excluded four trials that included only preterm infants (Collins 2004; Howard 2003; Marinelli 2001; Mosley 2001) and two trials that compared regimes of iron containing foods used (Krebs 2013; Olaya 2013). We assessed one trial, which on closer inspection, we considered as not being randomised or quasi‐randomised (De Carvalho 1981). One trial related to effects of counselling in preventing the introduction of other foods or fluids before six months (de Oliveira 2012).
Risk of bias in included studies
We assessed each trial for quality as outlined in the Methods section. We have presented summary descriptions of the assessments on the risk of bias in Figure 1 and Figure 2, and provided details of the assessment for each trial in Characteristics of included studies.

Methodological quality graph: review authors' judgements about each methodological quality item presented as percentages across all included studies.

'Risk of bias' summary: review authors' judgements about each risk of bias item for each included study.
Allocation
We assessed sequence generation and concealment of allocation as low risk in two trials (Flaherman 2013; Jonsdottir 2012); high risk in two trials (Cohen 1994; Dewey 1999); and of unclear risk in four trials (Martin‐Calama 1997; Nicoll 1982; Ojofeitimi 1982; Schutzman 1986).
Blinding
Given the nature of the interventions, blinding was not possible for participants and caregivers. There was no information provided by six of the included trials with regards to whether outcome assessors were blinded or not (Cohen 1994; Dewey 1999; Martin‐Calama 1997; Nicoll 1982; Ojofeitimi 1982; Schutzman 1986). Therefore, we assessed these six trials as having an unclear risk of bias for this domain. For the Jonsdottir trial, while nurses who collected data on complementary food intakes and anthropometric outcomes were not blinded to participant group status, those who undertook all mass spectrometric analyses and isotopic modelling were blinded, therefore we considered this study as having a low risk of bias (Jonsdottir 2012). A blinded research assistant assessed outcome data for the Flaherman trial which we assessed as having a low risk (Flaherman 2013).
Incomplete outcome data
Two trials reported similar dropout rates between treatment groups and clearly documented reasons for any incomplete outcome data and therefore, we assessed these as having a low risk of bias for this domain (Jonsdottir 2012; Martin‐Calama 1997).
We assessed five trials as having an unclear risk of bias (Cohen 1994; Dewey 1999; Flaherman 2013; Nicoll 1982; Schutzman 1986). The published data from the Cohen and Dewey trials report analyses based on compliance with allocation, not intention‐to‐treat (Cohen 1994; Dewey 1999). For the Cohen trial, the dropout rate differed significantly between treatment groups, for the randomised controlled part of the Dewey trial, dropout rates between treatment groups were not balanced and there were significant differences in some patient characteristics, for this domain, we therefore assessed these two trials as having an unclear risk of bias. A further trial reported that a high percentage of baby pairs defaulted and were replaced by further randomised pairs in one of the three arms of the trial, we therefore also assessed this as having an unclear risk of bias (Nicoll 1982). No reference to dropouts was reported in Schutzman 1986, while in Flaherman 2013, information on missing data was not clearly reported.
In the Ojofeitimi trial, participation was voluntary, and those mothers who failed to adhere were excluded from the trial (42%); we therefore assessed this trial as having a high risk of bias for this domain (Ojofeitimi 1982).
Selective reporting
Six studies reported data on all the outcomes mentioned in the 'Methods' section of their articles (Cohen 1994; Dewey 1999; Martin‐Calama 1997;Nicoll 1982; Ojofeitimi 1982; Schutzman 1986), though not at all the time periods were mentioned. We did not retrieve any of the protocols or raw data of these trials and thus did not identify whether outcomes other than those reported within the papers were collected but not reported on. We have therefore assessed this domain as having an unclear risk of bias for these trials.
The Flaherman and Jonsdottir trials were registered trials with protocols available (Flaherman 2013; Jonsdottir 2012). The protocol for the Flaherman trial referred to outcomes of weight nadir and maternal satisfaction, which are not referred to in the published trial report, and the introduction to the report refers to effect on infant weight, however only loss is reported, not any weight gain. The protocol for the Jonsdottir trial referred to secondary outcomes of upper respiratory infections and diarrhoeal episodes, although in one of the published references to this study (Wells 2012) it states "Finally, our study was designed to evaluate growth and energy intake and not other issues such as development of dietary preferences, mineral status, or effects on health such as diarrhoea and allergy". We therefore assessed these two trials as having a high risk of bias for this domain.
Other potential sources of bias
In one trial, telephone follow‐up at five months was used to collect data on the exclusiveness and duration of breastfeeding during the previous 20 weeks, which could be a possible source of recall bias (Martin‐Calama 1997).
Lack of consensus to what is considered a risk level of low serum glucose in the first few days after birth (Martin‐Calama 1997), and what differentiates between normal stools of a breastfeeding infant, loose stools and diarrhoea in the absence of indications of infection (Cohen 1994; Dewey 1999), as well as trialists' decisions to consider the exclusively breastfeeding infant as the intervention rather than supplementation as the intervention, could result in trialists reporting findings as a morbidity when other researchers might consider the same findings as normal.
One trial described as a pilot feasibility trial (Flaherman 2013), had inclusion criteria of weight loss of ≥ 5% in the first few days after birth, though this is well within the range of normality. This may have influenced those involved to consider there was a problem with exclusive breastfeeding when there was not and result in overuse of formula supplementation as there was no direction given as to how often to give the supplement beyond "after each breastfeed". At the start of the intervention, of those replying (15% did not reply), 47% of the formula supplementation group and 32% of the exclusive breastfeeding group had previously planned to use infant formula in addition to breastfeeding, which may have affected their motivation to comply with the allocation. Compliance with allocation is not reported. Other variables known to effect exclusive breastfeeding and weight change, such as birth practices, information and supports, and skilled assistance, were not included. Though the effect on weight is an outcome of the trial, the trial did not include a weighing protocol and relied on weights routinely collected, which varied as to what time points these were collected (additional information from trialist). We have therefore assessed this as having a high risk of bias for this domain.
Effects of interventions
We included eight trials (984 randomised infants or their mothers). The variation in use of outcome measures and timepoints in different trials, made it difficult to pool results from trials. Six trials (n = 613) provided data on outcomes of interest to this review. Data could only be combined in a meta‐analysis for one secondary outcome (weight change) for two studies (Cohen 1994; Dewey 1999). The trials that provided outcome data compared exclusively breastfed infants with breastfed infants who were allowed additional nutrients in the form of artificial milk (Flaherman 2013), glucose water/water (Martin‐Calama 1997; Nicoll 1982) or solid foods (Cohen 1994; Dewey 1999; Jonsdottir 2012).
Exclusive breastfeeding versus breastfeeding with additional foods or fluids (artificial milk, glucose water/water or solid foods)
Primary outcomes
1. Duration of breastfeeding
This outcome was reported in two trials (209 pairs analysed) (Flaherman 2013; Martin‐Calama 1997). Martin‐Calama (n = 170) compared exclusively breastfed infants with breastfed infants who were allowed additional glucose water. Breastfeeding duration was evaluated at four, eight, 12, 16 and 20 weeks (and presented within a graph as % of mothers). We have estimated from the graph the percentage of mothers breastfeeding at each time period (see Table 1) and calculated the number of women breastfeeding at each time period from these estimates. The likelihood of breastfeeding was significantly greater in the exclusive breastfeeding group as compared to the glucose water group across all five time periods: at four weeks risk ratio (RR) 1.21 (95% confidence interval (CI) 1.06 to 1.38); at eight weeks RR 1.26 (95% CI 1.04 to 1.53); at 12 weeks RR 1.48 (95% CI 1.16 to 1.89); at 16 weeks RR 1.54 (95% CI 1.15 to 2.05); at 20 weeks RR 1.45 (95% CI 1.05 to 1.99) (Analysis 2.1). We do note that the trial authors report that across four to 16 weeks, more infants in the exclusive breastfeeding at day one to three group were still breastfed than in the glucose water group, but that this difference disappeared at the end of 20 weeks (which is not the case in our analysis).
The Flaherman trial (37 to 39 pairs analysed, depending on the outcome), using an intention‐to‐treat protocol, compared exclusively breastfed infants with non‐exclusively breastfed infants who were provided with artificial milk and reported fewer infants were exclusively breastfeeding at one week in the exclusively breastfeeding group (RR 0.58, 95% CI 0.37 to 0.92, P = 0.02), and at three months (RR 0.44, 95% CI 0.26 to 0.76, P = 0.003) but there was no significant difference in the proportion of infants continuing any breastfeeding at three months between groups (RR 0.76, 95% CI 0.56 to 1.03, P = 0.08) (Flaherman 2013) (Analysis 1.1). We note that the definition used for exclusive breastfeeding relates to feeding in the previous 24 hours only. Trialists reported that during the first week after birth, newborn infants assigned to supplementation intervention received 116 + 110 mL formula, and controls (exclusive breastfeeding) received 262 + 411 mL; intervention period began at 24 to 48 hours until 72 to 106 hours of age.
Jonsdottir 2012 (100 pairs analysed) retrospectively collected information on total duration of breastfeeding for all infants. However, we are unable to present these data as they were combined with data from an additional cohort of infants from a separate national prospective study.
2. Incidence of infant morbidity
This outcome includes infant morbidities as described by the trial authors in the included trials: hypo‐ or hyperthermia, upper respiratory illness, diarrhoea, hypo‐ or hyperglycaemia and iron deficiency anaemia. There are other possible morbidities that were not included in these trials that we will include if they occur in future updates. Infant morbidity was reported in five trials (Cohen 1994; Dewey 1999; Flaherman 2013; Jonsdottir 2012; Martin‐Calama 1997) (568 pairs analysed). In a further trial (105 pairs analysed), bacterial counts in fluids (colostrum and glucose water) and stools were reported, but there were no actual data on morbidity (Ojofeitimi 1982).
Jonsdottir measured iron deficiency anaemia (the criteria for iron‐deficiency anaemia (IDA) required that all three indicators met the following cut‐off points: haemoglobin (Hb) ,105 g/L, mean cell volume (MCV) ,74 fl, and solid food (SF) ,12 mg/L) (Jonsdottir 2012). Two infants had IDA (one in the exclusive breastfeeding group, one in the complementary foods group; P = 1.00). No significant differences were seen between groups in iron deficiency with or without anaemia.
Hypothermia or hyperthermia
The infants' mean maximum temperature and mean minimum temperatures were reported at 72 hours of age by Martin‐Calama 1997 (170 pairs analysed). The mean maximum and minimum temperature were statistically significantly higher in the exclusive breastfeeding group than in the glucose water group; maximum mean difference (MD) 0.10 degree (95% CI 0.01 to 0.19) and minimum MD 0.10 degree (95% CI 0.02 to 0.18), respectively (Analysis 2.2; Analysis 2.3). The trial author states that three infants (1%, all in the exclusively breastfed group) had a temperature exceeding 38 degrees C, (the level generally accepted as fever).
There was no significant difference in the reported incidence of febrile illness from nought to three months between the exclusive and the first few days supplemented groups in the trial by Flaherman (n = 38, RR 1.50, 95% CI 0.28 to 7.99, P = 0.63) (Flaherman 2013) (Analysis 1.2).
The prevalence (percentage of days) of fever in infants aged from 16 to 26 weeks was reported by Dewey (119 pairs analysed) (Dewey 1999). There was no significant difference between groups in the percentage of days with fever (MD 0.70 day, 95% CI ‐2.00 to 3.40) (Analysis 3.1).
Upper respiratory illness
In one trial, Cohen (141 pairs analysed) reported narratively (no data provided) that upper respiratory illness was relatively uncommon; the prevalence was approximately 4% of days between 16 and 26 weeks. The trial authors reported that the additional food group had a lower prevalence of respiratory illness than the exclusively breastfed group (P = 0.05), which reflected a difference in coughs (P < 0.01). When fever accompanied a respiratory illness (less than 1% of days), there was no difference in prevalence among groups (Cohen 1994).
Cough
The prevalence (percentage of days) of cough in infants was reported by Dewey (119 pairs analysed) from 16 to 26 weeks (Dewey 1999). There was no significant difference between groups in the percentage of days with cough (MD ‐3.10, 95% CI ‐10.72 to 4.52) (Analysis 3.2).
Congestion
The prevalence (percentage of days) of congestion in infants was reported by Dewey from 16 to 26 weeks (Dewey 1999). There was no significant difference between groups in the percentage of days with congestion (MD ‐3.60, 95% CI ‐10.61 to 3.41) (Analysis 3.3).
Nasal discharge
The prevalence (percentage of days) of nasal discharge in infants was reported by Dewey from 16 to 26 weeks (Dewey 1999). There was no significant difference between groups in the percentage of days with nasal discharge (MD ‐4.20, 95% CI ‐9.53 to 1.13) (Analysis 3.4).
Hoarseness
The prevalence (percentage of days) of hoarseness in infants was reported by Dewey from 16 to 26 weeks (Dewey 1999). There was no significant difference between groups in the percentage of days with hoarseness (MD ‐0.10, 95% CI ‐2.04 to 1.84) (Analysis 3.5).
Diarrhoea
The prevalence (percentage of days) of diarrhoea in infants was reported by Dewey (119 pairs analysed) from 16 to 26 weeks (Dewey 1999). The trial authors used a nonparametric test for non‐normally distributed data when analysing this outcome, therefore we have not entered it into the RevMan analysis. They report that the greater prevalence of diarrhoea (defined by the researchers as more than three liquid stools per day) was statistically significantly more common in the exclusive breastfeeding group (percentage of days, mean (SD)), 5.4% +/‐ 8.5% versus 2.8% +/‐ 5.4% in the solid food group (P < 0.05). The difference was marginally statistically significant (2.9% +/‐ 5.0% in the exclusive breastfeeding group compared with 1.4% +/‐ 3.0% in the solid food group, P = 0.07) when diarrhoea was defined as more than five liquid stools per day. They state that the difference in proportion of days with diarrhoea was due to a difference in the number of episodes (no data provided), not to the duration of episodes (Dewey 1999).
Cohen (141 pairs analysed) did not report any morbidity data but narratively reported that diarrhoea was relatively uncommon, with a prevalence of approximately 4% of days between 16 and 26 weeks and that morbidity from diarrhoeal disease was similar among groups (Cohen 1994).
Hypoglycaemia or hyperglycaemia
In one trial (170 analysed), the mean serum (capillary) glucose level was calculated at six, 12, 24 and 48 hours (Martin‐Calama 1997). There were statistically significantly higher values found in the glucose water group than in the exclusive breastfeeding group at six, 12 and 24 hours (MD ‐0.29 mmol/L, 95% CI ‐0.56 to ‐0.02); (MD ‐0.47, 95% CI ‐0.70 to ‐0.24); (MD ‐0.34, 95% CI ‐0.60 to ‐0.08), respectively (Analysis 2.5). However, at 48 hours there was no longer a significant difference (MD ‐0.24, 95% CI ‐0.51 to 0.03).
Martin‐Calama reported the number of episodes of hypoglycaemia (serum glucose less than 2.2 mmol/L) recorded at six, 12, 24 and 48 hours (Martin‐Calama 1997). There were no statistically significant differences in the number of episodes between groups at either six, 12, 24 or 48 hours, (RR 2.39, 95% CI 0.48 to 11.96); (RR 14.32, 95% CI 0.83 to 246.80); (RR 0.64, 95% CI 0.11 to 3.71); (RR 2.86, 95% CI 0.30 to 26.97), respectively (Analysis 2.4). The trial authors state there was no case of serum glucose levels under 1.7 mmol/L in either of the two groups and no cases presented hypoglycaemic symptoms.
3. Infant mortality (at discharge, 28 days or one year)
None of the included studies reported on this outcome.
4. Physiological jaundice, absence or presence, and if present, duration (days) (as defined in the Background)
None of the included studies reported on this outcome.
Secondary outcomes
1. Weight change (kg) (as defined by trial authors)
Weight loss (g) was reported by Martin‐Calama (170 pairs analysed). At six, 12, 24 and 48 hours there was a statistically significantly greater weight loss in the exclusive breastfeeding group as compared to the glucose water group, (six hours) MD 7.00 g (95% CI 0.76 to 13.24); (12 hours) MD 11.50 g (95% CI 1.71 to 21.29); (24 hours) MD 13.40 g (95% CI 0.43 to 26.37); (48 hours) MD 32.50 g (95% CI 12.91 to 52.09), respectively (Martin‐Calama 1997). However, at 72 hours, there was no statistically significant difference between the groups in infant weight loss (MD ‐3.00 g, 95% CI ‐26.83 to 20.83) (Analysis 2.6).
The percentage weight loss was reported by Nicoll (44 pairs analysed) on day three and five for each of the three groups (Nicoll 1982). The authors state that the percentage weight loss on day three was statistically significantly lower in the additional glucose water group compared to the exclusive breastfeeding group and the water supplemented group (presumed by trial authors to be due to marginally greater hydration), the authors also state that this difference was not apparent by day five. When we analysed the data from the glucose water and the water groups as one intervention arm, and compared this to the exclusive breastfeeding group, we found no significant difference in weight loss between exclusive breastfeeding group and the combined supplemented group on either day three or day five (MD 1.03%, 95% CI ‐0.18 to 2.24) and (MD 0.20%, 95% CI ‐1.18 to 1.58), respectively (Nicoll 1982) (Analysis 2.7).
Infant weight gain (g) from 16 to 26 weeks was reported by both Cohen (we combined data for the supplemented groups into one single group) and Dewey (260 pairs analysed) (Cohen 1994; Dewey 1999). We found no significant difference between groups (MD 39.48 g, 95% CI ‐49.48 to 128.43) (Analysis 3.6).
Infant weight gain from four to six months was also reported by Jonsdottir (100 pairs analysed) as z scores. There was no significant difference between the complementary foods group at four months and the exclusive breastfeeding to six months group, MD 0.01 (95% CI ‐0.13 to 0.15) (Jonsdottir 2012) (Analysis 3.7). Furthermore, the trial authors reported that the introduction of complementary foods at four months did not affect the prevalence of overweight children at 18 months (P = 0.74) or 29 to 38 months of age (P = 0.36).
2. Duration of hospital stay (days)
None of the included studies reported on this outcome.
3. Maternal self‐confidence in breastfeeding (however assessed in individual trials)
One of the included studies (39 analysed pairs) reported on this outcome with a modified breastfeeding self‐efficacy score showing no significant difference a few days after the intervention of supplementation with formula in the first week after birth (, MD 0.10, 95% CI ‐0.34 to 0.54, P = 0.66) (Flaherman 2013) (Analysis 1.3).
As part of the larger study of mothers of low birthweight infants in Honduras (Dewey 1999), the mothers' reactions to attempting to breastfeed exclusively for four or six months and the obstacles they encountered were explored using interviews, focus groups and views of the field workers (Cohen 1999). The study authors narratively reported that at two weeks 87% of the mothers said that they were confident in their ability/desire to breastfeed exclusively, rising to 96% to 97% at eight to 12 weeks, with those who did not maintain exclusive breastfeeding being less confident. Confidence is not reported by the groups of exclusive breastfeeding to six months and additional foods from four months.
There may be a lack of confidence in exclusive breastfeeding for six months and later outcomes. A higher number of parents in the exclusive breastfeeding group expressed concerns about their child's development or behavioural status at 18 months (44% exclusive breastfeeding group versus 17% complementary foods group), though the difference was not significant when adjusted for baseline differences (P = 0.08), and at 30 to 35 months, 19% exclusive breastfeeding group versus 2% complementary foods group), which remained significant after adjustment (P = 0.03), however no significant intergroup differences in the children's developmental measures were found (Jonsdottir 2012).
4. Maximum serum bilirubin levels
Plasma bilirubin on day six (µmol/L) was reported in one trial (44 analysed pairs) (Nicoll 1982). For this three‐arm trial, we have presented data for the supplemented groups combined. There was no significant difference for mean plasma bilirubin levels between the exclusively breastfed group compared to the additional water and the glucose water groups combined (MD ‐18.84, 95% CI ‐39.03 to 1.35) (Analysis 2.8).
5. Phototherapy in hospital or home setting if required, absence or presence, and if present, duration (days)
None of the included studies reported on this outcome.
Discussion
Summary of main results
We included eight trials with a total of 984 randomised women/infants in the review; five trials related to the first few days after birth and three trials focused on four‐to six‐month‐old infants. Two trials were carried out in Honduras, two in the USA and one in each of Spain, Nigeria, Iceland and the UK.
The two trials (217 analysed women‐infants) (Martin‐Calama 1997; Nicoll 1982) that related to the first few days after birth did not provide evidence that the practice of giving additional fluids, as water or glucose water, was of benefit to the newborn infant, and one trial showed possible risk in that the additional fluids may contribute to a reduction in the duration of breastfeeding (P < 0.01) (Martin‐Calama 1997). In contrast, one trial (39 infants analysed) in the first few days after birth indicated that the infants assigned to supplementation by pre‐filled feeding syringe with 10 mL of hydrolysed formula after every feed at the breast were likely to show higher rates of breastfeeding at one week and at three months than for those infants assigned to exclusive breastfeeding (control) in the first one to four days after birth (Flaherman 2013). The trial authors point out the limitations in this pilot study of the small sample size, the overall high breastfeeding duration among the population from which the sample was drawn, the willingness of the women to be assigned to exclusive breastfeeding or to supplemented breastfeeding, and the lack of assessment of later health outcomes or duration of breastfeeding past three months, concluding that further research is needed to answer questions on the effects of this intervention on outcomes.
Comparing the exclusively breastfed and the glucose water supplemented groups, there was a statistically significant difference in temperature at 72 hours. However, this difference of 0.1 degree is likely not to be at a clinically significant level; as might be expected, serum glucose levels were higher in the infants who received glucose supplements in the first 24 hours, though there was no significant difference at 48 hours; there was no evidence of significant difference in the number of episodes of hypoglycaemia in the first 48 hours between groups (Martin‐Calama 1997). Newborn weight change showed, by day three, no significant differences between groups (Martin‐Calama 1997; Nicoll 1982); and maximum serum bilirubin levels on day six showed no significant difference between groups (Nicoll 1982). Martin‐Calama 1997 also points out the lack of consensus to what is considered a risk level of low serum glucose in the first few days, and that hypoglycaemic symptoms were not present even in those cases with lower serum levels. In interpreting the results, there may be the assumption that higher glucose levels are better and thus the exclusively breastfed infant is possibly at risk; similarly that higher weight gain is beneficial. However, it could be interpreted that non‐exclusively breastfed infants with higher glucose levels and weight gains are the infants at possible risk, particularly in relation to longer‐term health outcomes related to obesity and diabetes.
Two related trials (n = 260 analysed pairs) reporting on infants 16 to 26 weeks reported that infant weight gain (g) from 16 to 26 weeks was not significantly different between the exclusively breastfed and the additional foods groups (Cohen 1994; Dewey 1999). In addition to this, a further trial (100 analysed pairs) reporting on infant weight gain (z score) from four to six months also found no significant difference between the exclusive breastfeeding to six months and the complementary foods from four months (Jonsdottir 2012). Thus, there does not appear to be evidence to support the practice of giving supplemental foods at 16 to 26 weeks to improve weight gain, nor to reduce the risk of being overweight. One trial (n = 100 analysed pairs) of exclusive breastfeeding versus complementary foods from four months showed no significant difference between groups for iron deficiency, with or without anaemia (Jonsdottir 2012).
The results from one trial involving healthy low birthweight infants (n = 119) from 16 to 26 weeks showed that there was no statistically significant difference in morbidity from upper respiratory symptoms of cough, congestion, nasal discharge or hoarseness or fever between the exclusive breastfeeding group and the group receiving additional foods (Dewey 1999). A similar trial involving healthy term infants with a birthweight at least 2000 g (n = 152) reported narratively that upper respiratory illness was relatively uncommon, though the additional food group had lower prevalence of coughs (P < 0.01) (Cohen 1994). The study authors discuss how differences in definitions may effect their conclusions; for example, cough may result from irritation due to the high levels of smoke from fires in the home and not necessarily an infection. In a later article reporting on another aspect of the same study of healthy term infants (Cohen 1995a), the authors state there was no significant difference between the groups for upper respiratory illness, which may indicate the early finding of difference for coughs was not considered sufficiently robust to include in later publications. The percentage of days that infants 16 to 26 weeks had diarrhoea (reported by mother and defined as more than three liquid stools/day) was higher in the exclusive breastfeeding than the additional foods groups (P > 0.05) in one trial Dewey 1999), though not in the other trial (Cohen 1994). The study authors highlight that the infants in the additional feeds groups received commercially prepared jars of food and that the more normal situation of using home‐prepared foods from the local culture, with a potentially higher bacterial load, might have a higher prevalence of diarrhoea. The study authors also discuss how differences in definitions of diarrhoea may affect their conclusions (Cohen 1994; Dewey 1999). Breastfeeding infants normally have stools that are more frequent and softer than infants who are fed on cow's milk feeds. The definition of what is considered abnormal can affect the interpretation of the findings. Relying on maternal diagnosis of infant illness and maternal recall of any illness over the previous three weeks may result in recall bias.
There was no difference in maternal perception of their breastfeeding self‐efficacy between the exclusive breastfeeding and the supplemented groups when assessed at one week, which does not appear to support the trial investigators' view that a (exclusively breastfed) newborn who "appears fussy and hungry may exacerbate maternal milk supply concern" and thus the intervention of scheduled supplementation would reduce maternal concerns (Flaherman 2013). In Jonsdottir 2012, parents in the group exclusively breastfeeding for six months had significantly more concerns about their child's development or behavioural status at 18 months and at 30 to 35 months, despite developmental tests showing no differences between groups. Reasons for the parental concern are not discussed and mention is made by the trial investigator of low iron levels contributing to developmental delay, though neither iron deficiency anaemia or developmental delay was found among the children, which raises a question if parents are receiving information from health workers or commercial marketing that imply exclusively breastfeeding for six months could result in lack of iron and later developmental concerns.
We found no trials that reported on infant mortality, duration of physiological jaundice, duration of hospital stay or duration of phototherapy.
Quality of the evidence
We have included eight trials, with a total of 984 analysed women and infants pairs in this review. Some information is from studies at unclear risk of bias, and this may be sufficient to affect the interpretation of the results. Further details are listed in the 'Risk of bias' tables (Characteristics of included studies) and summary graphs of methodological quality (Figure 1; Figure 2). Only six of the eight trials included usable data (Cohen 1994; Dewey 1999; Flaherman 2013; Jonsdottir 2012; Martin‐Calama 1997; Nicoll 1982). Despite the possible methodological concerns, it should be noted that the included randomised controlled trials are overall methodologically superior to the many small observational studies and opinions often used as evidence for practice. The Cohen and Dewey studies report the training and process used to improve reliability of measurements by observers and consistency of data collection to reduce random error.
We had concerns about the quality of the Flaherman trial (Flaherman 2013), described as a pilot study to test feasibility. Eligibilty for the trial was more than 5% weight loss at anytime in the first 36 hours after birth though a 5% weight loss is within the range of accepted normality. The trial relied on weights collected routinely during hospital stay and did no weighing specific to time periods reported on in the trial (additional information from trial investigators). There was a lack of definition of breastfeeding and particularly of exclusive breastfeeding. The rates of exclusive breastfeeding dropped from week one to one month then increased in the both groups in month two and dropped in month three. This implies the definition of exclusive breastfeeding was not in accordance with World Health Organization guidelines in which once an infant receives supplements it cannot go back to a category of exclusive breastfeeding. The actual amount of supplement used in the first week was much higher in the control group compared to the intervention group (mean 262 mL versus 116 mL), which raised questions about adherence to protocol; which were not responded to when trial investigators were asked for further details. There was no definition of a “feed” thus the instruction to give the 10 mL of supplement “after each feed” could be eight times, 12 times or more and thus variable quantities consumed. As the supplement was given by pre‐loaded syringe the infant was not able to refuse the supplement if already content with the amount of breast milk received.
Three of the eight included studies provided no information on funding sources in their published papers (Martin‐Calama 1997; Ojofeitimi 1982; Schutzman 1986). Nicoll states that supplementary feeds used in the study were provided by Wyeth Laboratories (Nicoll 1982). Flaherman reports funding from the National Institute of Children Health and Human Development; if there was support for the provision of the intervention formula in pre‐filled syringes is not stated (Flaherman 2013). Cohen reports support from the Thrasher Research Fund, WHO, UNICEF Honduras, and Institute for Reproductive Health Washington DC under a grant from USAID; complementary jars of food were provided at reduced cost by Gerber Products Co (Cohen 1994). Dewey reports support from UNICEF and Wellstart International under a grant from USAID; support for the provision of jars of complementary food not stated (Dewey 1999). Jonsdottir 2012 received support from Mead Johnson and the Eimskip Fund of the University of Iceland.
Potential biases in the review process
We applied a search strategy to identify all potential trials. However, although we identified eight trials, we were unable to extract several relevant outcome data prespecified in our protocol. Some of these outcome measures were most likely not ascertained during the trial; however, others could have been collected but not reported. For the studies over 10 years since publication we did not contact the primary investigators to obtain any additional data.
Otherwise, to minimise bias, we followed the methodology for systematic reviews outlined in theCochrane Handbook for Systematic Reviews of Interventions (Higgins 2011).
Agreements and disagreements with other studies or reviews
A review to systematically evaluate the effect of supplemental fluids or feedings during the first days of life on the overall breastfeeding duration and rate of exclusive breastfeeding among healthy infants was conducted in 2006 (Szajewska 2006). The Szajewska 2006 review only included one of the trials (Martin‐Calama 1997) eligible for inclusion in this Cochrane review and concluded that there is insufficient evidence to form conclusions about the effect of brief exposure to additional food or fluids or both on infant health and the duration of breastfeeding.
One small pilot study included in this review (Flaherman 2013) presents data that would be in disagreement with findings of other studies (such as those cited in the Background) and with recommendations of professional, national and international organisations.
This review did not provide any disagreements with the Cochrane review by Kramer which included both observational studies and trials examining exclusive breastfeeding versus earlier introduction of complementary foods (Kramer 2002). This Kramer review forms the basis for the World Health Organization recommendations, and thus numerous other recommendations, that exclusive breastfeeding is recommended for the first six months after birth.

Methodological quality graph: review authors' judgements about each methodological quality item presented as percentages across all included studies.
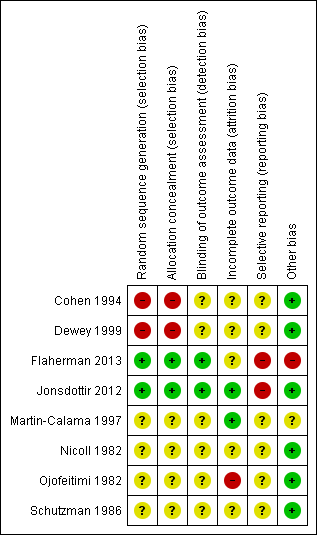
'Risk of bias' summary: review authors' judgements about each risk of bias item for each included study.
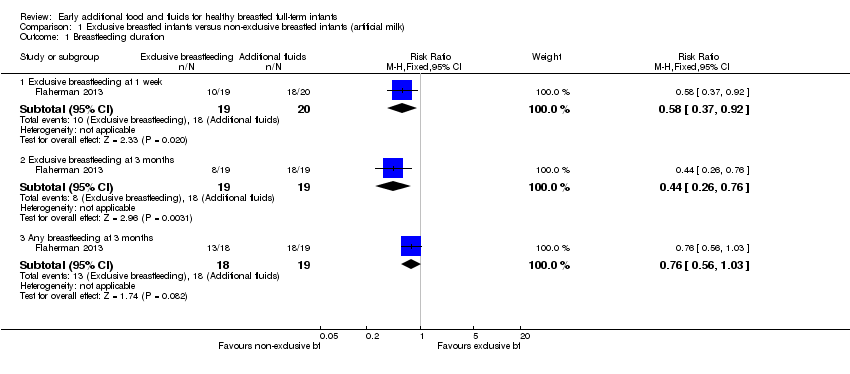
Comparison 1 Exclusive breastfed infants versus non‐exclusive breastfed infants (artificial milk), Outcome 1 Breastfeeding duration.

Comparison 1 Exclusive breastfed infants versus non‐exclusive breastfed infants (artificial milk), Outcome 2 Incidence of fever.

Comparison 1 Exclusive breastfed infants versus non‐exclusive breastfed infants (artificial milk), Outcome 3 Maternal self‐confidence.

Comparison 2 Exclusive breastfed infants versus non‐exclusive breastfed infants (water), Outcome 1 Breastfeeding duration.

Comparison 2 Exclusive breastfed infants versus non‐exclusive breastfed infants (water), Outcome 2 Maximum temperature (ºC).

Comparison 2 Exclusive breastfed infants versus non‐exclusive breastfed infants (water), Outcome 3 Minimum temperature (ºC).

Comparison 2 Exclusive breastfed infants versus non‐exclusive breastfed infants (water), Outcome 4 Episodes of hypoglycaemia (glycaemia < 2.2 mmol/l).

Comparison 2 Exclusive breastfed infants versus non‐exclusive breastfed infants (water), Outcome 5 Mean capillary blood glucose levels of infants (mmol/l).

Comparison 2 Exclusive breastfed infants versus non‐exclusive breastfed infants (water), Outcome 6 Weight change (g).

Comparison 2 Exclusive breastfed infants versus non‐exclusive breastfed infants (water), Outcome 7 Weight loss (%).
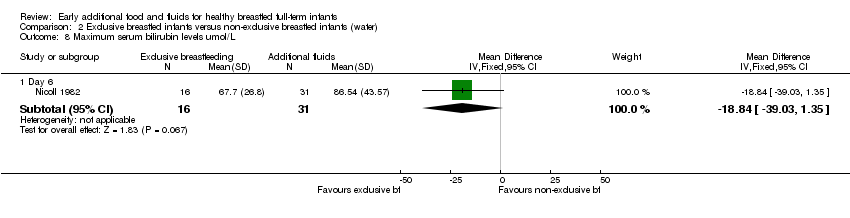
Comparison 2 Exclusive breastfed infants versus non‐exclusive breastfed infants (water), Outcome 8 Maximum serum bilirubin levels umol/L.

Comparison 3 Exclusive breastfed infants versus non‐exclusive breastfed infants (foods), Outcome 1 Fever (% of days).

Comparison 3 Exclusive breastfed infants versus non‐exclusive breastfed infants (foods), Outcome 2 Cough (% of days).
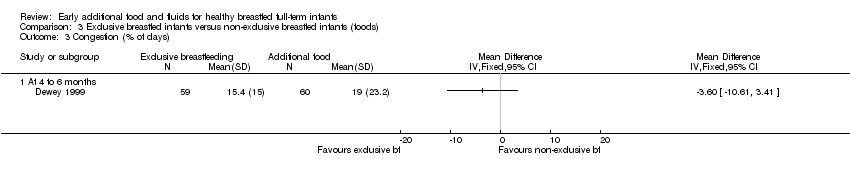
Comparison 3 Exclusive breastfed infants versus non‐exclusive breastfed infants (foods), Outcome 3 Congestion (% of days).
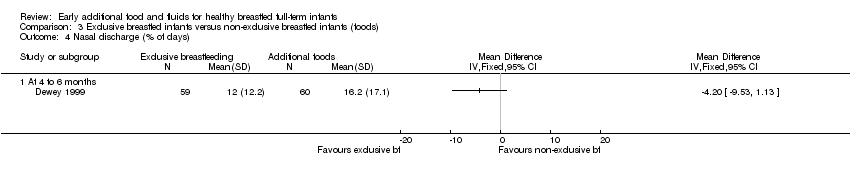
Comparison 3 Exclusive breastfed infants versus non‐exclusive breastfed infants (foods), Outcome 4 Nasal discharge (% of days).

Comparison 3 Exclusive breastfed infants versus non‐exclusive breastfed infants (foods), Outcome 5 Hoarseness (% of days).
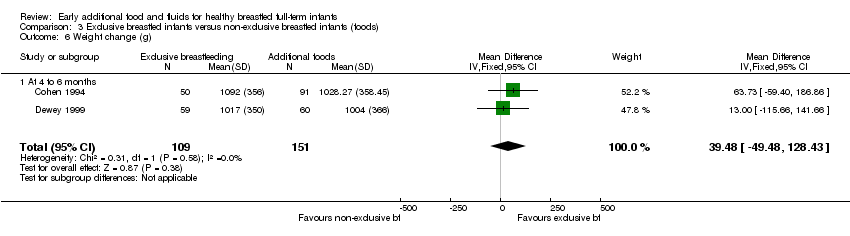
Comparison 3 Exclusive breastfed infants versus non‐exclusive breastfed infants (foods), Outcome 6 Weight change (g).

Comparison 3 Exclusive breastfed infants versus non‐exclusive breastfed infants (foods), Outcome 7 Weight change (z score).
| % of mothers who continued either exclusive or partial breastfeeding | Exclusive breastfeeding on day 1‐3 group (non‐glucose water) (n = 87) | Glucose water on day 1‐3 (n = 83) |
| At 4 weeks | 93% | 77% |
| At 8 weeks | 81% | 64% |
| At 12 weeks | 75% | 51% |
| At 16 weeks | 67% | 43% |
| At 20 weeks | 57% | 40% |
| These figures were estimated from a graph (Figure 2) on page 212 of the Martin‐Calama 1997 paper. | ||
| Outcome or subgroup title | No. of studies | No. of participants | Statistical method | Effect size |
| 1 Breastfeeding duration Show forest plot | 1 | Risk Ratio (M‐H, Fixed, 95% CI) | Subtotals only | |
| 1.1 Exclusive breastfeeding at 1 week | 1 | 39 | Risk Ratio (M‐H, Fixed, 95% CI) | 0.58 [0.37, 0.92] |
| 1.2 Exclusive breastfeeding at 3 months | 1 | 38 | Risk Ratio (M‐H, Fixed, 95% CI) | 0.44 [0.26, 0.76] |
| 1.3 Any breastfeeding at 3 months | 1 | 37 | Risk Ratio (M‐H, Fixed, 95% CI) | 0.76 [0.56, 1.03] |
| 2 Incidence of fever Show forest plot | 1 | 38 | Risk Ratio (M‐H, Fixed, 95% CI) | 1.5 [0.28, 7.99] |
| 3 Maternal self‐confidence Show forest plot | 1 | 39 | Mean Difference (IV, Fixed, 95% CI) | 0.10 [‐0.34, 0.54] |
| Outcome or subgroup title | No. of studies | No. of participants | Statistical method | Effect size |
| 1 Breastfeeding duration Show forest plot | 1 | Risk Ratio (M‐H, Fixed, 95% CI) | Subtotals only | |
| 1.1 At 4 weeks | 1 | 170 | Risk Ratio (M‐H, Fixed, 95% CI) | 1.21 [1.06, 1.38] |
| 1.2 At 8 weeks | 1 | 170 | Risk Ratio (M‐H, Fixed, 95% CI) | 1.26 [1.04, 1.53] |
| 1.3 At 12 weeks | 1 | 170 | Risk Ratio (M‐H, Fixed, 95% CI) | 1.48 [1.16, 1.89] |
| 1.4 At 16 weeks | 1 | 170 | Risk Ratio (M‐H, Fixed, 95% CI) | 1.54 [1.15, 2.05] |
| 1.5 At 20 weeks | 1 | 170 | Risk Ratio (M‐H, Fixed, 95% CI) | 1.45 [1.05, 1.99] |
| 2 Maximum temperature (ºC) Show forest plot | 1 | Mean Difference (IV, Fixed, 95% CI) | Subtotals only | |
| 2.1 At 72 hours | 1 | 170 | Mean Difference (IV, Fixed, 95% CI) | 0.10 [0.01, 0.19] |
| 3 Minimum temperature (ºC) Show forest plot | 1 | Mean Difference (IV, Fixed, 95% CI) | Subtotals only | |
| 3.1 At 72 hours | 1 | 170 | Mean Difference (IV, Fixed, 95% CI) | 0.10 [0.02, 0.18] |
| 4 Episodes of hypoglycaemia (glycaemia < 2.2 mmol/l) Show forest plot | 1 | Risk Ratio (M‐H, Fixed, 95% CI) | Subtotals only | |
| 4.1 At 6 hours of life | 1 | 170 | Risk Ratio (M‐H, Fixed, 95% CI) | 2.39 [0.48, 11.96] |
| 4.2 At 12 hours of life | 1 | 170 | Risk Ratio (M‐H, Fixed, 95% CI) | 14.32 [0.83, 246.80] |
| 4.3 At 24 hours of life | 1 | 170 | Risk Ratio (M‐H, Fixed, 95% CI) | 0.64 [0.11, 3.71] |
| 4.4 At 48 hours of life | 1 | 170 | Risk Ratio (M‐H, Fixed, 95% CI) | 2.86 [0.30, 26.97] |
| 5 Mean capillary blood glucose levels of infants (mmol/l) Show forest plot | 1 | Mean Difference (IV, Fixed, 95% CI) | Subtotals only | |
| 5.1 At 6 hours of life | 1 | 170 | Mean Difference (IV, Fixed, 95% CI) | ‐0.29 [‐0.56, ‐0.02] |
| 5.2 At 12 hours of life | 1 | 170 | Mean Difference (IV, Fixed, 95% CI) | ‐0.47 [‐0.70, ‐0.24] |
| 5.3 At 24 hours of life | 1 | 170 | Mean Difference (IV, Fixed, 95% CI) | ‐0.34 [‐0.60, ‐0.08] |
| 5.4 At 48 hours of life | 1 | 170 | Mean Difference (IV, Fixed, 95% CI) | ‐0.24 [‐0.51, 0.03] |
| 6 Weight change (g) Show forest plot | 1 | Mean Difference (IV, Fixed, 95% CI) | Subtotals only | |
| 6.1 At 6 hours of life | 1 | 170 | Mean Difference (IV, Fixed, 95% CI) | 7.0 [0.76, 13.24] |
| 6.2 At 12 hours of life | 1 | 170 | Mean Difference (IV, Fixed, 95% CI) | 11.5 [1.71, 21.29] |
| 6.3 At 24 hours of life | 1 | 170 | Mean Difference (IV, Fixed, 95% CI) | 13.40 [0.43, 26.37] |
| 6.4 At 48 hours of life | 1 | 170 | Mean Difference (IV, Fixed, 95% CI) | 32.5 [12.91, 52.09] |
| 6.5 At 72 hours of life | 1 | 170 | Mean Difference (IV, Fixed, 95% CI) | ‐3.0 [‐26.83, 20.83] |
| 7 Weight loss (%) Show forest plot | 1 | Mean Difference (IV, Fixed, 95% CI) | Subtotals only | |
| 7.1 Day 3 | 1 | 47 | Mean Difference (IV, Fixed, 95% CI) | 1.03 [‐0.18, 2.24] |
| 7.2 Day 5 | 1 | 47 | Mean Difference (IV, Fixed, 95% CI) | 0.20 [‐1.18, 1.58] |
| 8 Maximum serum bilirubin levels umol/L Show forest plot | 1 | Mean Difference (IV, Fixed, 95% CI) | Subtotals only | |
| 8.1 Day 6 | 1 | 47 | Mean Difference (IV, Fixed, 95% CI) | ‐18.84 [‐39.03, 1.35] |
| Outcome or subgroup title | No. of studies | No. of participants | Statistical method | Effect size |
| 1 Fever (% of days) Show forest plot | 1 | Mean Difference (IV, Fixed, 95% CI) | Totals not selected | |
| 1.1 4 to 6 months | 1 | Mean Difference (IV, Fixed, 95% CI) | 0.0 [0.0, 0.0] | |
| 2 Cough (% of days) Show forest plot | 1 | Mean Difference (IV, Fixed, 95% CI) | Totals not selected | |
| 2.1 At 4 to 6 months | 1 | Mean Difference (IV, Fixed, 95% CI) | 0.0 [0.0, 0.0] | |
| 3 Congestion (% of days) Show forest plot | 1 | Mean Difference (IV, Fixed, 95% CI) | Totals not selected | |
| 3.1 At 4 to 6 months | 1 | Mean Difference (IV, Fixed, 95% CI) | 0.0 [0.0, 0.0] | |
| 4 Nasal discharge (% of days) Show forest plot | 1 | Mean Difference (IV, Fixed, 95% CI) | Totals not selected | |
| 4.1 At 4 to 6 months | 1 | Mean Difference (IV, Fixed, 95% CI) | 0.0 [0.0, 0.0] | |
| 5 Hoarseness (% of days) Show forest plot | 1 | Mean Difference (IV, Fixed, 95% CI) | Totals not selected | |
| 5.1 At 4 to 6 months | 1 | Mean Difference (IV, Fixed, 95% CI) | 0.0 [0.0, 0.0] | |
| 6 Weight change (g) Show forest plot | 2 | 260 | Mean Difference (IV, Fixed, 95% CI) | 39.48 [‐49.48, 128.43] |
| 6.1 At 4 to 6 months | 2 | 260 | Mean Difference (IV, Fixed, 95% CI) | 39.48 [‐49.48, 128.43] |
| 7 Weight change (z score) Show forest plot | 1 | Mean Difference (IV, Fixed, 95% CI) | Totals not selected | |
| 7.1 4 to 6 months | 1 | Mean Difference (IV, Fixed, 95% CI) | 0.0 [0.0, 0.0] | |