Guía ecográfica para el bloqueo del miembro superior e inferior
Resumen
Antecedentes
Los bloqueos nerviosos periféricos pueden realizarse bajo guía ecográfica. Aún no está claro si este método de localización de un nervio tiene mayores beneficios que otros métodos existentes. Esta revisión fue publicada originalmente en 2009 y se actualizó en 2014.
Objetivos
El objetivo de esta revisión fue evaluar si el uso de la ecografía para guiar el bloqueo nervioso periférico tiene alguna ventaja con respecto a otros métodos de localización de nervios periféricos. Específicamente, los revisores se preguntaron si el uso de la guía ecográfica:
1. mejora las tasas de éxito y de efectividad del bloqueo anestésico regional, al aumentar el número de bloqueos que se evalúan como adecuados
2. reduce las complicaciones como el paro cardiorrespiratorio, el neumotórax o la punción vascular, asociadas con la realización del bloqueo anestésico regional
Métodos de búsqueda
En la actualización de 2014, se hicieron búsquedas en el Registro Cochrane Central de Ensayos Controlados (Cochrane Central Register of Controlled Trials) (CENTRAL; 2014, número 8); MEDLINE (julio 2008 hasta agosto 2014); EMBASE (julio 2008 hasta agosto 2014); ISI Web of Science (2008 hasta abril 2013); CINAHL (julio 2014); y en LILACS (julio 2008 hasta agosto 2014). Se completaron las búsquedas de citas hacia adelante y hacia atrás y en los registros de ensayos clínicos. La búsqueda original se realizó hasta julio de 2008. La búsqueda se repitió en mayo 2015. Se agregaron 11 estudios potenciales nuevos de interés a la lista de "Estudios en espera de clasificación" que se incorporarán a los hallazgos de la revisión formal durante las actualizaciones futuras de la revisión.
Criterios de selección
Se incluyeron ensayos controlados aleatorios (ECA) que compararon el bloqueo nervioso periférico guiado por ecografía de los miembros superiores e inferiores, solo o en combinación, con al menos otro método de localización nerviosa. En la actualización de 2014 se excluyeron los estudios que habían administrado anestésicos generales, espinales, epidurales u otros bloqueos nerviosos a todos los participantes, así como los que midieron la dosis mínima efectiva del fármaco anestésico. Esto dio lugar a la exclusión de cinco estudios de la revisión original.
Obtención y análisis de los datos
Dos autores de la revisión evaluaron de forma independiente la calidad de los ensayos y extrajeron los datos. Se utilizaron los procedimientos metodológicos Cochrane estándar, incluida una evaluación del riesgo de sesgo y el grado de experiencia del médico en todos los estudios.
Resultados principales
Se incluyeron 32 ECA con 2844 participantes adultos. Veintiséis evaluaron bloqueos del miembro superior y seis evaluaron bloqueos del miembro inferior. Diecisiete compararon ecografía con estimulación nerviosa periférica (ENP) y nueve compararon ecografía combinada con estimulación nerviosa (EN) versus ENP sola. Dos estudios compararon la ecografía con una técnica anatómica sin precedentes, uno con un enfoque transarterial y tres fueron diseños de tres brazos que incluyeron ecografía, ecografía + ENP y ENP.
Hubo variaciones en la calidad de las pruebas, con una falta de detalles en muchos de los estudios para evaluar si la asignación al azar, la ocultación de la asignación y el cegamiento de los evaluadores de resultado fueron suficientes. No fue posible cegar a los médicos, por lo que hubo alto riesgo de sesgo de realización en todos los estudios, lo que dio lugar a la disminución de la calidad de las pruebas mediante GRADE debido a las limitaciones de los estudios. No hubo detalles suficientes sobre la experiencia y los conocimientos especializados de los médicos ni sobre si la experiencia fue equivalente entre la intervención y el control.
Se realizó un metanálisis de los resultados principales. Se encontró que la guía ecográfica produce tasas de éxito superiores del bloqueo nervioso periférico, con más bloqueos evaluados como suficientes para la cirugía después de la prueba sensorial o motora (odds ratio [OR] de Mantel‐Haenszel [M‐H], efectos fijos 2,94 [intervalo de confianza (IC) del 95%: 2,14 a 4,04]; 1346 participantes) y menos bloqueos que requirieron la administración de suplementos o la conversión a anestesia general (OR de M‐H, efectos fijos 0,28 [IC del 95%: 0,20 a 0,39]; 1807 participantes) en comparación con el uso de ENP, técnicas anatómicas sin precedentes o un enfoque transarterial. No se consideraron los riesgos de falta de direccionalidad, imprecisión o inconsistencia de estos resultados y se utilizó GRADE para evaluar estos resultados como de calidad moderada. Los resultados también mostraron ventajas para los estudios que compararon ecografía + ENP con EN sola para los resultados mencionados (OR de M‐H, efectos fijos 3,33 [IC del 95%: 2,13 a 5,20]; 719 participantes, y OR de M‐H, efectos fijos 0,34 [IC del 95%: 0,21 a 0,56]; 712 participantes respectivamente). Hubo una menor incidencia de parestesia en ambos grupos de comparación de ecografía (OR de M‐H, efectos fijos 0,42 [IC del 95%: 0,23 a 0,76]; 471 participantes, y OR de M‐H, efectos fijos 0,97 [IC del 95%: 0,30 a 3,12]; 178 participantes respectivamente) y una menor incidencia de punción vascular en ambos grupos (OR de M‐H, efectos fijos 0,19 [IC del 95%: 0,07 a 0,57]; 387 participantes, y OR de M‐H, efectos fijos 0,22 [IC del 95%: 0,05 a 0,90]; 143 participantes). Hubo menos estudios para estos resultados, por lo que se disminuyó la calidad de la imprecisión y de la parestesia debido al posible sesgo de publicación. Lo anterior dio lugar a una evaluación general GRADE muy baja y baja para estos dos resultados, respectivamente. Los análisis mostraron que tomó menos tiempo realizar los bloqueos nerviosos en el grupo de ecografía (diferencia de medias [DM], IV, efectos fijos ‐1,06 [IC del 95%: ‐1,41 a ‐0,72]; 690 participantes) aunque tomó más tiempo realizar el bloqueo cuando la ecografía se combinó con una técnica de ENP (DM, IV, efectos fijos 0,76 [IC del 95%: 0,55 a 0,98]; 587 participantes). Debido a los niveles altos de heterogeneidad estadística no explicada, este resultado se calificó como de muy baja calidad. No se combinaron los datos para otros resultados debido a que los resultados de los estudios se habían presentado mediante diferentes escalas o con una combinación de datos de medias y medianas, aunque la interpretación de los datos de los estudios individuales favoreció a la ecografía debido a la reducción en otras complicaciones leves y la reducción en el tiempo hasta el inicio del bloqueo y el número de intentos para realizar el bloqueo.
Conclusiones de los autores
Hay pruebas de que el bloqueo nervioso periférico realizado mediante guía ecográfica solamente, o en combinación con ENP, es superior en cuanto a la mejoría del bloqueo sensorial y motor, la reducción en la necesidad de administración de suplementos y la reducción en las complicaciones leves informadas. El uso de ecografía sola acorta el tiempo de realización en comparación con la estimulación nerviosa, aunque cuando se utiliza en combinación con ENP aumenta el tiempo de realización.
No fue posible determinar si estos resultados reflejan el uso de la ecografía en manos experimentadas, y la posibilidad de considerar la curva de aprendizaje asociada con el bloqueo nervioso periférico mediante la técnica de ecografía en comparación con otros métodos estuvo más allá del alcance de esta revisión.
PICO
Resumen en términos sencillos
Guía ecográfica para el bloqueo del miembro superior e inferior
Antecedentes
Los bloqueos nerviosos se utilizan para anestesiar la totalidad o parte de los brazos o las piernas (bloqueo periférico) para la cirugía o para proporcionar un alivio adecuado del dolor después de la cirugía, o ambos. Mediante la ecografía, los anestesistas pueden "ver" las estructuras vitales debajo de la piel, que deberían permitirles colocar la inyección anestésica local con exactitud y evitar daños a otros tejidos u órganos. Se intentó evaluar si la ecografía tiene ventajas sobre otras técnicas para localizar los nervios para el bloqueo nervioso de los brazos o las piernas en adultos.
Características de los estudios
Las pruebas están actualizadas hasta 27 agosto 2014. Se encontraron 32 estudios con 2844 participantes. La mayoría de los estudios comparó la ecografía con estimuladores nerviosos eléctricos o compararon la ecografía combinada con estimuladores nerviosos versus estimuladores nerviosos solos. La búsqueda se repitió en mayo 2015. Cuando se actualice la revisión se analizarán los 11 estudios de interés.
Resultados clave
Los resultados de los estudios se combinaron mediante pruebas estadísticas y se encontró que el bloqueo nervioso tuvo una probabilidad mayor de ser evaluado como adecuado para la cirugía y una probabilidad menor de necesitar anestesia adicional cuando se realizó mediante guía ecográfica o mediante guía ecográfica combinada con otras técnicas. También se encontró que hubo menos complicaciones como "hormigueo y pinchazos" o punciones accidentales de los vasos sanguíneos. También tomó menos tiempo realizar el bloqueo nervioso al utilizar ecografía sola.
Calidad de la evidencia
Hubo variación en la calidad de los estudios y los autores no siempre hicieron intentos suficientes para asegurar que los evaluadores de resultado desconocieran qué técnica se había utilizado para el bloqueo nervioso. Los estudios a menudo tampoco explicaron claramente la experiencia de los médicos que realizaron el bloqueo nervioso. Este hecho es particularmente importante, debido a que la ecografía todavía es una técnica relativamente nueva y algunos anestesistas pueden tener experiencia limitada. Las pruebas sobre si el bloqueo nervioso fue suficiente y adecuado para la cirugía se consideraron de calidad moderada, aunque las pruebas de otros resultados fueron de calidad baja o muy baja.
Conclusiones
Las pruebas indican que la ecografía es superior a otras técnicas para el bloqueo nervioso periférico. Sin embargo, no es posible establecer si este resultado depende de la experiencia del médico con la técnica utilizada.
Authors' conclusions
Summary of findings
| Ultrasound guidance for upper and lower limb blocks | ||||||
| Patient or population: People undergoing upper and lower limb blocks | ||||||
| Outcomes | Illustrative comparative risks* (95% CI) | Relative effect | No of Participants | Quality of the evidence | Comments | |
| Assumed risk | Corresponding risk | |||||
| Control | Ultrasound guidance | |||||
| Block success (predicted adequacy of block) | Study population | OR 2.49 (2.14 to 4.04) | 1346 | ⊕⊕⊕⊝ | ||
| 791 per 1000 | 902 per 1000 | |||||
| Moderate | ||||||
| Block success (supplementation or conversion to general anaesthesia | Study population | OR 0.28 (0.20 to 0.39) | 1807 | ⊕⊕⊕⊝ | ||
| 185 per 1000 | 73 per 1000 | |||||
| Moderate | ||||||
| Paraesthesia | Study population | OR 0.42 (0.23 to 0.76) | 471 | ⊕⊝⊝⊝ | ||
| 171 per 1000 | 80 per 1000 | |||||
| Moderate | ||||||
| Vascular puncture | Study population | OR 0.19 (0.07 to 0.57) | 387 | ⊕⊕⊝⊝ | ||
| 93 per 1000 | 20 per 1000 | |||||
| Moderate | ||||||
| Time to perform block | The mean time to perform block in the intervention groups was | 690 | ⊕⊝⊝⊝ | |||
| Number of attempts9 | See comment | See comment | Not estimable9 | 0 | ⊕⊕⊝⊝ | |
| Patient discomfort9 | See comment | See comment | Not estimable9 | 0 | ⊕⊕⊝⊝ | |
| *The basis for the assumed risk (e.g. the median control group risk across studies) is provided in footnotes. The corresponding risk (and its 95% confidence interval) is based on the assumed risk in the comparison group and the relative effect of the intervention (and its 95% CI). | ||||||
| GRADE Working Group grades of evidence | ||||||
| 1Unavoidable performance bias due to lack of blinding but does not appear to affect results. Not possible to fully explore potential for operator bias according to preference and/or experience of devices | ||||||
Background
Description of the condition
Regional anaesthesia (using an injection of local anaesthetic to produce a 'nerve block' to numb a part of the body) has a well‐established role in anaesthetic practice. Nerve blocks may be used as the sole form of anaesthesia or to provide postoperative analgesia. For the block to work effectively, the local anaesthetic has to be injected in the correct place, near the nerve, so locating the nerve is vital (Denny 2005).
Various techniques have been used for finding nerves. Easily identifiable landmarks, usually bones or arteries, may be used to guide the point of needle insertion. Low‐current electrical nerve stimulators linked to the injection needle have also been used to locate the nerve. As the needle nears the nerve, muscles supplied by the nerve can be seen to twitch in time with the pulses of current. Latterly, ultrasound has been used to guide nerve block insertion and a number of approaches to nerves and plexuses (groups of nerves) have been reported (Chan 2003; Chan 2006; Kapral 1994; Kirchmair 2001; Sandhu 2002).
How the intervention might work
Proponents of ultrasound‐guided blocks suggest many benefits over other methods of nerve location (for instance, Marhofer 2005). 'Seeing' the nerve, needle, and spread of local anaesthetic as it is injected is said to be an advantage over the other techniques outlined above. It is possible to use the ultrasound image to position the needle more precisely, which should lead to a higher success rate and allow smaller volumes of drug to be used whilst still producing the desired effect. As the severity of the life‐threatening complications of local anaesthetic injection is proportional to the dose of drug injected, this should make blocks safer. Other important structures, for instance blood vessels, tendons, and pleura, can be more easily avoided. Some reports have also suggested faster onset times (Marhofer 1997; Marhofer 2004; Sandhu 2002), longer duration of block (Marhofer 2004), and improved quality of anaesthesia (Marhofer 1997; Marhofer 2004; Williams 2003).
Why it is important to do this review
Complications of regional anaesthesia are rare but can be serious. In a prospective study of 21,278 patients receiving peripheral nerve blocks, there were three episodes of cardiac arrest (1.4/10,000); 16 seizures (7.5/10,000); and four cases of neurological damage (radiculopathy) (1.9/10,000) (Auroy 1997). A follow‐up study in 2002 collected serious complications self‐reported by anaesthetists over a 10‐month period. Out of 50,223 peripheral nerve blocks, patients showed one cardiac arrest (0.2/10,000); two episodes of acute respiratory failure (0.3/10 000); six seizures (1.2/10,000); and 12 episodes of peripheral neuropathy (2.3/10,000) (Auroy 2002). However, due to underreporting, actual complication rates may be higher than is stated in the literature. It has been suggested that the use of ultrasound may reduce complication rates by allowing more accurate needle placement and avoidance of other structures.
Whilst it is clear that peripheral nerve blocks can be successfully performed using ultrasound guidance, it is important to systematically review the evidence supporting its use.
Objectives
The objective of this review was to assess whether the use of ultrasound to guide peripheral nerve blockade has any advantages over other methods of peripheral nerve location. Specifically, we have asked whether the use of ultrasound guidance:
-
improves success rates and effectiveness of regional anaesthetic blocks, by increasing the number of blocks that are assessed as adequate
-
reduces the complications, such as cardiorespiratory arrest, pneumothorax or vascular puncture, associated with the performance of regional anaesthetic blocks
Methods
Criteria for considering studies for this review
Types of studies
We included all identified randomized controlled trials (RCTs) comparing ultrasound‐guided peripheral nerve block with at least one other method of nerve location (anatomical landmark, paraesthesia, or use of an electrical peripheral nerve stimulator).
We excluded the use of ultrasound to guide epidural and spinal anaesthetic injections. We considered blocks performed for treatment of chronic pain to be beyond the scope of this review, as techniques and assessed outcomes are likely to be different. In this updated review we also excluded studies which had been designed to test the minimum effective volume of anaesthetic (MEAV), as it was not possible to effectively measure our primary outcome with this design. We also excluded studies that had given general anaesthetic, spinal, epidural or additional nerve blocks to all participants in addition to the nerve block under investigation, and therefore also excluded studies that described the purpose of the nerve block as 'postoperative analgesic' only. Also see Differences between protocol and review.
Types of participants
We aimed to include studies of adults undergoing surgery where peripheral nerve blocks were used as the primary anaesthetic technique. We only included studies where blocks were formally assessed with sensory testing. We included studies in which participants were given a nerve block for tourniquet pain in both groups in addition to the nerve block under investigation.
We excluded studies in children (aged less than 16 years) as there may be differences in the technique of nerve block in this group.
Types of interventions
The use of ultrasound to guide needle or catheter placement for peripheral nerve blockade compared with any other method of peripheral nerve location. As ultrasound may be used in addition to other localization techniques, we have examined the use of ultrasound alone or in combination with other practised techniques, including peripheral nerve stimulation and landmark approaches. We considered blocks performed by anaesthesiologists and other staff but have noted the level of experience in use of ultrasound and in block insertion in the description of studies included in the review. We took an a priori decision to only include limb blocks in the 2014 update.
Types of outcome measures
We reconsidered the outcome definitions for the 2014 update and made alterations to improve clarity. We divided the primary outcome of block success into two outcomes to distinguish between the assessments used to define block success, i.e. predicted adequacy of the block with the use of motor or sensory testing, and the assessment of whether surgical anaesthesia had been achieved without the need for supplementary anaesthesia or conversion to general anaesthesia. We adapted the complications outcome to include all complications. We did not include studies that specifically assessed the volume of anaesthetic given during nerve blocks, as outcome data from these studies could not adequately measure our primary outcome. Also see Differences between protocol and review
Primary outcomes
-
Block success defined as predicted adequacy of block (using sensory and motor testing)
-
Block success defined as participants given supplementation of block/conversion to general anaesthetic
-
Block complications
Secondary outcomes
-
Time to perform block; onset time; block duration time
-
Number of attempts to perform block (attempts defined as documented change in technique or in person attempting block)
-
Participant discomfort during block placement (pain on needle insertion)
Search methods for identification of studies
Electronic searches
We searched the following databases for relevant published trials: the Cochrane Central Register of Controlled Trials (CENTRAL;2014, Issue 8); MEDLINE (July 2008 to August 2014); EMBASE (July 2008 to August 2014); ISI Web of Science (2008 to April 2013); CINAHL (July 2014); and LILACS (July 2008 to August 2014). The original search (Walker 2009) was to July 2008.
We used the search strategy found in Appendix 1 to search MEDLINE (Ovid SP). We adapted this search for EMBASE (OvidSP) (see Appendix 2), CINAHL (EBSCO host) (see Appendix 3), ISI Web of Science (see Appendix 4) and LILACS (see Appendix 5). This search included the Cochrane Highly Sensitive Search Strategy to identify randomized controlled trials and controlled clinical trials. We used the search strategy found in Appendix 6 to search CENTRAL.
We checked registers of ongoing trials (www.clinicaltrials.gov; www.controlled‐trials.com) in August 2014 for relevant completed trials.
We reran the search in May 2015. We have added 11 potential new studies of interest to the list of Studies awaiting classification and will incorporate them during the next review update.
Searching other resources
We performed backward and forward citation searching of studies published in the last five years. In the original review (Walker 2009) the authors had made attempts to contact known authors in the research field as well as handsearching of journals. We did not complete this level of searching for the 2014 update.
We did not impose any language restriction.
Data collection and analysis
Selection of studies
For the 2014 updated review two authors from a team of four (Sharon Lewis (SL), Andrew Smith (AS), Kevin Walker (KJW) and Ken McGrattan (KMcG)) independently selected relevant trials by reviewing titles and abstracts from the searches. We obtained full copies of potentially relevant trials using the Criteria for considering studies for this review outlined above. We then assessed the methodological quality of the trials meeting these criteria. We included abstracts identified during the electronic searches that had been published without a full report if they presented sufficient information. Reasons for excluding trials are detailed in Characteristics of excluded studies.
Data extraction and management
Two authors from a team of four (SL, KJW, KMcG, and Ana Price (AP)) independently extracted data using a data extraction form. We attempted to contact primary authors for missing data. One author (SL or AP) entered the data into Review Manager 5 (RevMan 5.3) and the other author validated them.
Assessment of risk of bias in included studies
Due to changes to the ’Risk of bias’ tool in RevMan 5.3 since the original review (Walker 2009), we reconsidered the risk of bias for all included studies. These changes included separation of blinding of participants and personnel from blinding of outcome assessors. We considered each individual outcome for performance and detection bias. We assessed methodological quality using criteria outlined in the Cochrane Handbook for Systematic Reviews of Interventions (Higgins 2011). We assessed individual studies for adequacy of sequence generation, allocation concealment, blinding, handling of incomplete outcome data, selective outcome reporting, and other potential forms of bias. We made judgements of 'low' or 'high' risk of bias, and 'unclear', meaning that there was insufficient information to make a judgement. We made these judgements based on the information presented in the published papers only.
Measures of treatment effect
Given the changes to our eligibility criteria we reconsidered the decision not to pool the results, and felt that it was now appropriate to use meta‐analysis for each outcome where sufficient and appropriate data were available.
For dichotomous outcomes we used a Mantel‐Haenszel odds ratio with a fixed‐effect model. We combined continuous outcomes using the mean difference, inverse variance method.
We described a P value of less than 0.05 as statistically significant.
Unit of analysis issues
We included studies with three arms in this review. For each of these studies, we thought it reasonable and appropriate to combine dichotomous data for either the two similar intervention arms or two comparison arms and compare these data against the alternative group. For continuous data, i.e. time to perform block, we took data from one of the intervention arms and from the comparison arm only.
Dealing with missing data
In the event that a study did not include denominator figures, and we were unable to acquire the relevant data from the authors, we did not include these studies in meta‐analysis.
Assessment of heterogeneity
We expected the findings for any given outcome to differ between studies in this review. This heterogeneity may be due to:
-
different comparisons (peripheral nerve stimulation, anatomical landmark technique or transarterial approach)
-
different types of nerve block
-
catheter placement versus no catheter placement
-
differing experience of practitioners
We assessed heterogeneity using Chi² and I² statistics (Higgins 2003). We considered heterogeneity to be important at a Chi² P value less than 0.1 or I² greater than 50%, and carried out subgroup analyses to explore these differences.
Assessment of reporting biases
As we had a sufficient number of studies, we considered a visual analysis of a funnel plot, generated in RevMan 5.3, to consider the potential of publication bias in our included studies.
Data synthesis
For outcomes where there were sufficient studies, we combined data in meta‐analysis. For outcome data with insufficient studies or with results that were reported differently (for example with a P value only), we present these results individually in a narrative form.
Subgroup analysis and investigation of heterogeneity
We carried out subgroup analysis for those outcomes with a Chi² P value less than 0.1 or I² greater than 50%, in this case for the outcomes 'Time to perform block' and 'Paraesthesia', considering the groups above (in Assessment of heterogeneity).
Sensitivity analysis
We carried out sensitivity analysis on our results, stratified by risk of bias.
Results
Description of studies
We include summary descriptions of each study in Characteristics of included studies tables.
Results of the search
We identified 2804 studies assessed from electronic searches and a further 240 studies from backward and forward citation searching in the 2014 search. We found three ongoing studies from clinical trial databases. We considered a total of 2831 unique titles and abstracts, and from these we assessed a further 139 full texts for eligibility, alongside the included studies in Walker 2009. See Figure 1.

Study flow diagram.
We reran the search in May 2015. We found seven studies of interest which we will incorporate when we next update the review. See also Studies awaiting classification.
Included studies
Thirty‐two studies with a total of 2844 participants met our inclusion criteria (see Characteristics of included studies). All included studies were randomized controlled trials. All 32 studies were from single centres, involved only adult participants, and included people of both sexes. Of these, 19 were new studies identified from the updated search in June 2014 and 13 were from the original review.
Twelve studies assessed axillary brachial plexus block (Bloc 2010; Casati 2007a; Chan 2007; Conceição 2009; Geiser 2011; Gurkan 2008; Liu 2005; Meierhofer 2014; Morros 2009; Shrestha 2011; Sites 2006; Strub 2011), four studies assessed infraclavicular brachial plexus block (Brull 2009; Dhir 2008; Sauter 2008; Trabelsi 2013) and three assessed supraclavicular brachial plexus block (Renes 2009; Williams 2003; Zaragoza‐Lemus 2012), all for surgery of the hand, wrist or forearm. One study assessed a wrist block (Macaire 2008) for carpal tunnel release. There were four studies assessing interscalene brachial plexus block (Danelli 2012; Kapral 2008; Liu 2009a; Salem 2012) and one coracoid infraclavicular brachial plexus block (Taboada 2009), all for surgery of the shoulder or upper arm. Soeding 2005 assessed both an interscalene brachial plexus block and an axillary brachial plexus block within the same study. Seidel 2013 assessed a sciatic nerve block for foot or ankle, Domingo‐Triado 2007 assessed a mid‐femoral sciatic block and three studies a popliteal block for foot or ankle surgery (Dufour 2008; Perlas 2008; Van Geffen 2009). One popliteal fossa block was for hallux vagus correction (Cataldo 2012).
Seventeen studies compared the use of ultrasound alone with peripheral nerve stimulation (Brull 2009; Casati 2007a; Chan 2007; Conceição 2009; Danelli 2012; Geiser 2011; Kapral 2008; Macaire 2008; Meierhofer 2014; Perlas 2008; Renes 2009; Sauter 2008; Seidel 2013; Taboada 2009; Trabelsi 2013; Van Geffen 2009; Zaragoza‐Lemus 2012). Nine studies compared the use of ultrasound combined with nerve stimulation (ultrasound + nerve stimulation) with nerve stimulation alone (Cataldo 2012; Chan 2007;Domingo‐Triado 2007;Dufour 2008;Gurkan 2008; Morros 2009; Salem 2012; Shrestha 2011; Williams 2003). Remaining studies compared ultrasound with landmark technique (Soeding 2005; Strub 2011) or transarterial approach (Sites 2006) or were three‐arm studies comparing ultrasound (in‐plane approach) with ultrasound (out‐of‐plane approach) and with peripheral nerve stimulation (Bloc 2010), ultrasound + nerve stimulation with nerve stimulation (with or without a stimulating catheter) (Dhir 2008), or ultrasound (single injection) with ultrasound (double injection) and with nerve stimulation (double injection) (Liu 2005).
There were three studies that included placement of a catheter in the nerve block procedure (Danelli 2012; Dhir 2008; Salem 2012). In Danelli 2012, the catheter was placed after the injection of local anaesthetic and was therefore comparable with non‐catheter‐placement studies. For Dhir 2008 and Salem 2012, however, the local anaesthetic was administered through the catheter. We included six studies that gave details of additional nerve blocks for tourniquet pain (Domingo‐Triado 2007; Dufour 2008; Meierhofer 2014; Perlas 2008; Seidel 2013; Van Geffen 2009).
Primary outcomes
Twenty‐five studies evaluated our primary outcome of predicted adequacy of the block using methods of sensory and motor testing to describe the block as complete or adequate (Bloc 2010; Brull 2009; Cataldo 2012; Chan 2007; Dhir 2008; Domingo‐Triado 2007; Dufour 2008; Geiser 2011; Gurkan 2008; Kapral 2008; Liu 2005; Macaire 2008; Meierhofer 2014; Morros 2009; Perlas 2008; Renes 2009; Salem 2012; Sauter 2008; Sites 2006; Soeding 2005; Taboada 2009; Trabelsi 2013; Van Geffen 2009; Williams 2003; Zaragoza‐Lemus 2012). Twenty‐six studies also assessed whether participants required either supplementation of the block or conversion to a general anaesthetic (Brull 2009; Casati 2007a; Chan 2007; Conceição 2009; Dhir 2008; Domingo‐Triado 2007; Dufour 2008; Geiser 2011; Gurkan 2008; Kapral 2008; Liu 2005; Macaire 2008; Meierhofer 2014; Morros 2009; Perlas 2008; Renes 2009; Salem 2012; Sauter 2008; Seidel 2013; Shrestha 2011; Sites 2006; Soeding 2005; Strub 2011; Taboada 2009; Williams 2003; Zaragoza‐Lemus 2012)
Twenty‐one studies evaluated and reported a variety of complications (Bloc 2010; Brull 2009; Conceição 2009; Danelli 2012; Dhir 2008; Domingo‐Triado 2007; Dufour 2008; Gurkan 2008; Kapral 2008; Liu 2005; Meierhofer 2014; Morros 2009; Perlas 2008; Salem 2012; Sauter 2008; Shrestha 2011; Sites 2006; Soeding 2005; Strub 2011; Taboada 2009; Williams 2003).
Secondary outcomes
Twenty‐five studies measured time to perform block (Bloc 2010; Brull 2009; Cataldo 2012; Chan 2007; Conceição 2009; Danelli 2012; Dhir 2008; Domingo‐Triado 2007; Dufour 2008; Geiser 2011; Gurkan 2008; Liu 2005; Macaire 2008; Meierhofer 2014; Morros 2009; Perlas 2008; Salem 2012; Sauter 2008; Shrestha 2011; Sites 2006; Strub 2011; Taboada 2009; Trabelsi 2013; Van Geffen 2009; Williams 2003). Fifteen studies measured onset time of block (Casati 2007a; Cataldo 2012; Danelli 2012; Domingo‐Triado 2007; Gurkan 2008; Kapral 2008; Macaire 2008; Meierhofer 2014; Salem 2012; Sauter 2008; Seidel 2013; Shrestha 2011; Strub 2011; Taboada 2009; Trabelsi 2013). Four studies measured duration of block ( Dhir 2008; Domingo‐Triado 2007; Kapral 2008; Soeding 2005).
There were seven studies which reported the number of attempts to perform the block (Casati 2007a; Cataldo 2012; Danelli 2012; Dufour 2008; Sauter 2008; Shrestha 2011; Van Geffen 2009).
Seven studies reported participant discomfort during block placement (Bloc 2010; Casati 2007a; Dufour 2008; Macaire 2008; Meierhofer 2014; Sauter 2008; Van Geffen 2009). Two further studies reported participants' level of satisfaction with the procedure (Cataldo 2012; Soeding 2005).
Excluded studies
There were 18 studies in the original review (Walker 2009). Following the changes made to the review inclusion criteria in the 2014 update, we excluded five of these previously included studies. Four of them gave additional anaesthesia to all participants following the nerve block (Danelli 2009a; Dolan 2008; Marhofer 1997; Marhofer 1998) and one had used a MEAV study design (Casati 2007b).
During the updated search we identified a further 18 studies that were excluded either as MEAV study designs, studies in which additional anaesthesia was given to all participants or studies in which participants were scheduled for surgery other than for lower/upper extremity procedures.
We excluded six abstracts which were potentially eligible but provided insufficient detail. We excluded two studies as ultrasound was used pre‐puncture in both groups, and one study due to lack of randomization details in the full text. Redborg 2009 had previously been in Characteristics of studies awaiting classification but was assessed for this update as not eligible due to the use of volunteer non‐surgical participants.
In total, we excluded 33 studies from the updated review. Details are in Characteristics of excluded studies.
Ongoing studies
In the original review (Walker 2009) there were six potentially relevant studies listed as 'ongoing'. Two of these studies are now published; Liu 2009a is included in this update, and McCartney 2008 is an abstract only and has insufficient information to include. A third study (Dhir 2013) is complete but the results are not yet available, and has been included in Characteristics of studies awaiting classification. Two were no longer available in online clinical trials registers (www.clinicaltrials.gov; www.controlled‐trials.com) and we were unable to find any details for these in our searches. These studies (previously referenced as Freitas 2007 and Schwemmer 2006) were therefore removed from the list of ongoing studies.
One study was still ongoing (NCT 00213954), along with a further three studies (NCT 009956683; NCT 01010412; NCT02020096) identified from an up‐to‐date search of the above clinical trials registers. Details for these are given in Characteristics of ongoing studies
There are now four ongoing studies in the updated review.
Studies awaiting assessment
There are four studies awaiting assessment in the updated review. We have been unable to access the full text of one study (González 1993), and we await full texts for two studies (Dhir 2013; NCT 01579747), while one Chinese study (Li 2013) requires translation. Details are given in Characteristics of studies awaiting classification.
We identified a further seven studies during a rerun of the search in May 2015 (Aytac 2015; Eren 2014; Kumar 2014; Lam 2014; Martinez Navas 2014; Smith 2014; Stavrati 2014). We will assess these and incorporate them into the next review update. There are now 11 studies awaiting assessment.
Risk of bias in included studies
We conducted a 'Risk of bias' assessment for each study and give details in the Characteristics of included studies tables. Summaries of our assessment are included in Figure 2 and Figure 3.

Methodological quality graph: review authors' judgements about each methodological quality item presented as percentages across all included studies.

Methodological quality summary: review authors' judgements about each methodological quality item for each included study.
Allocation
All 32 studies were described as randomized but only 20 provided sufficient detail of the methods used to be judged as being at low risk of bias (Brull 2009; Casati 2007a; Chan 2007; Conceição 2009; Danelli 2012; Domingo‐Triado 2007; Dufour 2008; Geiser 2011; Kapral 2008; Liu 2005; Liu 2009a; Meierhofer 2014; Morros 2009; Perlas 2008; Renes 2009; Sauter 2008; Seidel 2013; Shrestha 2011; Sites 2006; Strub 2011). There were only two studies that provided an adequate description of the methods used to conceal group allocation to participants and personnel (Kapral 2008; Perlas 2008).
Blinding
Due to the nature of the intervention, blinding of the practitioner was never going to be possible and it is therefore an unavoidable source of bias. It was necessary for us to judge performance bias across all outcomes in all studies as being at high risk of bias due to this lack of blinding. It was, however, possible for detection bias to be reduced by ensuring that observers/investigators collecting data for some of the outcomes were blinded to group allocation. Seventeen studies had reported sufficient information on whether outcome assessors were blinded to group allocation on at least one of the outcomes (Brull 2009; Casati 2007a; Cataldo 2012; Domingo‐Triado 2007; Dufour 2008; Gurkan 2008; Liu 2005; Liu 2009a;Meierhofer 2014; Perlas 2008; Sauter 2008; Seidel 2013; Shrestha 2011; Sites 2006; Taboada 2009; Trabelsi 2013; Van Geffen 2009). Only two trials made an attempt to blind the participants to the technique being used through the use of a sham ultrasound device (Chan 2007; Perlas 2008).
Incomplete outcome data
There were few losses of study participants overall and all but four of the studies (Brull 2009; Chan 2007; Dufour 2008; Sites 2006) were assessed as being at a low risk of attrition bias.
Brull 2009 had few losses for all outcomes except complications, for which only 49% of participants were contacted for follow‐up at one week postoperatively. We assessed this as being at unclear risk of bias. Chan 2007 lost 14% of its intended participants who were required to go to surgery before the end of 30 minutes post‐block. We judged that some outcome data could still have been collected from these participants and we therefore felt that this study was at high risk of attrition bias, along with Dufour 2008 which also had several losses. We judged Sites 2006 as being at high risk of bias, as this study stopped early due to a high number of failed blocks in the transarterial approach group.
Selective reporting
We were able to source the protocols for five of the studies from clinicaltrials.gov and compare the reported outcomes with protocol outcomes (Chan 2007; Danelli 2012; Perlas 2008; Sauter 2008; Seidel 2013). We judged these as being at low risk of selective outcome reporting bias, as all outcomes were reported as planned. However, we were unable to make a judgement on the remaining studies for high or low risks of bias.
Other potential sources of bias
There was one study that failed to report any baseline characteristics (Soeding 2005) and we were therefore unable to make a judgement on whether any bias could have been introduced. A further four studies reported baseline characteristics for which there were some discrepancies between groups: in Dhir 2008 there were more older participants in the nerve stimulation (with stimulating catheter) group; in Domingo‐Triado 2007 there were differences between groups in the types of surgery; in Geiser 2011 there were more women than men reported in the table, although the text stated that there was no difference; and in Dufour 2008 there was a difference in the ASA status between groups. We were unsure whether these differences could potentially introduce any bias into the results, and assessed them as being at unclear risk. The remaining 27 studies all had comparable baseline characteristics between participants.
We were interested in whether study authors had been provided with any funding for their research and therefore considered this in our assessment of risk of bias. There were five studies that declared that the ultrasound or nerve stimulator equipment had been provided by the manufacturer for the purpose of the study (Brull 2009; Chan 2007; Gurkan 2008; Sites 2006; Van Geffen 2009). We judged these studies to be at a higher risk of bias. All other studies either declared funding from departmental sources only, or did not make any funding declarations, and we assessed them as being at low risk of bias.
The experience of practitioners in both ultrasound and control techniques, as well as the number of practitioners involved, varied across studies. There were 12 studies that described the person giving the block as experienced (Bloc 2010; Brull 2009; Casati 2007a; Danelli 2012; Kapral 2008; Meierhofer 2014; Morros 2009; Perlas 2008; Salem 2012; Sauter 2008; Soeding 2005; Taboada 2009). However, even for those that stated that the practitioners had experience in both techniques, it was not clear whether this experience was equivalent for each technique. For this reason we were unable to judge whether any bias had been introduced by the practitioners in these studies. Some procedures were performed by anaesthesia residents under supervision (Chan 2007; Williams 2003), and we felt that could be likely to introduce bias, particularly for block performance time, and therefore assessed them as being at high risk. We also rated studies at high risk of bias if it was clear that the practitioner had more experience in one technique than the other, or that different procedures were intentionally performed by different practitioners.
Effects of interventions
See: Summary of findings for the main comparison Ultrasound guidance for upper and lower limb blocks
Primary outcomes
1. Block success ‐ predicted adequacy of block
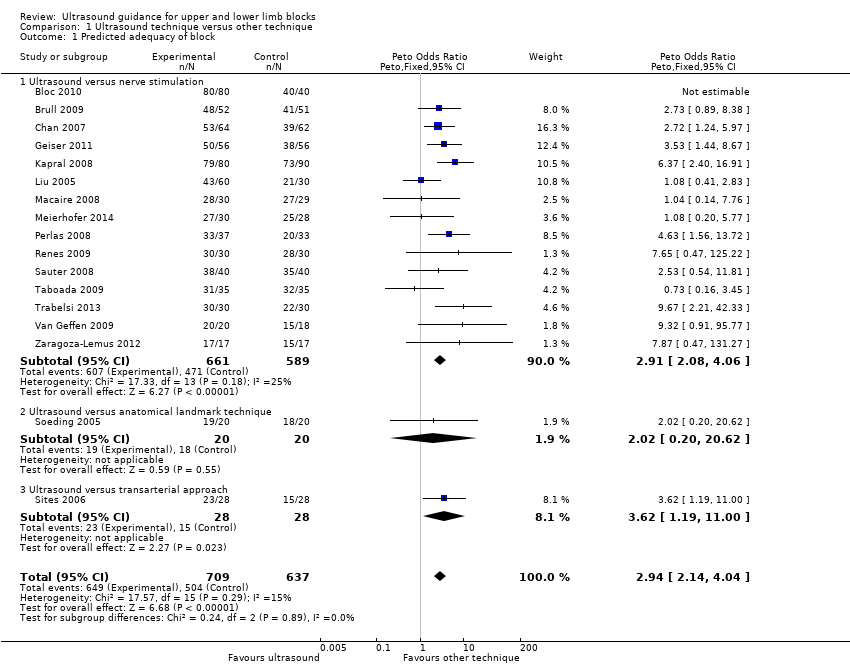
There were 17 studies with 1346 participants comparing ultrasound guidance with either nerve stimulation (15 studies: Bloc 2010; Brull 2009; Chan 2007; Geiser 2011; Kapral 2008; Liu 2009a; Macaire 2008; Meierhofer 2014; Perlas 2008; Renes 2009; Sauter 2008; Taboada 2009; Trabelsi 2013; Van Geffen 2009; Zaragoza‐Lemus 2012), anatomical landmark technique (one study: Soeding 2005) or a transarterial approach (one study: Sites 2006) and reporting on predicted adequacy of the block. This outcome was often described by the authors as "block success" and was evaluated using appropriate sensory and motor testing at intervals following the procedure, using a scale to determine the degree of block. We combined data described as "complete", "successful" of "sufficient" block. If studies separated results for adequacy of sensory and motor success, we used data from the sensory block.
For the purpose of this analysis we combined the two ultrasound groups in both Bloc 2010 and Liu 2005. We also included data for Chan 2007 for the ultrasound alone versus nerve stimulation group. The analysis demonstrated a statistically significant difference between the ultrasound versus nerve stimulation groups, with a higher rate of predicted adequacy of the block in the ultrasound group than the comparison group (Mantel‐Haenszel (M‐H) odds ratio (OR) 3.01 (95% confidence interval (CI) 2.11 to 4.31), 1250 participants, P value < 0.00001). When data for Soeding 2005 (anatomical landmark technique) and Sites 2006 (transarterial approach) were also included the result remained statistically significant in favour of ultrasound (M‐H OR 3.06 (95% CI 2.18 to 4.30), 1346 participants, P value < 0.00001). This result shows a low level of heterogeneity (I² = 13%). Considering the potential effect of bias on this result we graded this to be moderate‐quality evidence of an effect in the 'Summary of findings' table. A funnel plot did not suggest publication bias for this outcome. See Analysis 1.1, summary of findings Table for the main comparison and Figure 4.
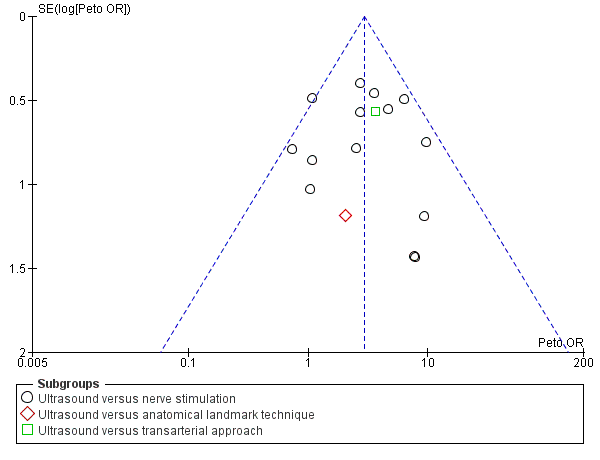
Funnel plot of comparison: 1 Ultrasound technique versus other technique, outcome: 1.1 Predicted adequacy of block.
There were nine studies with 719 participants comparing ultrasound + nerve stimulation versus nerve stimulation technique and reporting on predicted adequacy of the block (Cataldo 2012; Chan 2007; Dhir 2008; Domingo‐Triado 2007; Dufour 2008; Gurkan 2008; Morros 2009; Salem 2012; Williams 2003). For the purpose of this analysis, we combined data in Dhir 2008 for the two nerve stimulation groups. The analysis demonstrated a statistically significant difference between the two groups, again with a higher rate of predicted adequacy of the block in the ultrasound group, than the comparison group (M‐H OR 3.33 (95% CI 2.13 to 5.20), P value < 0.00001). This result shows a low level of heterogeneity (I² = 26%). See Analysis 2.1.
2. Block success ‐ supplementation requirement
There were 18 studies with 1807 participants comparing ultrasound guidance with either nerve stimulation (15 studies: Bloc 2010; Casati 2007a; Chan 2007; Conceição 2009; Geiser 2011; Kapral 2008; Liu 2005; Liu 2009a; Macaire 2008; Meierhofer 2014; Perlas 2008; Renes 2009; Sauter 2008; Seidel 2013; Taboada 2009), anatomical landmark technique (two studies: Soeding 2005; Strub 2011) or a transarterial approach (one study: Sites 2006) and reporting on supplementation rates. Authors sometimes described this outcome as "block failure" and defined it as the need for participants to be given either supplementary block, local anaesthetic, supplementary intraoperative analgesics or conversion to general anaesthesia. For the purpose of this outcome, we combined all supplementary anaesthesia/analgesia together. As above, we combined the two ultrasound groups in Liu 2005. There was a statistically significant difference between groups with fewer participants in the ultrasound group requiring additional supplementation (Mantel‐Haenszel (M‐H) OR 0.31 (95% CI 0.21 to 0.46),1570 participants, P value < 0.00001). When we included data for Soeding 2005 and Strub 2011 (anatomical landmark technique) and Sites 2006 (transarterial approach), the results remained statistically significant (M‐H OR 0.28 (95% CI 0.20 to 0.39), P value < 0.00001). Again, there was a low level of heterogeneity in this result (I² = 16%), and we graded it as moderate‐quality evidence of an effect in the 'Summary of findings' table. See Analysis 1.2 and summary of findings Table for the main comparison.
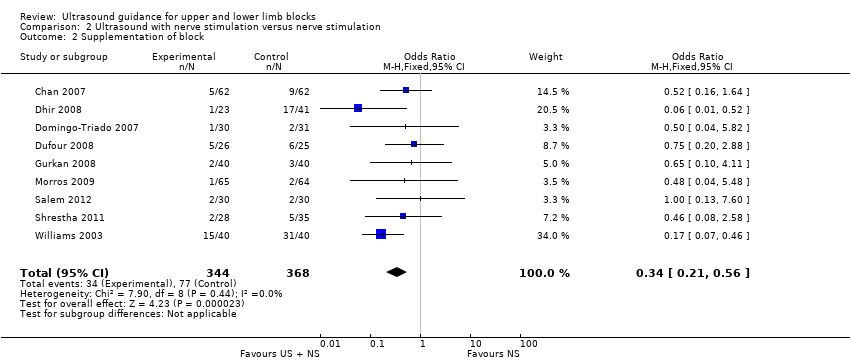
There were nine studies (Chan 2007; Dhir 2008; Domingo‐Triado 2007; Dufour 2008; Gurkan 2008; Morros 2009; Salem 2012; Shrestha 2011; Williams 2003) with 712 participants comparing ultrasound guidance + nerve stimulation versus nerve stimulation technique and reporting on supplementation rates, as above. We combined data for the two nerve stimulation groups in Dhir 2008. The results were statistically significantly different, again with a lesser need for supplementation in the ultrasound group (M‐H OR 0.34 (95% CI 0.21 to 0.56), 1807 participants, P value < 0.00001, I² = 0%. See Analysis 2.2.
3. Complications
Complication rates were recorded in 23 trials There were no reported incidences of major complications (cardiorespiratory arrest, seizures, pneumothorax, nerve injury) in any included study. Paraesthesia and vascular puncture were the most frequently reported complications and we included data for these in meta‐analysis.
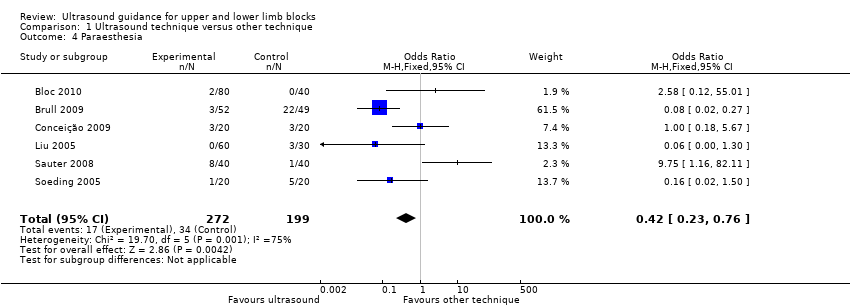
There were six studies (Bloc 2010; Brull 2009; Conceição 2009; Liu 2005; Sauter 2008; Soeding 2005) with 471 participants that reported data for paraesthesia for the groups ultrasound versus nerve stimulation (five studies) and anatomical landmark technique (one study). This analysis showed more incidences of paraesthesia in the nerve stimulation group (M‐H OR, 0.42 (95% CI 0.23 to 0.76)). However there was a high level of heterogeneity in this analysis (I² = 75%) and it is clear that the result is influenced by Brull 2009 with a very large number of events (22 events, 45%) in the nerve stimulation group. We downgraded the quality of this evidence to very low on account of the relatively few events reported in studies and the high level of heterogeneity. See Analysis 1.4 and summary of findings Table for the main comparison. There were only three studies (Dhir 2008; Dufour 2008; Shrestha 2011) with 178 participants that reported data for paraesthesia for the groups ultrasound + nerve stimulation versus nerve stimulation alone. There was no significant difference in this analysis (M‐H OR, 0.97 (95% CI 0.30 to 3.12), P value = 0.95). See Analysis 2.4.
There were five studies with 387 participants that reported data for vascular puncture for the groups ultrasound versus nerve stimulation (four studies: Bloc 2010; Brull 2009; Conceição 2009; Taboada 2009) and transarterial approach (one study: Sites 2006). The result (M‐H OR 0.19 (95% CI 0.07 to 0.57)) showed that there were fewer incidences of vascular puncture in the ultrasound groups and we graded this as low level of evidence in the 'Summary of findings' table. See Analysis 1.5 and summary of findings Table for the main comparison. There were only two studies (Gurkan 2008; Shrestha 2011; 143 participants) that reported data for vascular puncture from our comparison groups of ultrasound + nerve stimulation versus nerve stimulation alone, and again this analysis showed a statistically significant effect of fewer incidences of vascular puncture in the ultrasound + nerve stimulation group (M‐H OR 0.22 (95% CI 0.05 to 0.90)). See Analysis 2.5.
One study reported data for axillary vessels puncture (Liu 2005, three incidences in the nerve stimulation group). Meierhofer 2014 gave data for venous puncture (one incidence in the nerve stimulation group) and for arterial puncture (two incidences in both groups) and Morros 2009 also for arterial puncture (one incidence in the ultrasound group and two in the nerve stimulation group).
Studies gave differing terms for nerve damage, but it was not always clear whether these effects were immediate, medium‐ or long‐term and whether they were equivalent between studies. It was therefore not possible to combine them in meta‐analysis. Studies that reported on such complications were Domingo‐Triado 2007; Kapral 2008; Perlas 2008; Salem 2012; Sites 2006; and Strub 2011. Of these, Kapral 2008 and Sites 2006 reported no events and Salem 2012 reported that such effects were equivalent between groups. Perlas 2008 reported more numbness at 24 hours postoperatively in the ultrasound group (eight versus four events) and more weakness at this time point in the ultrasound group (10 versus two events). Strub 2011 reported two events of neuralgia in the hand in the traditional nerve block technique and no events in the ultrasound group. Domingo‐Triado 2007 reported that one participant had neuropathic pain at one week in the nerve stimulation group which resolved within 10 days.
Other effects reported were tachycardia (Brull 2009, one event in the nerve stimulation group), subcutaneous haematoma (Liu 2005, one event in the nerve stimulation group), haematoma requiring additional manual compression (Sites 2006, two events in the transarterial approach group), axillary haematoma (Strub 2011, five events in the traditional nerve block technique and two in the ultrasound group), prolonged pain in axilla (Strub 2011, three in traditional group and one in ultrasound group) and respiratory discomfort (Williams 2003, one participant in each group).
Secondary outcomes
1a.Time to perform block
There were 25 studies that reported data for time to perform block (Bloc 2010; Brull 2009; Cataldo 2012; Chan 2007; Conceição 2009; Danelli 2012; Dhir 2008; Domingo‐Triado 2007; Dufour 2008; Geiser 2011; Gurkan 2008; Liu 2005; Macaire 2008; Meierhofer 2014; Morros 2009; Perlas 2008; Salem 2012; Sauter 2008; Shrestha 2011; Sites 2006; Strub 2011; Taboada 2009; Trabelsi 2013; Van Geffen 2009; Williams 2003). However, some of these data were presented as median and interquartile range, or presented means without standard deviations, and it was therefore not possible to include them in the meta‐analysis (Bloc 2010; Brull 2009; Conceição 2009; Danelli 2012; Domingo‐Triado 2007; Macaire 2008; Sauter 2008; Strub 2011). We did not combine data for Cataldo 2012 in our analysis which had given time data by each blocked nerve. We also decided that those studies which included catheter placement should not be included in this analysis, due to the increased length of time involved in this procedure. We therefore excluded Dhir 2008 and Salem 2012. Whilst there was some variation in definition of performance time, we felt that these were similar enough to warrant meta‐analysis. We present definitions, where available, in Characteristics of included studies.
Our first meta‐analysis was conducted using only 10 studies of ultrasound versus nerve stimulation (nine studies: Chan 2007; Conceição 2009; Geiser 2011; Liu 2005; Meierhofer 2014; Perlas 2008; Taboada 2009; Trabelsi 2013; Van Geffen 2009) and transarterial approach (one study: Sites 2006) with a total of 690 participants. For Liu 2005, it was not possible to combine the data for the two ultrasound groups and we therefore only compared the ultrasound (double‐injection) group against the nerve stimulation (double‐injection) group.
The analysis showed a statistically significant difference, with performance time being less in the ultrasound group (mean difference (MD), IV fixed‐effect, ‐1.06 (95% CI ‐1.41 to ‐0.72), P value < 0.00001). See Analysis 1.3.
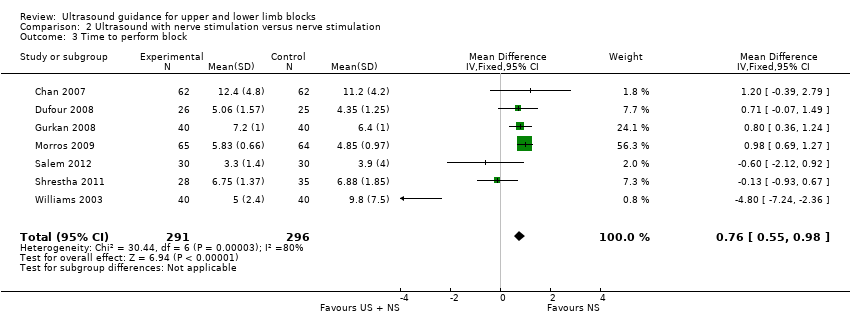
For performance time, seven studies with a total of 587 participants (Chan 2007; Dufour 2008; Gurkan 2008; Morros 2009; Salem 2012; Shrestha 2011; Williams 2003) compared ultrasound guidance + nerve stimulation with nerve stimulation technique. There was a statistically significant difference between groups, with performance time being less in the nerve stimulation group (MD, IV, fixed‐effect, 0.76 (95% CI 0.55 to 0.98)). See Analysis 2.3.
There was a high level of heterogeneity for both these analyses (I² = 88% in Analysis 1.3 and I² = 80% in Analysis 2.3). We subsequently downgraded the quality of evidence for this result to very low, taking into account the high level of heterogeneity and potential differences in experience of personnel which could affect this result. See summary of findings Table for the main comparison.
We also considered those studies for which we did not conduct meta‐analysis for this outcome. Of those studies comparing ultrasound with nerve stimulation, five reported a statistically significantly shorter time to perform block in the ultrasound groups (Bloc 2010: P value < 0.05; Brull 2009: P value < 0.001; Danelli 2012: P value = 0.01; Macaire 2008: P value = 0.02; Sauter 2008: P value = 0.003). Conceição 2009 reported a shorter time in the ultrasound group but this was not statistically significant. Cataldo 2012 reported a statistically significantly shorter time in the ultrasound + nerve stimulation group (P value = 0.02). Dhir 2008 reported a statistically significantly shorter time in the nerve stimulation compared to other groups (P value < 0.0001). Strub 2011 reported no significant differences between groups in time to perform block. We were unable to extract data for Salem 2012, due to their methods of presentation of results.
1b. Onset time of block
There were 15 studies (Casati 2007a; Cataldo 2012; Danelli 2012; Domingo‐Triado 2007; Gurkan 2008; Kapral 2008; Macaire 2008; Meierhofer 2014; Salem 2012; Sauter 2008; Seidel 2013; Shrestha 2011; Strub 2011; Taboada 2009; Trabelsi 2013) that evaluated onset time of block. However, the studies reported data in different ways, sometimes reporting median (range or interquartile range) and sometimes mean and standard deviation. There were also differences in whether results were presented for each nerve separately or combined, and whether or not sensory or motor block onset time was reported separately. We therefore did not combine these data in meta‐analysis. Six studies reported a statistically significant difference between groups, favouring a shorter onset time in the ultrasound group with P value less than 0.05 (Casati 2007a (for sensory block only); Kapral 2008; Seidel 2013; Shrestha 2011; Strub 2011; Trabelsi 2013 (for the sensory block only)). Nine studies reported no significant differences between groups in onset time (Casati 2007a (for motor block only); Cataldo 2012; Danelli 2012; Domingo‐Triado 2007; Meierhofer 2014; Salem 2012; Sauter 2008; Taboada 2009; Trabelsi 2013 (for motor block only)). Macaire 2008 reported a significantly shorter onset time in the nerve stimulation group (P value < 0.02).
1c. Duration of block
There were four studies that evaluated duration of block. Kapral 2008 reported a statistically significant difference between groups, with blocks in the ultrasound group having a longer duration than the nerve stimulation group (P value < 0.05). The remaining studies reported that there was no significant difference between groups for block duration time (Dhir 2008; Domingo‐Triado 2007; Soeding 2005).
2. Number of attempts
There were seven studies (Casati 2007a; Cataldo 2012; Danelli 2012; Dufour 2008; Sauter 2008; Shrestha 2011; Van Geffen 2009) that reported on the number of attempts, defined as needle/skin punctures or needle passes (forward movement preceded by retraction of needle). Individual study definitions are given in Characteristics of included studies. Results were reported as mean and standard deviation or median and range, and it was not possible to pool data. Three studies reported that there were significantly fewer needle passes or skin punctures in the ultrasound group (Danelli 2012: P value = 0.01; Sauter 2008: P value < 0.001; Van Geffen 2009: P value = 0.029). Shrestha 2011 reported fewer attempts in the ultrasound + nerve stimulation group than the nerve stimulation group. Cataldo 2012 reported significantly more needle punctures in the intervention group (P value = 0.004). Dufour 2008 , whilst reporting significantly more needle passes to locate the first nerve in the comparison, reported with Casati 2007a that the difference in the number of skin punctures was not significant. We graded this evidence as being of low quality in the summary of findings Table for the main comparison.
3. Participant discomfort
There were seven studies (Bloc 2010; Casati 2007a; Dufour 2008; Macaire 2008; Meierhofer 2014; Sauter 2008; Van Geffen 2009) in which participants reported discomfort. Five of these reported responses on a visual analogue scale or numerical rating score for satisfaction with the procedure or discomfort/pain during procedure (Dufour 2008; Macaire 2008; Meierhofer 2014; Sauter 2008; Van Geffen 2009). All five studies reported that there was no statistically significant difference between groups. Casati 2007a asked if participants would accept the same procedure again and there were no statistically significant differences between groups. Only Bloc 2010 reported a statistically significant difference for this outcome, with fewer participants describing the procedure as unpleasant in the ultrasound (out‐plane approach) than the ultrasound (in‐plane approach) or nerve stimulation group. We graded evidence for this outcome as being of low quality in the summary of findings Table for the main comparison.
Subgroup analysis
The outcomes 'Time to perform block' and 'Paraesthesia' both had a high level of statistical heterogeneity (I² = 88% in Analysis 1.3; I² = 80% in Analysis 2.3; I²= 75% in Analysis 1.4).
1.Different types of comparisons
We performed subgroup analysis according to the comparison group, i.e. nerve stimulation, anatomical landmark or transarterial approach. For 'Time to perform block', all but one study compared with nerve stimulation and there remained a high level of heterogeneity in this group, I² = 89%. See Analysis 3.1. Similarly for 'Paraesthesia', we were not able to explain heterogeneity by subgroup analysis, again with only one study not comparing against nerve stimulation and statistical heterogeneity remaining high for this group (I² = 79%). See Analysis 5.1.
2. Different types of nerve blocks
We performed subgroup analysis according to the type of nerve block and block approach. For 'Time to perform block' results remained statistically significant and with a high level of heterogeneity in the axillary and infraclavicular brachial plexus block, but for those studies which used the popliteal fossa sciatic block there was no difference in the time to perform the block between ultrasound and nerve stimulation use (MD, IV, fixed‐effect ‐1.00 (95% CI ‐2.43 to 0.44), I² = 0%). However there were only two studies using this block in this analysis (see Analysis 3.2). For those studies combining ultrasound with peripheral nerve stimulation, there were only single studies in the nerve block approaches other than for axillary plexus block, and for this there was no difference in the result and I² remained similarly high (see Analysis 4.1).
For the outcome 'Paraesthesia', subgroup analysis showed that for the infraclavicular brachial plexus block there were still significantly fewer events of paraesthesia with ultrasound use, although statistical heterogeneity remained high (I² = 87%). But for the axillary brachial plexus block there was no longer any statistical difference between block technique, with only moderate heterogeneity (I² = 40%). See Analysis 5.2.
3. Studies with catheter placement
Three of our studies (Danelli 2012; Dhir 2008; Salem 2012) had included catheter placement as part of the nerve block procedure and whilst we had included Dhir 2008 and Salem 2012 in the main analysis which had a low I² value, we separated Salem 2012 from the 'Time to perform block' outcome. This outcome remained statistically significantly in favour of the control. See Analysis 4.2.
4. Experience of practitioners
Although experience of practitioners is an important consideration for this review, we did not perform subgroup analysis. Several studies did not provide details on experience, and for those that did it was often unclear whether the experience was equivalent between techniques. Subgroup analysis would not have provided a reliable result.
5. Other heterogeneity
It is likely that heterogeneity for the outcome of 'Time to perform block' may be as a result of the variety of definitions used by study authors for this outcome measure. However, these outcomes varied such that it was not feasible to perform subgroup analysis and provide a reliable result.
Sensitivity analysis
In sensitivity analysis, we considered the effect of bias on our primary outcome only.
We removed those studies that had not reported clearly on their methods of sequence generation (Macaire 2008; Taboada 2009; Trabelsi 2013; Van Geffen 2009; Zaragoza‐Lemus 2012) and this did not affect the results. As it was feasible for outcomes to be assessed by blinded observers, we removed those studies that we had judged as being at either unclear or high risk of bias for this domain (Chan 2007; Geiser 2011; Kapral 2008; Macaire 2008; Renes 2009; Taboada 2009; Van Geffen 2009; Zaragoza‐Lemus 2012) and again this did not affect the results.
We similarly removed studies at high or unclear risk of attrition bias (Brull 2009; Chan 2007), with no difference to meta‐analysis results.
We had reported on whether studies had received any funding assistance and for sensitivity analysis removed those studies that we had assessed as being at high risk of bias due to the supplying of study equipment (Brull 2009; Chan 2007; Gurkan 2008; Sites 2006; Van Geffen 2009). For Analysis 1.1, we removed Brull 2009, Chan 2007, Sites 2006 and Van Geffen 2009, and for Analysis 2.1, we removed Gurkan 2008. This did not make any difference to our statistically significant result in favour of ultrasound.
In sensitivity analysis, we chose to remove those studies which we had judged as having a high risk of bias for practitioner experience (Cataldo 2012; Chan 2007; Dufour 2008; Sites 2006; Strub 2011; Van Geffen 2009; Williams 2003).This did not make any difference to our results in favour of ultrasound guidance for success of the block.
Discussion
Summary of main results
As we had changed the eligibility criteria in the 2014 update, resulting in the exclusion of several studies, we felt that the included studies were now more homogeneous and that it was appropriate to combine the results of our data with meta‐analysis.
This review, based on 32 studies in 2844 adult participants, has found that ultrasound guidance produces superior peripheral nerve block success rates, with more blocks being assessed as complete or sufficient for surgery following sensory or motor testing, and fewer blocks requiring supplementation or conversion to general anaesthetic compared with the use of nerve stimulation, anatomical landmark techniques or transarterial approach. This result was similarly advantageous for studies that compared ultrasound, either alone or combined with nerve stimulation, against nerve stimulation. Results suggest that there are fewer incidences of paraesthesia and vascular puncture when using ultrasound approaches, and the review authors' interpretation of other results also suggests a reduction in complications such as nerve damage.
The evidence in this review, both using meta‐analysis and interpretation of individual authors' results, also suggests that it takes less time to perform the block when using ultrasound techniques alone rather than nerve stimulation. As expected, it takes longer to perform the block when nerve stimulation is used as an additional technique combined with ultrasound than when nerve stimulation is used alone. The results for analysis of this outcome had moderate to high levels of heterogeneity.
The performance of peripheral nerve blocks is clearly dependent on experience and expertise of the practitioner and we were concerned about the influence of this bias on the results. Our subgroup analysis, removing studies which we had judged as being at high level of risk of bias for this outcome, remained consistent with the main analysis that ultrasound‐guided techniques require less time to perform.
Overall completeness and applicability of evidence
We carried out a thorough search, both in the original review (Walker 2009) and in the 2014 update, using appropriate electronic databases. We also included backward and forward citation tracking and details of studies posted on clinical trials registers. Where necessary, we made attempts to contact authors for additional study details. Despite narrowing our eligibility criteria for this update, we were still able to identify 32 relevant studies that met our eligibility criteria for participant and interventions.
Studies included a variety of nerve blocks for procedures of the upper and lower limbs, including different approaches to the brachial plexus block and the sciatic and popliteal fossa nerves. Whilst we did not restrict the comparison to a particular nerve block technique, the majority of included studies compared ultrasound against nerve stimulation, with only two studies comparing against anatomical landmark technique and one comparing against a transarterial approach. With so few studies comparing against anatomical landmark technique or transarterial approach, we are not able to reliably rate the applicability of these findings against these two comparisons.
Results of our review are applicable to peripheral nerve blocks of the upper and lower limbs for which peripheral nerve block is the intended sole anaesthetic, as we had excluded studies of other blocks.
Quality of the evidence
The methodological quality of the trials was moderate, at best. Details of methods of randomization, allocation concealment and blinding of outcome assessors were inconsistent across studies and it is unclear whether this was due to a failure by authors to report study details or to a lack of methodological rigour.
We accepted that it was not possible to blind the anaesthetist and this inevitably skewed our 'Risk of bias' assessment as all studies were at an increased risk of performance bias. Another important aspect of performance bias for this review was the likelihood of varying experience of the practitioners and their attitude towards ultrasound or alternative techniques. It is possible that those 12 studies (Bloc 2010; Brull 2009; Casati 2007a; Danelli 2012; Kapral 2008; Meierhofer 2014; Morros 2009; Perlas 2008; Salem 2012; Sauter 2008; Soeding 2005; Taboada 2009) which described their practitioners as 'experienced' had used personnel who were ultrasound enthusiasts, with considerable experience in ultrasound. Equally, studies may have used personnel with considerably less experience in ultrasound. Unfortunately without this information we were unable to explore this further and do not know whether our results could be applicable to experienced ultrasound users only.
Whilst our results were consistent during sensitivity analysis, we did not feel able to grade the quality of evidence as high for any outcomes, and subsequently graded our results as moderate, low or very low quality.
Potential biases in the review process
Our decision to restrict the eligibility criteria in the 2014 update meant that we excluded several of the original studies (Casati 2007a; Danelli 2009a; Dolan 2008; Marhofer 1997; Marhofer 1998), as well as additional studies that would have been included in our latest search. Whilst this restriction could have introduced bias into the results, we felt that it reduced the heterogeneity between studies and allowed meta‐analysis that previously had not been possible.
In the original review (Walker 2009) the authors had made attempts to contact known authors in the research field, as well as conducting handsearches of journals. We did not replicate this level of searching in the 2014 update and, whilst our searches ultimately identified 32 included studies, we do not know whether we would have identified further eligible studies had we searched to this extent.
We reran the search in May 2015 and found seven studies of interest. We added them to the list of 'Studies awaiting classification' and will incorporate them into the next review update.
Agreements and disagreements with other studies or reviews
In the original review, we had concluded that there was limited evidence to support the routine use of ultrasound for peripheral nerve blocks. However, our evidence as a result of further included studies and meta‐analyses in this update demonstrate the benefits in the use of ultrasound guidance over other techniques. This is consistent with other reviews in the field (Gelfand 2010; Liu 2009b) which support the use of ultrasound for peripheral nerve blocks with improved block success and fewer adverse events.

Study flow diagram.

Methodological quality graph: review authors' judgements about each methodological quality item presented as percentages across all included studies.

Methodological quality summary: review authors' judgements about each methodological quality item for each included study.

Funnel plot of comparison: 1 Ultrasound technique versus other technique, outcome: 1.1 Predicted adequacy of block.
Comparison 1 Ultrasound technique versus other technique, Outcome 1 Predicted adequacy of block.

Comparison 1 Ultrasound technique versus other technique, Outcome 2 Supplementation of block.

Comparison 1 Ultrasound technique versus other technique, Outcome 3 Time to perform block.
Comparison 1 Ultrasound technique versus other technique, Outcome 4 Paraesthesia.

Comparison 1 Ultrasound technique versus other technique, Outcome 5 Vascular puncture.

Comparison 2 Ultrasound with nerve stimulation versus nerve stimulation, Outcome 1 Predicted adequacy of block.
Comparison 2 Ultrasound with nerve stimulation versus nerve stimulation, Outcome 2 Supplementation of block.
Comparison 2 Ultrasound with nerve stimulation versus nerve stimulation, Outcome 3 Time to perform block.

Comparison 2 Ultrasound with nerve stimulation versus nerve stimulation, Outcome 4 Paraesthesia.

Comparison 2 Ultrasound with nerve stimulation versus nerve stimulation, Outcome 5 Vascular puncture.

Comparison 3 Time to perform block by subgroups US vs other, Outcome 1 By type of intervention/comparison.

Comparison 3 Time to perform block by subgroups US vs other, Outcome 2 By type of nerve block/approach.

Comparison 4 Time to perform block by subgroups US + PNS vs PNS, Outcome 1 By type of nerve block/approach.

Comparison 4 Time to perform block by subgroups US + PNS vs PNS, Outcome 2 By catheter/no catheter placement.

Comparison 5 Paraesthesia by subgroups, Outcome 1 By type of intervention/comparison.
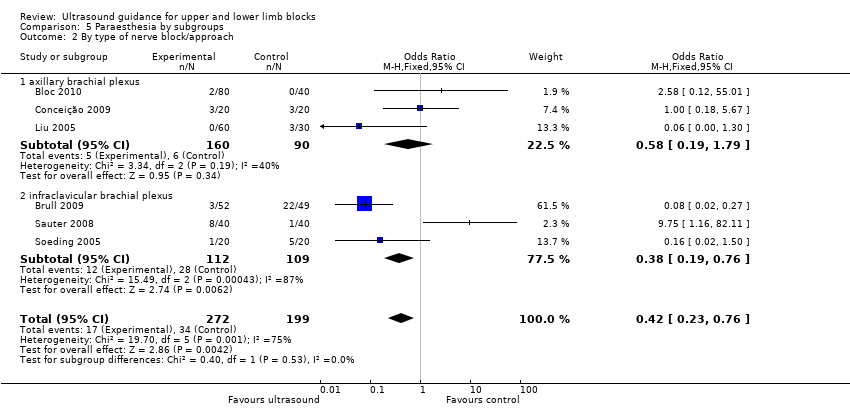
Comparison 5 Paraesthesia by subgroups, Outcome 2 By type of nerve block/approach.
| Ultrasound guidance for upper and lower limb blocks | ||||||
| Patient or population: People undergoing upper and lower limb blocks | ||||||
| Outcomes | Illustrative comparative risks* (95% CI) | Relative effect | No of Participants | Quality of the evidence | Comments | |
| Assumed risk | Corresponding risk | |||||
| Control | Ultrasound guidance | |||||
| Block success (predicted adequacy of block) | Study population | OR 2.49 (2.14 to 4.04) | 1346 | ⊕⊕⊕⊝ | ||
| 791 per 1000 | 902 per 1000 | |||||
| Moderate | ||||||
| Block success (supplementation or conversion to general anaesthesia | Study population | OR 0.28 (0.20 to 0.39) | 1807 | ⊕⊕⊕⊝ | ||
| 185 per 1000 | 73 per 1000 | |||||
| Moderate | ||||||
| Paraesthesia | Study population | OR 0.42 (0.23 to 0.76) | 471 | ⊕⊝⊝⊝ | ||
| 171 per 1000 | 80 per 1000 | |||||
| Moderate | ||||||
| Vascular puncture | Study population | OR 0.19 (0.07 to 0.57) | 387 | ⊕⊕⊝⊝ | ||
| 93 per 1000 | 20 per 1000 | |||||
| Moderate | ||||||
| Time to perform block | The mean time to perform block in the intervention groups was | 690 | ⊕⊝⊝⊝ | |||
| Number of attempts9 | See comment | See comment | Not estimable9 | 0 | ⊕⊕⊝⊝ | |
| Patient discomfort9 | See comment | See comment | Not estimable9 | 0 | ⊕⊕⊝⊝ | |
| *The basis for the assumed risk (e.g. the median control group risk across studies) is provided in footnotes. The corresponding risk (and its 95% confidence interval) is based on the assumed risk in the comparison group and the relative effect of the intervention (and its 95% CI). | ||||||
| GRADE Working Group grades of evidence | ||||||
| 1Unavoidable performance bias due to lack of blinding but does not appear to affect results. Not possible to fully explore potential for operator bias according to preference and/or experience of devices | ||||||
| Outcome or subgroup title | No. of studies | No. of participants | Statistical method | Effect size |
| 1 Predicted adequacy of block Show forest plot | 17 | 1346 | Peto Odds Ratio (Peto, Fixed, 95% CI) | 2.94 [2.14, 4.04] |
| 1.1 Ultrasound versus nerve stimulation | 15 | 1250 | Peto Odds Ratio (Peto, Fixed, 95% CI) | 2.91 [2.08, 4.06] |
| 1.2 Ultrasound versus anatomical landmark technique | 1 | 40 | Peto Odds Ratio (Peto, Fixed, 95% CI) | 2.02 [0.20, 20.62] |
| 1.3 Ultrasound versus transarterial approach | 1 | 56 | Peto Odds Ratio (Peto, Fixed, 95% CI) | 3.62 [1.19, 11.00] |
| 2 Supplementation of block Show forest plot | 18 | 1807 | Odds Ratio (M‐H, Fixed, 95% CI) | 0.28 [0.20, 0.39] |
| 2.1 ultrasound versus nerve stimulation | 15 | 1570 | Odds Ratio (M‐H, Fixed, 95% CI) | 0.31 [0.21, 0.46] |
| 2.2 ultrasound versus anatomical landmark technique | 2 | 181 | Odds Ratio (M‐H, Fixed, 95% CI) | 0.21 [0.11, 0.44] |
| 2.3 ultrasound versus transarterial approach | 1 | 56 | Odds Ratio (M‐H, Fixed, 95% CI) | 0.25 [0.07, 0.85] |
| 3 Time to perform block Show forest plot | 10 | 690 | Mean Difference (IV, Fixed, 95% CI) | ‐1.06 [‐1.41, ‐0.72] |
| 4 Paraesthesia Show forest plot | 6 | 471 | Odds Ratio (M‐H, Fixed, 95% CI) | 0.42 [0.23, 0.76] |
| 5 Vascular puncture Show forest plot | 5 | 387 | Odds Ratio (M‐H, Fixed, 95% CI) | 0.19 [0.07, 0.57] |
| Outcome or subgroup title | No. of studies | No. of participants | Statistical method | Effect size |
| 1 Predicted adequacy of block Show forest plot | 9 | 719 | Odds Ratio (M‐H, Fixed, 95% CI) | 3.33 [2.13, 5.20] |
| 2 Supplementation of block Show forest plot | 9 | 712 | Odds Ratio (M‐H, Fixed, 95% CI) | 0.34 [0.21, 0.56] |
| 3 Time to perform block Show forest plot | 7 | 587 | Mean Difference (IV, Fixed, 95% CI) | 0.76 [0.55, 0.98] |
| 4 Paraesthesia Show forest plot | 3 | 178 | Odds Ratio (M‐H, Fixed, 95% CI) | 0.97 [0.30, 3.12] |
| 5 Vascular puncture Show forest plot | 2 | 143 | Odds Ratio (M‐H, Fixed, 95% CI) | 0.22 [0.05, 0.90] |
| Outcome or subgroup title | No. of studies | No. of participants | Statistical method | Effect size |
| 1 By type of intervention/comparison Show forest plot | 10 | 690 | Mean Difference (IV, Fixed, 95% CI) | ‐1.06 [‐1.41, ‐0.72] |
| 1.1 nerve stimulation | 9 | 634 | Mean Difference (IV, Fixed, 95% CI) | ‐1.02 [‐1.37, ‐0.67] |
| 1.2 transarterial approach | 1 | 56 | Mean Difference (IV, Fixed, 95% CI) | ‐3.20 [‐5.76, ‐0.64] |
| 2 By type of nerve block/approach Show forest plot | 10 | 690 | Mean Difference (IV, Fixed, 95% CI) | ‐1.06 [‐1.41, ‐0.72] |
| 2.1 axillary brachial plexus | 6 | 452 | Mean Difference (IV, Fixed, 95% CI) | ‐0.56 [‐0.98, ‐0.14] |
| 2.2 infraclavicular brachial plexus | 2 | 130 | Mean Difference (IV, Fixed, 95% CI) | ‐2.41 [‐3.10, ‐1.72] |
| 2.3 popliteal fossa sciatic | 2 | 108 | Mean Difference (IV, Fixed, 95% CI) | 1.00 [‐2.43, 0.44] |
| Outcome or subgroup title | No. of studies | No. of participants | Statistical method | Effect size |
| 1 By type of nerve block/approach Show forest plot | 7 | 587 | Mean Difference (IV, Fixed, 95% CI) | 0.76 [0.55, 0.98] |
| 1.1 Axillary brachial plexus block | 4 | 396 | Mean Difference (IV, Fixed, 95% CI) | 0.85 [0.62, 1.07] |
| 1.2 Interscalene brachial plexus | 1 | 60 | Mean Difference (IV, Fixed, 95% CI) | ‐0.6 [‐2.12, 0.92] |
| 1.3 Supraclavicular brachial plexus | 1 | 80 | Mean Difference (IV, Fixed, 95% CI) | ‐4.80 [‐7.24, ‐2.36] |
| 1.4 Popliteal fossa sciatic | 1 | 51 | Mean Difference (IV, Fixed, 95% CI) | 0.71 [‐0.07, 1.49] |
| 2 By catheter/no catheter placement Show forest plot | 7 | 587 | Mean Difference (IV, Fixed, 95% CI) | 0.76 [0.55, 0.98] |
| 2.1 No catheter use | 6 | 527 | Mean Difference (IV, Fixed, 95% CI) | 0.79 [0.57, 1.01] |
| 2.2 Catheter placement | 1 | 60 | Mean Difference (IV, Fixed, 95% CI) | ‐0.6 [‐2.12, 0.92] |
| Outcome or subgroup title | No. of studies | No. of participants | Statistical method | Effect size |
| 1 By type of intervention/comparison Show forest plot | 6 | 471 | Odds Ratio (M‐H, Fixed, 95% CI) | 0.42 [0.23, 0.76] |
| 1.1 peripheral nerve stimulation | 5 | 431 | Odds Ratio (M‐H, Fixed, 95% CI) | 0.46 [0.25, 0.86] |
| 1.2 landmark technique | 1 | 40 | Odds Ratio (M‐H, Fixed, 95% CI) | 0.16 [0.02, 1.50] |
| 2 By type of nerve block/approach Show forest plot | 6 | 471 | Odds Ratio (M‐H, Fixed, 95% CI) | 0.42 [0.23, 0.76] |
| 2.1 axillary brachial plexus | 3 | 250 | Odds Ratio (M‐H, Fixed, 95% CI) | 0.58 [0.19, 1.79] |
| 2.2 infraclavicular brachial plexus | 3 | 221 | Odds Ratio (M‐H, Fixed, 95% CI) | 0.38 [0.19, 0.76] |