Ultrasound guidance for upper and lower limb blocks
Information
- DOI:
- https://doi.org/10.1002/14651858.CD006459.pub3Copy DOI

- Database:
-
- Cochrane Database of Systematic Reviews
- Version published:
-
- 11 September 2015see what's new
- Type:
-
- Intervention
- Stage:
-
- Review
- Cochrane Editorial Group:
-
Cochrane Anaesthesia Group
- Copyright:
-
- Copyright © 2015 The Cochrane Collaboration. Published by John Wiley & Sons, Ltd.
Article metrics
Altmetric:
Cited by:
Authors
Contributions of authors
2014 updated review authors: Sharon R Lewis (SL), Anastasia Price (AP)a, Kevin J Walker (KJW), Ken McGrattan (KMcG), Andrew F Smith (AFS).
Conceiving the review: AFS
Co‐ordinating the review: SL
Undertaking manual searches: SL
Screening search results: SL, KMcG, KJW, AFS
Organizing retrieval of papers: SL
Screening retrieved papers against inclusion criteria: SL, KMcG, KJW, AFS
Appraising quality of papers: SL, KJW, AP, AFS
Abstracting data from papers: SL,KJW, AP, AFS
Data management for the review: SL
Entering data into Review Manager (RevMan 5.3): SL, AP
Analysis of data: SL, AFS
Interpretation of data: SL, AFS
Writing the review: SL, AP
Guarantor for the review (one author): AFS
aAnastasia Price died before publication of the review (December 2014). Her contribution was complete as listed above.
Sources of support
Internal sources
-
No internal sources of support., UK.
External sources
-
NIHR Cochrane Collaboration Programme Grant: Enhancing the safety, quality and productivity of perioperative care. Project Ref: 10/4001/04, UK., UK.
This grant funds the work of SRL and AFS for this review
Declarations of interest
Sharon R Lewis: none known
Anastasia Price: deceased; no declarations of interest available
Kevin J Walker: none known
Ken McGrattan: none known
Andrew F Smith: none known
Acknowledgements
Anastasia Price died before publication of this review and we would like to acknowledge the significant contribution she made to this update. Her work was always comprehensive, incisive and much appreciated.
We would also like to acknowledge the contribution of Kristine Aas‐Eng to the original review (Walker 2007; Walker 2009).
We would like to thank Dr Mathew Zacharias (content editor), Dr Marialena Trivella (statistical editor), Dr Giorgio Danelli, Dr Vincent Chan (peer reviewers) and Sandra Oliveira (Cochrane Consumer Network) for their help and editorial advice during the preparation of the review (Walker 2009). We also thank Dr McCartney, Dr Dhir, Dr Marhofer and Dr Danelli for additional information provided in the original review (Walker 2009).
We would also like to thank Dr Mathew Zacharias, Dr Geert Jan van Geffen, Dr Andrea Casati and Kathie Godfrey for their help and editorial advice during the preparation of the protocol for the review (Walker 2007).
Version history
| Published | Title | Stage | Authors | Version |
| 2015 Sep 11 | Ultrasound guidance for upper and lower limb blocks | Review | Sharon R Lewis, Anastasia Price, Kevin J Walker, Ken McGrattan, Andrew F Smith | |
| 2009 Oct 07 | Ultrasound guidance for peripheral nerve blockade | Review | Kevin J Walker, Ken McGrattan, Kristine Aas‐Eng, Andrew F Smith | |
| 2009 Jul 08 | Ultrasound guidance for peripheral nerve blockade | Protocol | Kevin J Walker, Ken McGrattan, Kristine Aas‐Eng, Andrew F. Smith | |
Differences between protocol and review
Differences between review (Walker 2009) and current update.
New authors, Sharon R Lewis and Anastasia Price, contributed to the 2014 update whilst Kristine Aas‐Eng decided not to contribute and was therefore removed from the author list.
In the 2014 update we excluded studies that had given general, spinal or epidural anaesthetic, or additional nerve blocks as part of standard care in addition to the peripheral nerve block under investigation. We also excluded studies that were designed to assess anaesthetic drug volume. As a result of these changes, we excluded some studies which had been included in the original review.
In the 2014 update we altered the review outcomes. The primary outcome of block success was divided into two outcomes to distinguish between the assessments used to define block success, i.e. predicted adequacy of the block with the use of motor or sensory testing, and the assessment of whether surgical anaesthesia had been achieved without the need for supplementary anaesthesia or conversion to general anaesthesia. We adapted the complications outcome to include all complications. We did not include studies that specifically assessed the volume of anaesthetic given during nerve blocks, as outcome data from these studies could not adequately measure our primary outcome. We took an a priori decision to only include limb blocks in the review.
In the 2014 update we expanded the Methods section to include headings: Unit of analysis issues; Dealing with missing data; Assessment of heterogeneity; Assessment of reporting biases; Data synthesis; Subgroup analysis and investigation of heterogeneity; and Sensitivity analysis. We also included a 'Summary of findings' table and incorporated this into the results.
Notes
We have altered the title from the original review (see Walker 2009) to reflect the more specific peripheral blocks included in this 2014 update.
Keywords
MeSH
Medical Subject Headings (MeSH) Keywords
Medical Subject Headings Check Words
Adult; Humans;
PICOs


Methodological quality graph: review authors' judgements about each methodological quality item presented as percentages across all included studies.

Methodological quality summary: review authors' judgements about each methodological quality item for each included study.
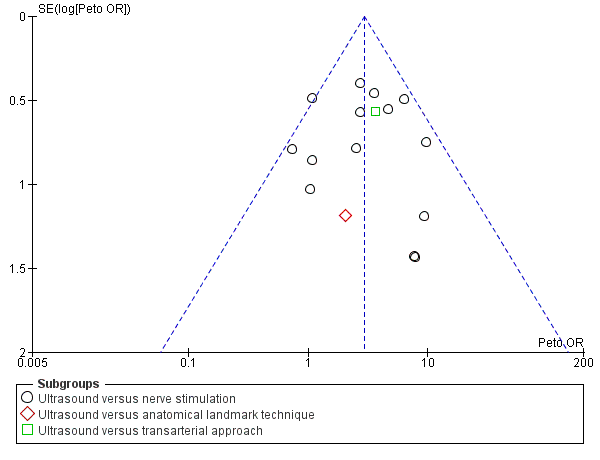
Funnel plot of comparison: 1 Ultrasound technique versus other technique, outcome: 1.1 Predicted adequacy of block.

Comparison 1 Ultrasound technique versus other technique, Outcome 1 Predicted adequacy of block.

Comparison 1 Ultrasound technique versus other technique, Outcome 2 Supplementation of block.

Comparison 1 Ultrasound technique versus other technique, Outcome 3 Time to perform block.

Comparison 1 Ultrasound technique versus other technique, Outcome 4 Paraesthesia.

Comparison 1 Ultrasound technique versus other technique, Outcome 5 Vascular puncture.

Comparison 2 Ultrasound with nerve stimulation versus nerve stimulation, Outcome 1 Predicted adequacy of block.

Comparison 2 Ultrasound with nerve stimulation versus nerve stimulation, Outcome 2 Supplementation of block.

Comparison 2 Ultrasound with nerve stimulation versus nerve stimulation, Outcome 3 Time to perform block.

Comparison 2 Ultrasound with nerve stimulation versus nerve stimulation, Outcome 4 Paraesthesia.

Comparison 2 Ultrasound with nerve stimulation versus nerve stimulation, Outcome 5 Vascular puncture.

Comparison 3 Time to perform block by subgroups US vs other, Outcome 1 By type of intervention/comparison.

Comparison 3 Time to perform block by subgroups US vs other, Outcome 2 By type of nerve block/approach.

Comparison 4 Time to perform block by subgroups US + PNS vs PNS, Outcome 1 By type of nerve block/approach.

Comparison 4 Time to perform block by subgroups US + PNS vs PNS, Outcome 2 By catheter/no catheter placement.

Comparison 5 Paraesthesia by subgroups, Outcome 1 By type of intervention/comparison.

Comparison 5 Paraesthesia by subgroups, Outcome 2 By type of nerve block/approach.
| Ultrasound guidance for upper and lower limb blocks | ||||||
| Patient or population: People undergoing upper and lower limb blocks | ||||||
| Outcomes | Illustrative comparative risks* (95% CI) | Relative effect | No of Participants | Quality of the evidence | Comments | |
| Assumed risk | Corresponding risk | |||||
| Control | Ultrasound guidance | |||||
| Block success (predicted adequacy of block) | Study population | OR 2.49 (2.14 to 4.04) | 1346 | ⊕⊕⊕⊝ | ||
| 791 per 1000 | 902 per 1000 | |||||
| Moderate | ||||||
| Block success (supplementation or conversion to general anaesthesia | Study population | OR 0.28 (0.20 to 0.39) | 1807 | ⊕⊕⊕⊝ | ||
| 185 per 1000 | 73 per 1000 | |||||
| Moderate | ||||||
| Paraesthesia | Study population | OR 0.42 (0.23 to 0.76) | 471 | ⊕⊝⊝⊝ | ||
| 171 per 1000 | 80 per 1000 | |||||
| Moderate | ||||||
| Vascular puncture | Study population | OR 0.19 (0.07 to 0.57) | 387 | ⊕⊕⊝⊝ | ||
| 93 per 1000 | 20 per 1000 | |||||
| Moderate | ||||||
| Time to perform block | The mean time to perform block in the intervention groups was | 690 | ⊕⊝⊝⊝ | |||
| Number of attempts9 | See comment | See comment | Not estimable9 | 0 | ⊕⊕⊝⊝ | |
| Patient discomfort9 | See comment | See comment | Not estimable9 | 0 | ⊕⊕⊝⊝ | |
| *The basis for the assumed risk (e.g. the median control group risk across studies) is provided in footnotes. The corresponding risk (and its 95% confidence interval) is based on the assumed risk in the comparison group and the relative effect of the intervention (and its 95% CI). | ||||||
| GRADE Working Group grades of evidence | ||||||
| 1Unavoidable performance bias due to lack of blinding but does not appear to affect results. Not possible to fully explore potential for operator bias according to preference and/or experience of devices | ||||||
| Outcome or subgroup title | No. of studies | No. of participants | Statistical method | Effect size |
| 1 Predicted adequacy of block Show forest plot | 17 | 1346 | Peto Odds Ratio (Peto, Fixed, 95% CI) | 2.94 [2.14, 4.04] |
| 1.1 Ultrasound versus nerve stimulation | 15 | 1250 | Peto Odds Ratio (Peto, Fixed, 95% CI) | 2.91 [2.08, 4.06] |
| 1.2 Ultrasound versus anatomical landmark technique | 1 | 40 | Peto Odds Ratio (Peto, Fixed, 95% CI) | 2.02 [0.20, 20.62] |
| 1.3 Ultrasound versus transarterial approach | 1 | 56 | Peto Odds Ratio (Peto, Fixed, 95% CI) | 3.62 [1.19, 11.00] |
| 2 Supplementation of block Show forest plot | 18 | 1807 | Odds Ratio (M‐H, Fixed, 95% CI) | 0.28 [0.20, 0.39] |
| 2.1 ultrasound versus nerve stimulation | 15 | 1570 | Odds Ratio (M‐H, Fixed, 95% CI) | 0.31 [0.21, 0.46] |
| 2.2 ultrasound versus anatomical landmark technique | 2 | 181 | Odds Ratio (M‐H, Fixed, 95% CI) | 0.21 [0.11, 0.44] |
| 2.3 ultrasound versus transarterial approach | 1 | 56 | Odds Ratio (M‐H, Fixed, 95% CI) | 0.25 [0.07, 0.85] |
| 3 Time to perform block Show forest plot | 10 | 690 | Mean Difference (IV, Fixed, 95% CI) | ‐1.06 [‐1.41, ‐0.72] |
| 4 Paraesthesia Show forest plot | 6 | 471 | Odds Ratio (M‐H, Fixed, 95% CI) | 0.42 [0.23, 0.76] |
| 5 Vascular puncture Show forest plot | 5 | 387 | Odds Ratio (M‐H, Fixed, 95% CI) | 0.19 [0.07, 0.57] |
| Outcome or subgroup title | No. of studies | No. of participants | Statistical method | Effect size |
| 1 Predicted adequacy of block Show forest plot | 9 | 719 | Odds Ratio (M‐H, Fixed, 95% CI) | 3.33 [2.13, 5.20] |
| 2 Supplementation of block Show forest plot | 9 | 712 | Odds Ratio (M‐H, Fixed, 95% CI) | 0.34 [0.21, 0.56] |
| 3 Time to perform block Show forest plot | 7 | 587 | Mean Difference (IV, Fixed, 95% CI) | 0.76 [0.55, 0.98] |
| 4 Paraesthesia Show forest plot | 3 | 178 | Odds Ratio (M‐H, Fixed, 95% CI) | 0.97 [0.30, 3.12] |
| 5 Vascular puncture Show forest plot | 2 | 143 | Odds Ratio (M‐H, Fixed, 95% CI) | 0.22 [0.05, 0.90] |
| Outcome or subgroup title | No. of studies | No. of participants | Statistical method | Effect size |
| 1 By type of intervention/comparison Show forest plot | 10 | 690 | Mean Difference (IV, Fixed, 95% CI) | ‐1.06 [‐1.41, ‐0.72] |
| 1.1 nerve stimulation | 9 | 634 | Mean Difference (IV, Fixed, 95% CI) | ‐1.02 [‐1.37, ‐0.67] |
| 1.2 transarterial approach | 1 | 56 | Mean Difference (IV, Fixed, 95% CI) | ‐3.20 [‐5.76, ‐0.64] |
| 2 By type of nerve block/approach Show forest plot | 10 | 690 | Mean Difference (IV, Fixed, 95% CI) | ‐1.06 [‐1.41, ‐0.72] |
| 2.1 axillary brachial plexus | 6 | 452 | Mean Difference (IV, Fixed, 95% CI) | ‐0.56 [‐0.98, ‐0.14] |
| 2.2 infraclavicular brachial plexus | 2 | 130 | Mean Difference (IV, Fixed, 95% CI) | ‐2.41 [‐3.10, ‐1.72] |
| 2.3 popliteal fossa sciatic | 2 | 108 | Mean Difference (IV, Fixed, 95% CI) | 1.00 [‐2.43, 0.44] |
| Outcome or subgroup title | No. of studies | No. of participants | Statistical method | Effect size |
| 1 By type of nerve block/approach Show forest plot | 7 | 587 | Mean Difference (IV, Fixed, 95% CI) | 0.76 [0.55, 0.98] |
| 1.1 Axillary brachial plexus block | 4 | 396 | Mean Difference (IV, Fixed, 95% CI) | 0.85 [0.62, 1.07] |
| 1.2 Interscalene brachial plexus | 1 | 60 | Mean Difference (IV, Fixed, 95% CI) | ‐0.6 [‐2.12, 0.92] |
| 1.3 Supraclavicular brachial plexus | 1 | 80 | Mean Difference (IV, Fixed, 95% CI) | ‐4.80 [‐7.24, ‐2.36] |
| 1.4 Popliteal fossa sciatic | 1 | 51 | Mean Difference (IV, Fixed, 95% CI) | 0.71 [‐0.07, 1.49] |
| 2 By catheter/no catheter placement Show forest plot | 7 | 587 | Mean Difference (IV, Fixed, 95% CI) | 0.76 [0.55, 0.98] |
| 2.1 No catheter use | 6 | 527 | Mean Difference (IV, Fixed, 95% CI) | 0.79 [0.57, 1.01] |
| 2.2 Catheter placement | 1 | 60 | Mean Difference (IV, Fixed, 95% CI) | ‐0.6 [‐2.12, 0.92] |
| Outcome or subgroup title | No. of studies | No. of participants | Statistical method | Effect size |
| 1 By type of intervention/comparison Show forest plot | 6 | 471 | Odds Ratio (M‐H, Fixed, 95% CI) | 0.42 [0.23, 0.76] |
| 1.1 peripheral nerve stimulation | 5 | 431 | Odds Ratio (M‐H, Fixed, 95% CI) | 0.46 [0.25, 0.86] |
| 1.2 landmark technique | 1 | 40 | Odds Ratio (M‐H, Fixed, 95% CI) | 0.16 [0.02, 1.50] |
| 2 By type of nerve block/approach Show forest plot | 6 | 471 | Odds Ratio (M‐H, Fixed, 95% CI) | 0.42 [0.23, 0.76] |
| 2.1 axillary brachial plexus | 3 | 250 | Odds Ratio (M‐H, Fixed, 95% CI) | 0.58 [0.19, 1.79] |
| 2.2 infraclavicular brachial plexus | 3 | 221 | Odds Ratio (M‐H, Fixed, 95% CI) | 0.38 [0.19, 0.76] |