| Outcome | HVE vs PTC | Chen 2006 | PTC:Total vs Select | PTC:Tot vs Sel‐Major | PTC:Tot vs Sel‐Cirrh | PTC:Cont vs Inter | PTC:Cont vs Inter‐Ci | IPTC:30min vs 15 min |
| ABBREVIATIONS | HVE = Hepatic vascular exclusion
PTC = Portal triad clamping | ‐ | PTC ‐ inflow occlusion | Tot = Total
Sel = Selective
Major = Major liver resections | Cirrh = Cirrhotic livers | Cont ‐ continuous
Int ‐ intermittent | Ci ‐ Cirrhotic livers | IPTC ‐ intermiitent portal triad clamping |
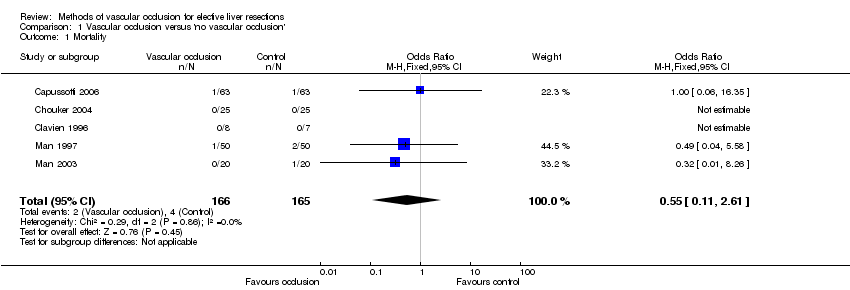
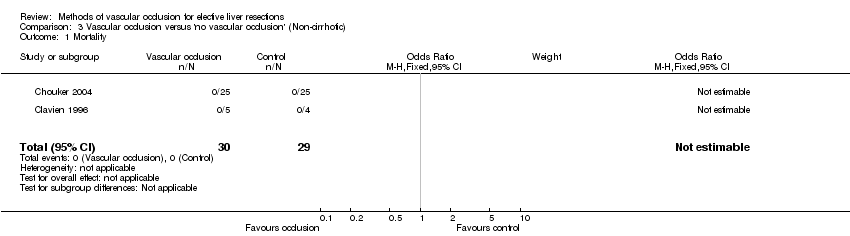
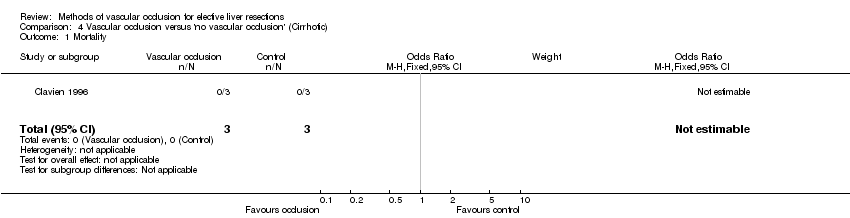
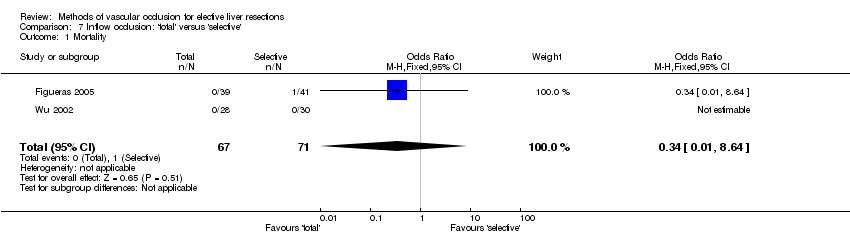
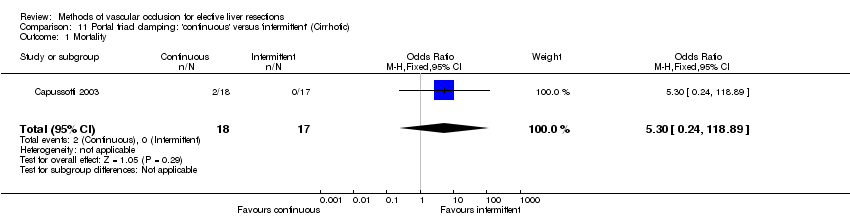
| MORTALITY | 0.30 [0.03, 2.91]
(n = 170) | Included in meta‐analysis | 0.34 [0.01, 8.64]
(n = 138) | 0.34 [0.01, 8.64]
(n = 80) | Not estimable
(n = 58) | 5.40 [0.61, 47.93]
(n = 121) | 5.30 [0.24, 118.89]
(n = 35) | 0 vs 0
(n = 92) |
| MORBIDITY | | | | | | | | |
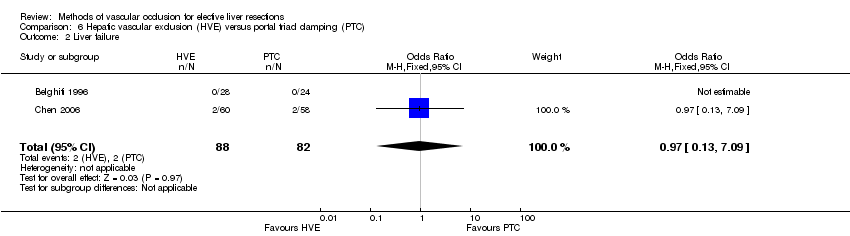
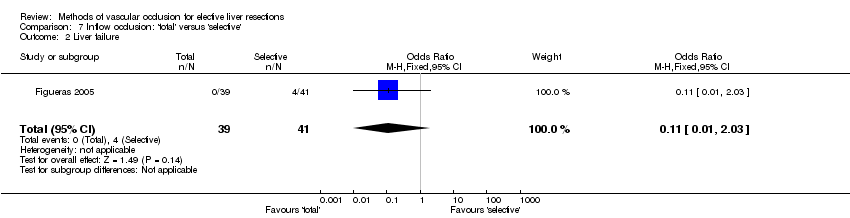
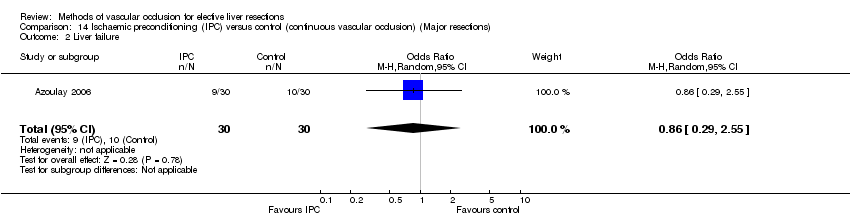
| Liver failure | 0.97 [0.13, 7.09]
(n = 170) | Included in meta‐analysis | 0.11 [0.01, 2.03]
(n = 80) | 0.11 [0.01, 2.03]
(n = 80) | ‐ | 10.40 [0.54, 199.43]
(n = 86) | ‐ | ‐ |
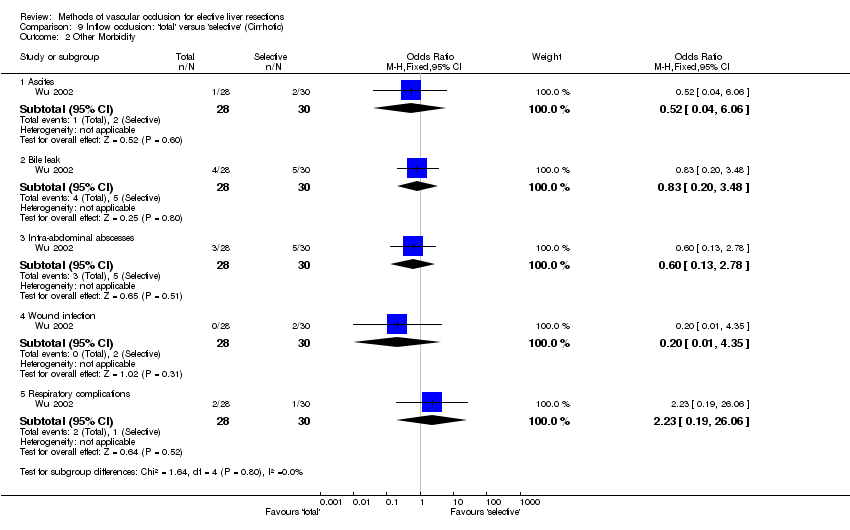
| Ascites | ‐ | ‐ | 0.68 [0.18, 2.55]
(n = 138) | 0.77 [0.16, 3.69]
(n = 80) | 0.52 [0.04, 6.06]
(n = 58) | ‐ | ‐ | ‐ |
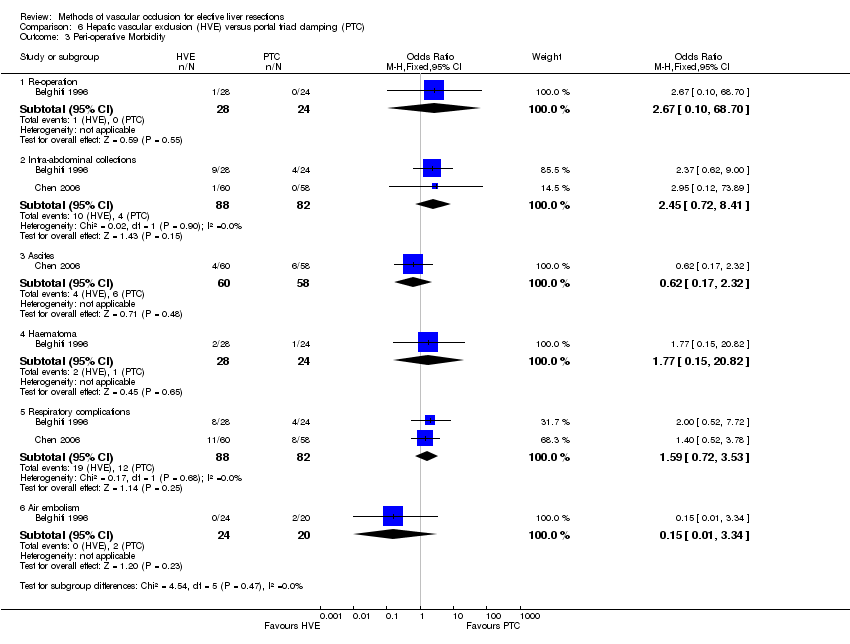
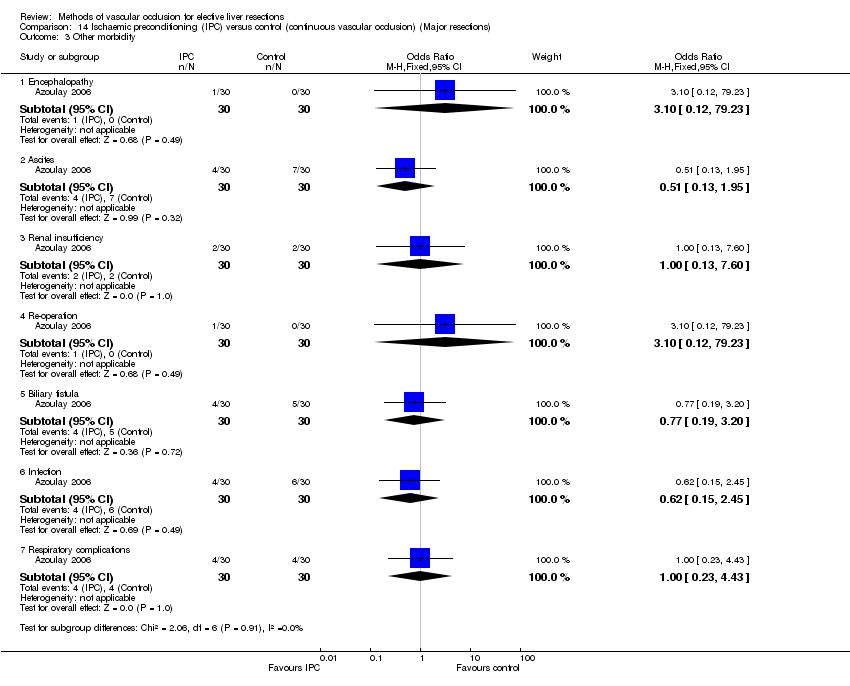
| Re‐operation | 2.67 [0.10, 68.70]
(n = 52) | ‐ | Not estimable
(n = 80) | Not estimable
(n = 80) | ‐ | 5.49 [0.26, 117.88]
(n = 86) | ‐ | ‐ |
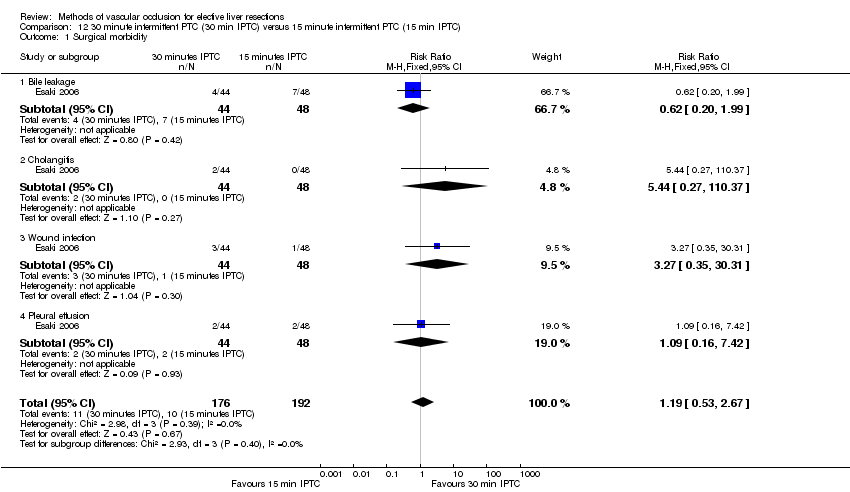
| Bile leak | ‐ | ‐ | 1.08 [0.30, 3.83]
(n = 138) | 3.23 [0.13, 81.79]
(n = 80) | 0.83 [0.20, 3.48]
(n = 58) | ‐ | ‐ | 0.62 [0.20, 1.99]
(n = 92) |
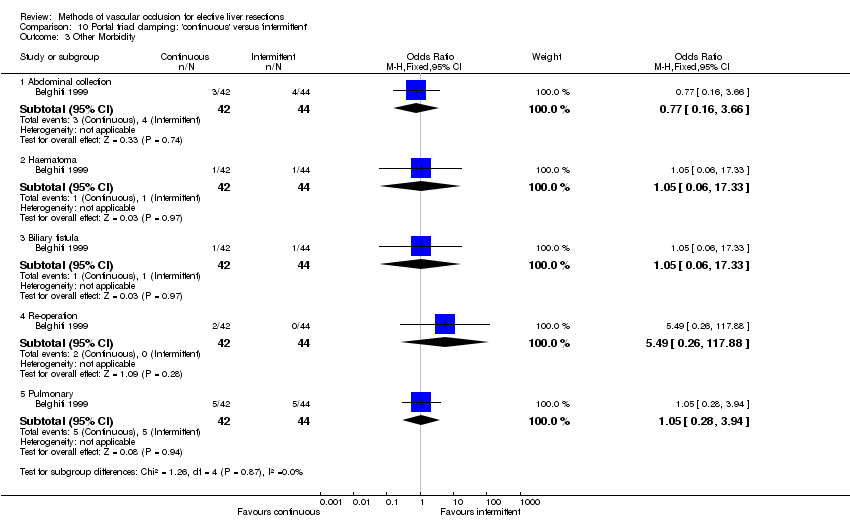
| Biliary fistula | ‐ | ‐ | ‐ | ‐ | ‐ | 1.05 [0.06, 17.33]
(n = 86) | ‐ | ‐ |
| Portal vein thrombosis | ‐ | ‐ | 0.20 [0.01, 4.30]
(n = 80) | 0.20 [0.01, 4.30]
(n = 80) | ‐ | ‐ | ‐ | ‐ |
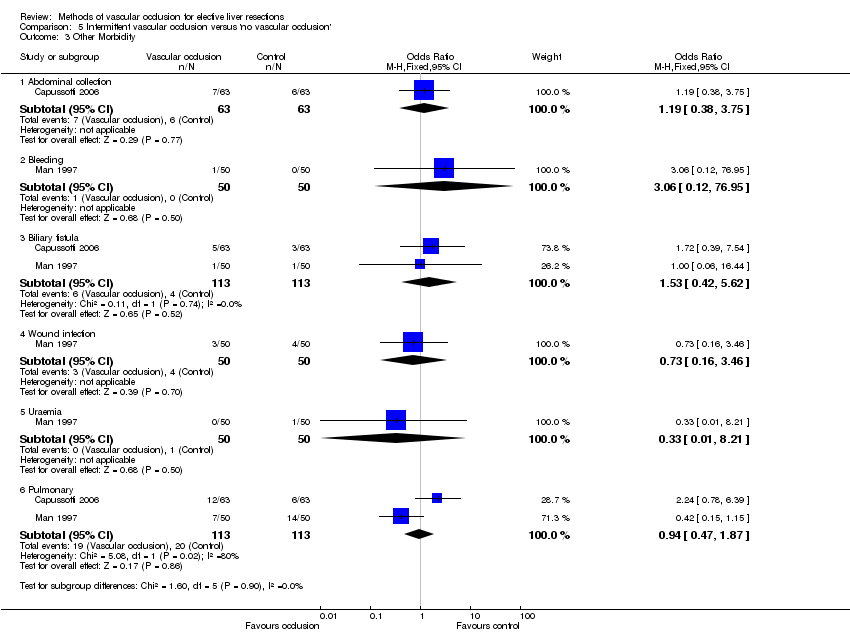
| Intra‐abdominal collections | 2.45 [0.72, 8.41]
(n = 170) | Included in meta‐analysis | 1.08 [0.30, 3.83] (infected)
(n = 58) | ‐ | 1.08 [0.30, 3.83] (infected)
(n = 58) | 0.77 [0.16, 3.66]
(n = 86) | ‐ | ‐ |
| Haematoma | 1.77 [0.15, 20.82]
(n = 52) | ‐ | ‐ | ‐ | ‐ | 1.05 [0.06, 17.33]
(n = 86) | ‐ | ‐ |
| Respiratory complications | 1.59 [0.72, 3.53]
(n = 170) | Included in meta‐analysis | 2.23 [0.19, 26.06]
(n = 58) | ‐ | 2.23 [0.19, 26.06]
(n = 58) | 1.05 [0.28, 3.94]
(n = 86) | ‐ | ‐ |
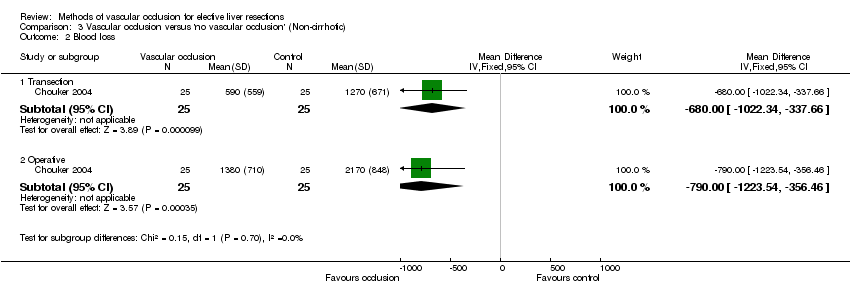
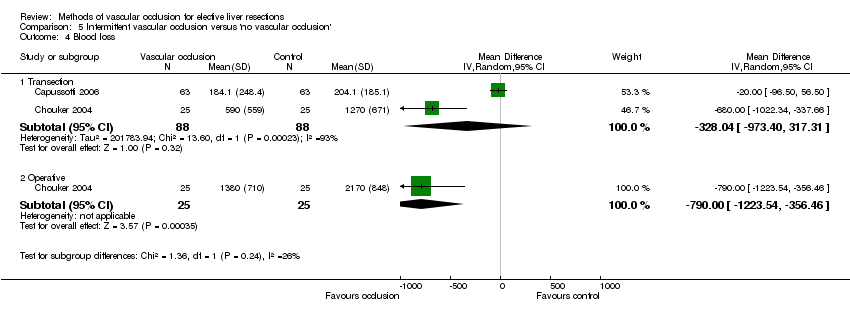
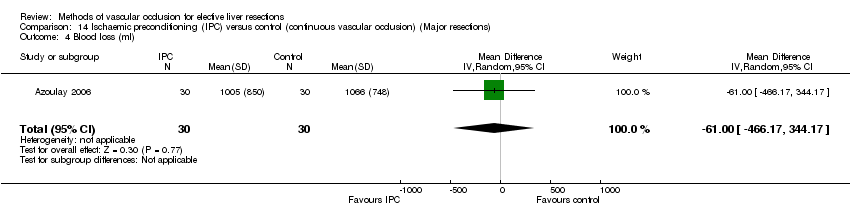
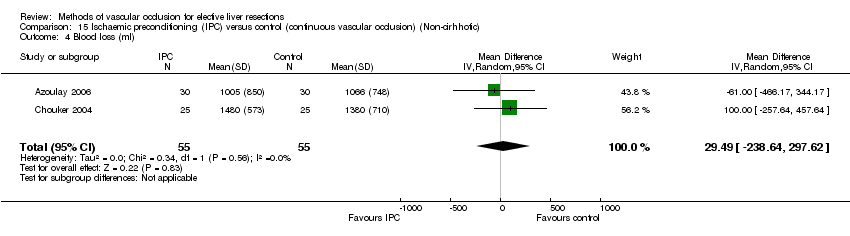
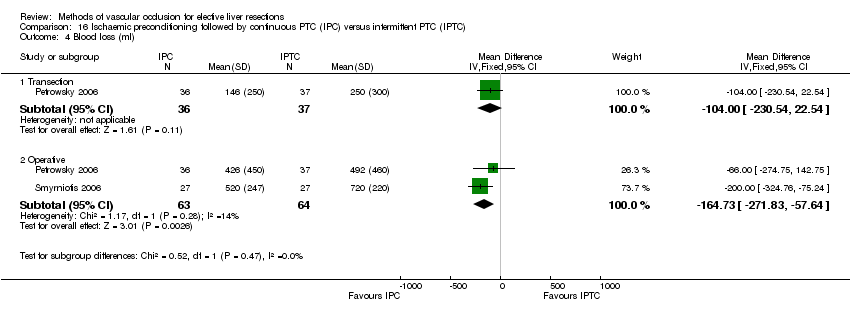
| BLOOD LOSS (ml) | | | | | | | | |
| Transection | ‐330.00 [‐407.25, ‐252.75]
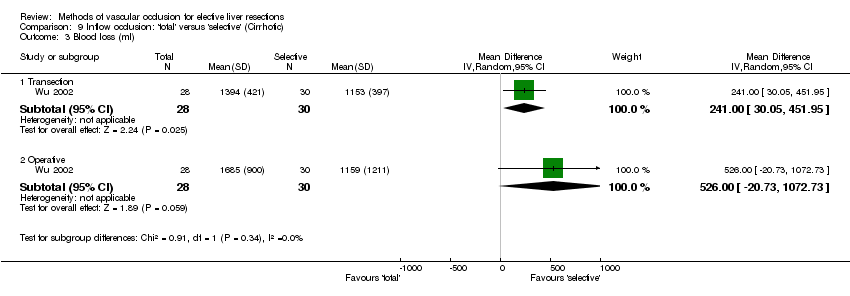
(n= 118) | Included in meta‐analysis | 241.00 [30.05, 451.95]*
(n = 58) | ‐ | 241.00 [30.05, 451.95]*
(n = 58) | ‐250.00 [‐387.14, ‐112.86]*
(n = 86) | ‐ | ‐ |
| Operative | ‐185.48 [‐682.89, 311.92]
(n = 162) | Included in meta‐analysis | 167.43 [‐121.33, 456.19]
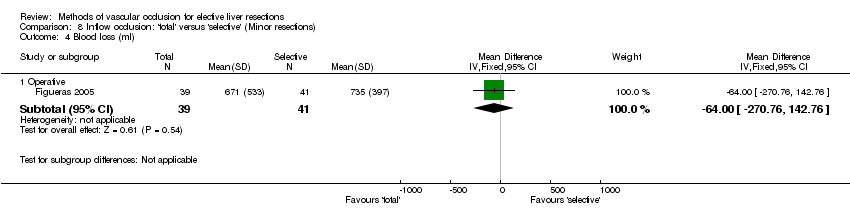
(n = 138) | ‐64.00 [‐270.76, 142.76]
(n = 80) | 526.00 [‐20.73, 1072.73)
(n = 58) | ‐58.49 [‐321.68, 204.71]
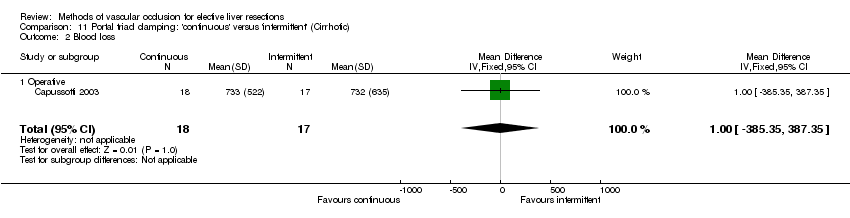
(n = 121) | 1.00 [‐385.35, 387.35]
(n = 35) | 352 vs 359
(n = 92) |
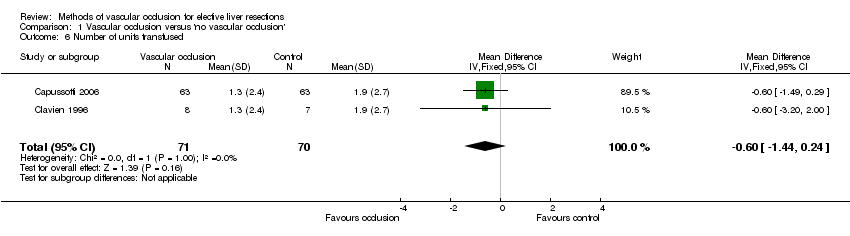
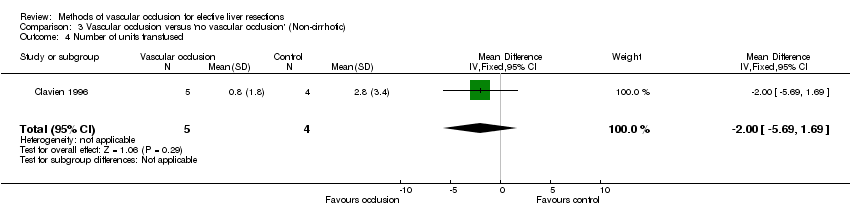
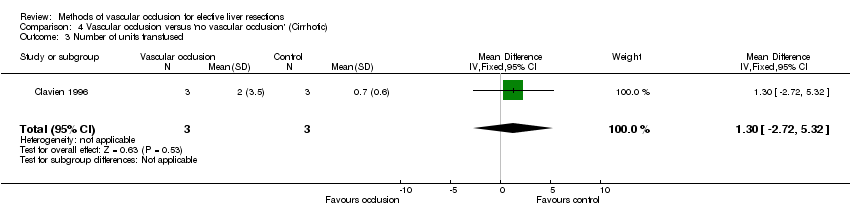
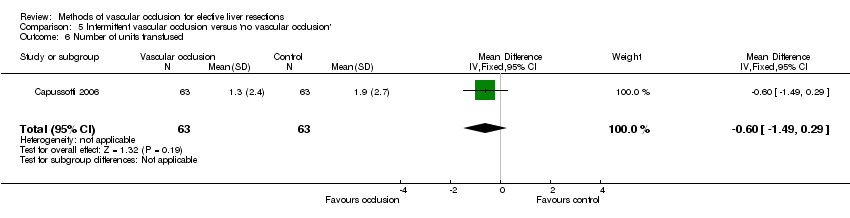
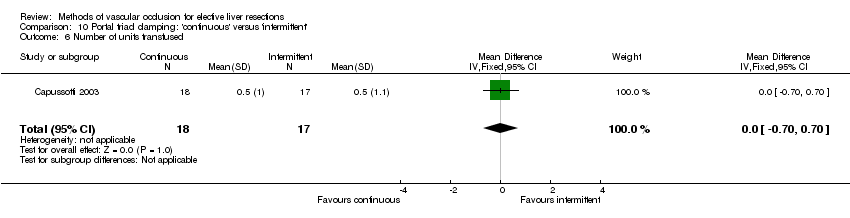
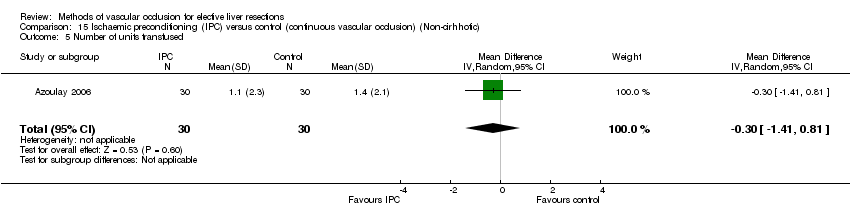
| Number of units transfused | ‐0.40 [‐2.58, 1.78]
(n = 44) | ‐ | 0.02 [‐0.40, 0.44]
(n = 80) | 0.02 [‐0.40, 0.44]
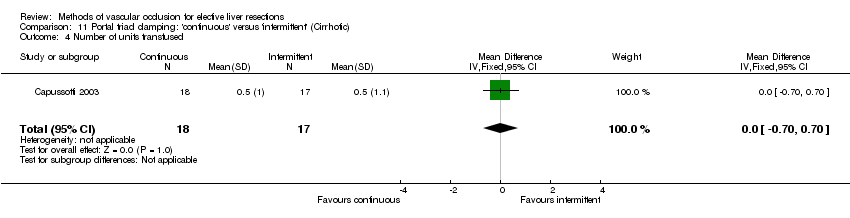
(n = 80) | ‐ | 0.00 [‐0.70, 0.70]
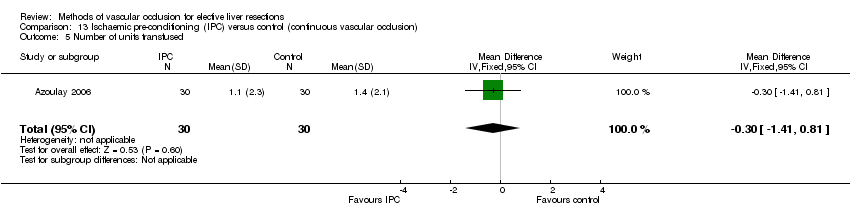
(n = 35) | 0.00 [‐0.70, 0.70]
(n = 35) | ‐ |
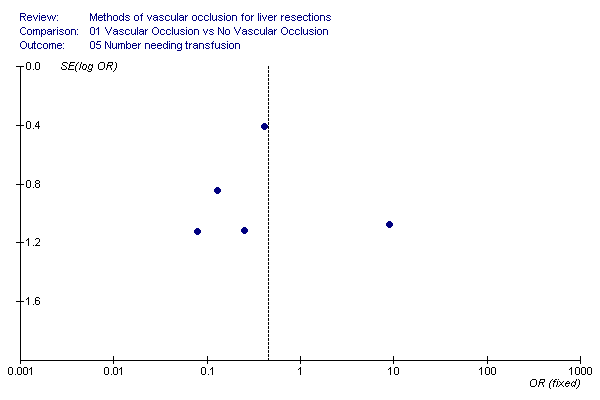
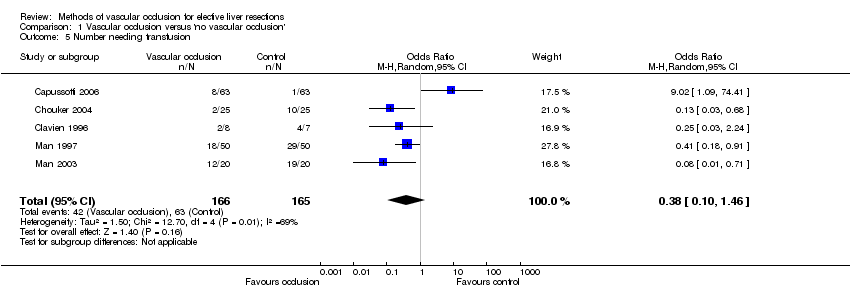
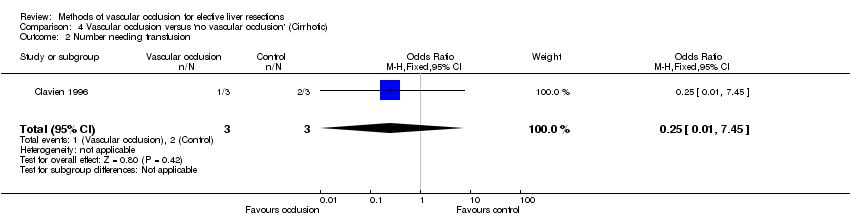
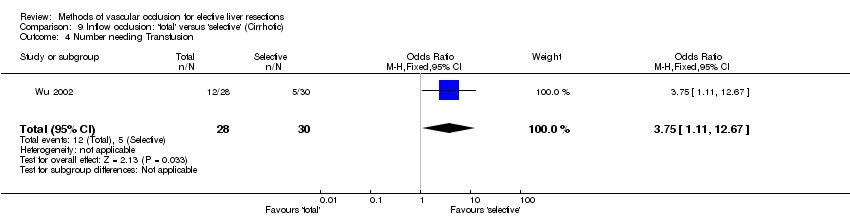
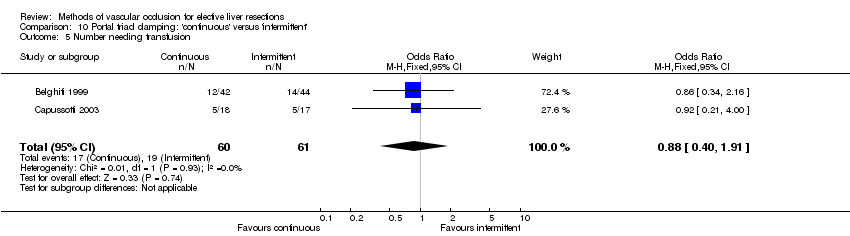
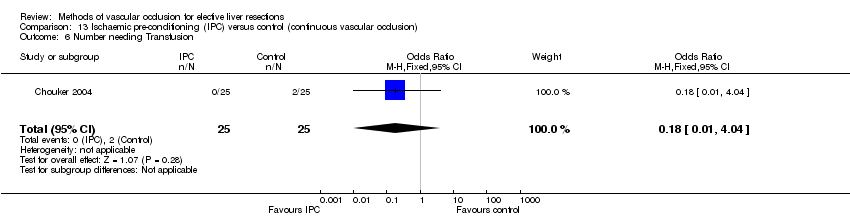
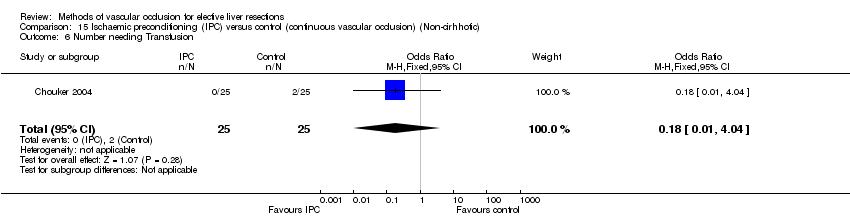
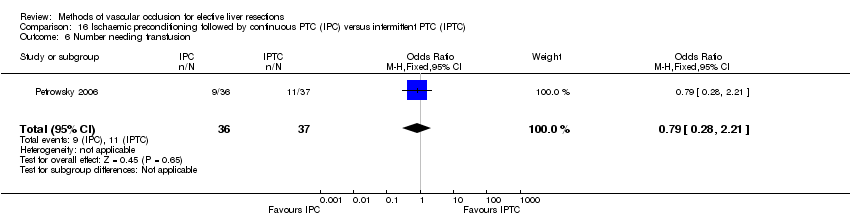
| Number needing transfusion | 0.56 [0.06, 5.66]
(n = 162) | Included in meta‐analysis | 1.62 [0.30, 8.81]
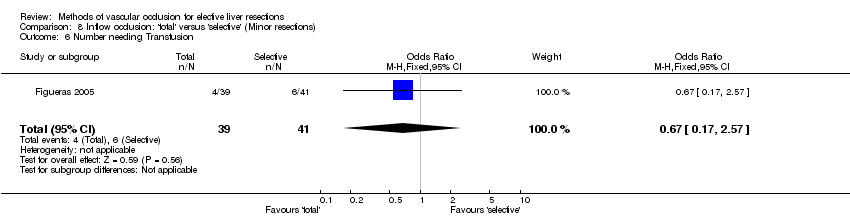
(n = 138) | 0.67 [0.17, 2.57]
(n = 80) | 3.75 [1.11, 12.67]*
(n = 58) | 0.88 [0.40, 1.91]
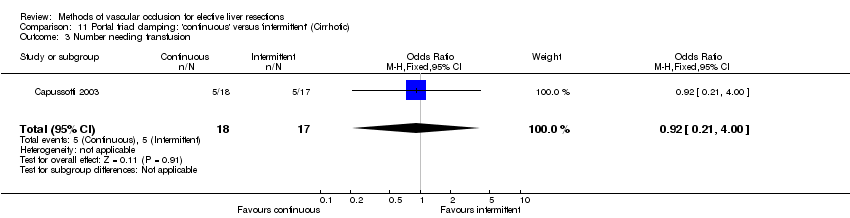
(n = 121) | 0.92 [0.21, 4.00]
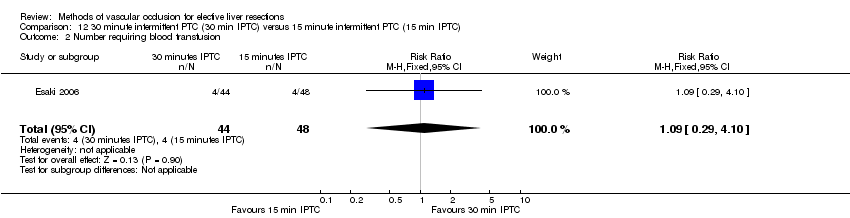
(n = 35) | 1.09 [0.29, 4.10]
(n = 92) |
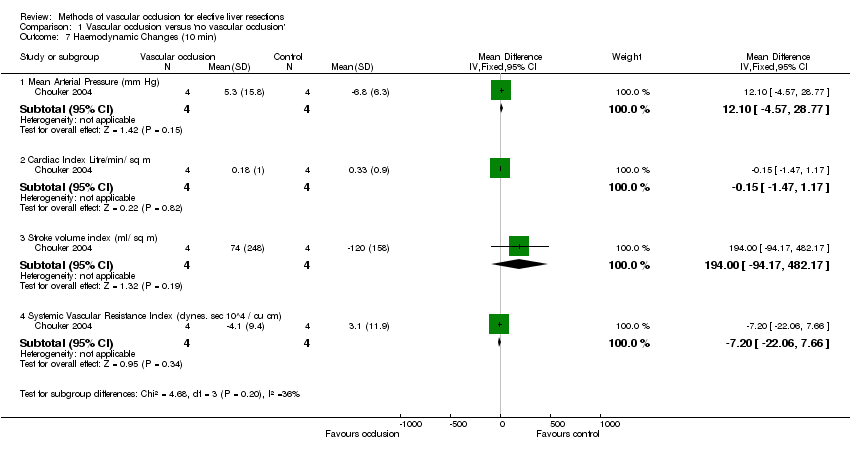
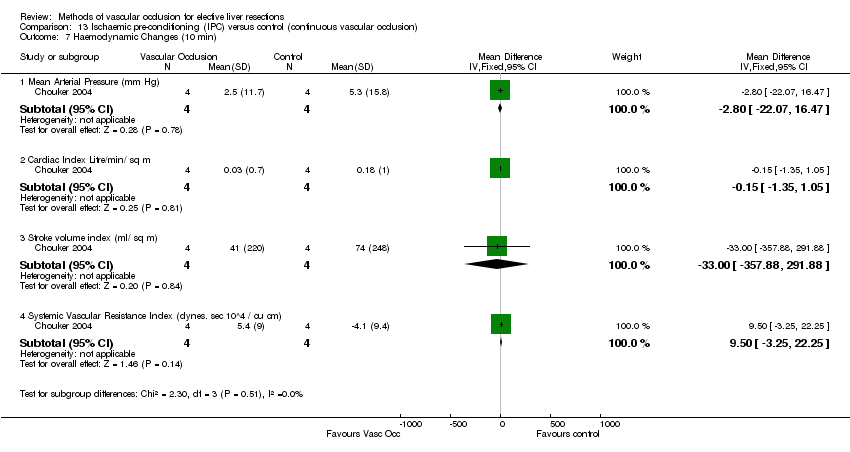
| HAEMODYNAMIC CHANGES (during occlusion) | | | | | | | | |
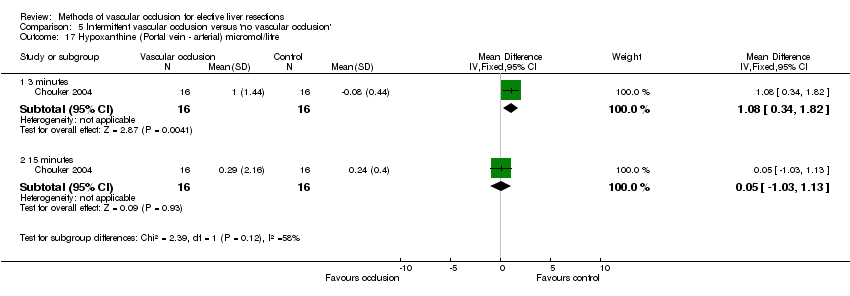
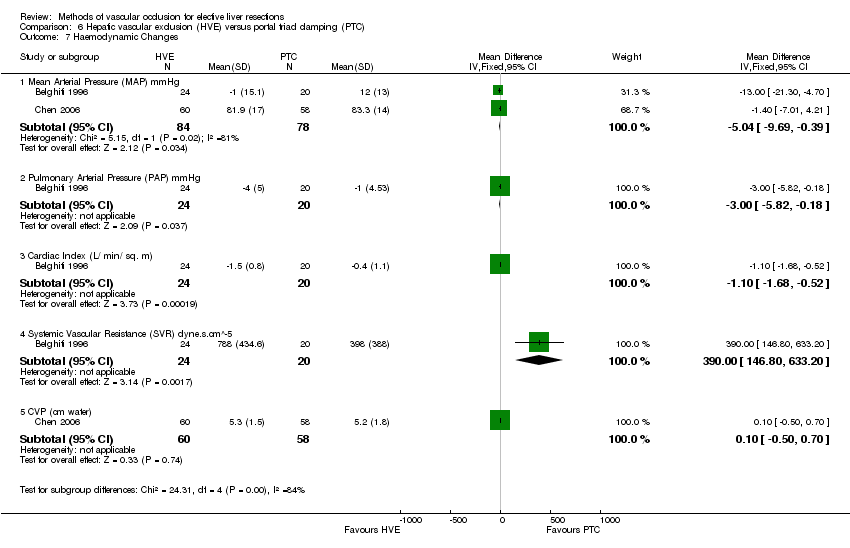
| Mean Arterial Pressure (mmHg) | ‐5.04 [‐9.69, ‐0.39]*
(n = 162) | Included in meta‐analysis | ‐3.40 [‐11.01, 4.21]
(n = 80) | ‐3.40 [‐11.01, 4.21]
(n = 80) | ‐ | ‐ | ‐ | ‐ |
| Pulmonary Arterial Pressure (mmHg) | ‐3.00 [‐5.82, ‐0.18]*
(n = 44) | ‐ | ‐ | ‐ | ‐ | ‐ | ‐ | ‐ |
| Cardiac Index (Litre/min/m2) | ‐1.10 [‐1.68, ‐0.52]*
(n = 44) | ‐ | ‐ | ‐ | ‐ | ‐ | ‐ | ‐ |
| Systemic Vascular resistance (dynes.sec/cm5) | 390.00 [146.80, 633.20]*
(n = 44) | ‐ | ‐ | ‐ | ‐ | ‐ | ‐ | ‐ |
| Central Venous Pressure (CVP) mmHg | 0.10 [‐0.50, 0.70]
(n = 118) | Included in meta‐analysis | ‐1.00 [‐2.56, 0.56]
(n = 80) | ‐1.00 [‐2.56, 0.56]
(n = 80) | ‐ | ‐ | ‐ | ‐ |
| Portal Venous Pressure (PVP) mmHg | ‐ | ‐ | 19.40 [15.19, 23.61]*
(n = 80) | 19.40 [15.19, 23.61]*
(n = 80) | ‐ | ‐ | ‐ | |
| Hepatic Venous Pressure Gradient (HVPG) mmHg (CVP ‐ PVP) | ‐ | ‐ | 20.60 [16.16, 25.04]*
(n = 80) | 20.60 [16.16, 25.04]*
(n = 80) | ‐ | ‐ | ‐ | ‐ |
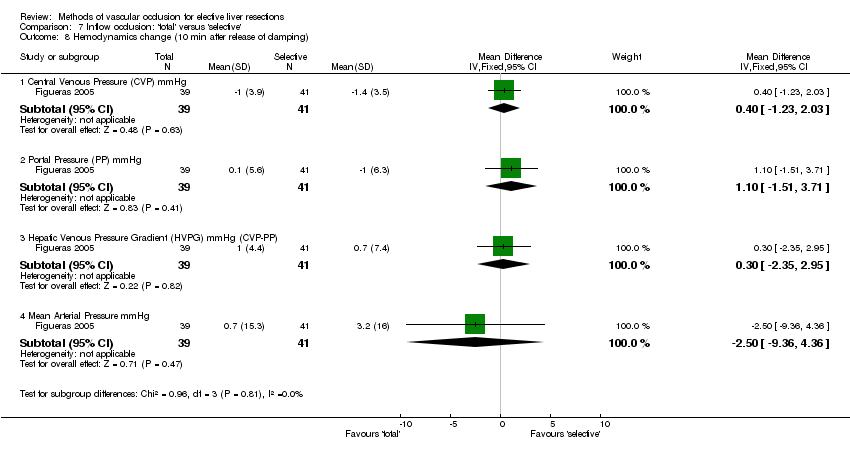
| HAEMODYNAMIC CHANGES (10 min after release of clamp) | | | | | | | | |
| Mean Arterial Pressure (mmHg) | ‐ | ‐ | ‐2.50 [‐9.36, 4.36]
(n = 80) | ‐2.50 [‐9.36, 4.36]
(n = 80) | ‐ | ‐ | ‐ | ‐ |
| Central Venous Pressure (CVP) mmHg | ‐ | ‐ | 0.40 [‐1.23, 2.03]
(n = 80) | 0.40 [‐1.23, 2.03]
(n = 80) | ‐ | ‐ | ‐ | ‐ |
| Portal Venous Pressure (PVP) mmHg | ‐ | ‐ | 1.10 [‐1.51, 3.71]
(n = 80) | 1.10 [‐1.51, 3.71]
(n = 80) | ‐ | ‐ | ‐ | ‐ |
| Hepatic Venous Pressure Gradient (HVPG) mmHg (CVP ‐ PVP) | ‐ | ‐ | 0.30 [‐2.35, 2.95]
(n = 80) | 0.30 [‐2.35, 2.95]
(n = 80) | ‐ | ‐ | ‐ | ‐ |
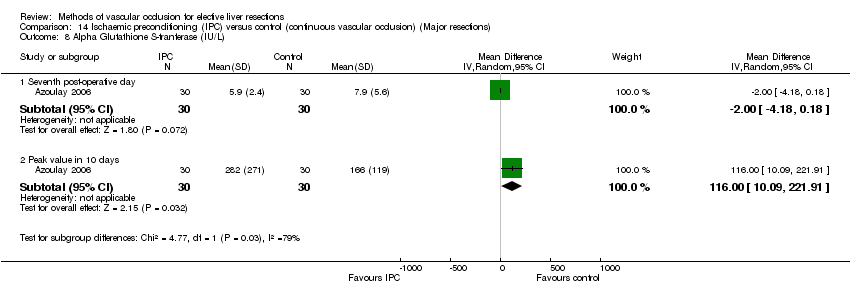
| LIVER FUNCTION TESTS | | | | | | | | |
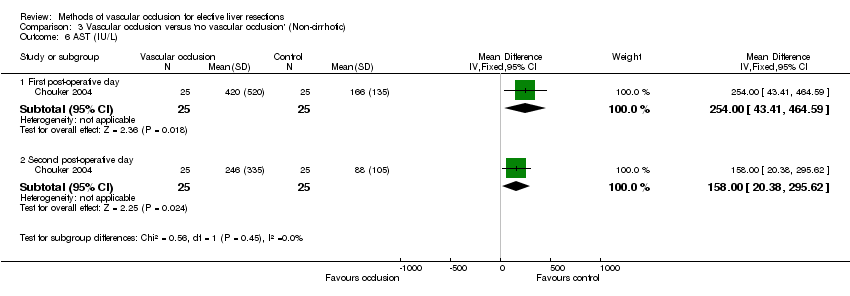
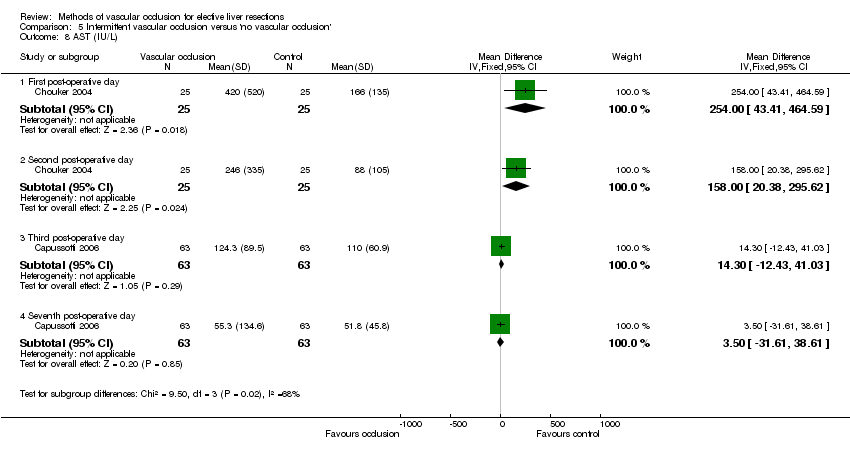
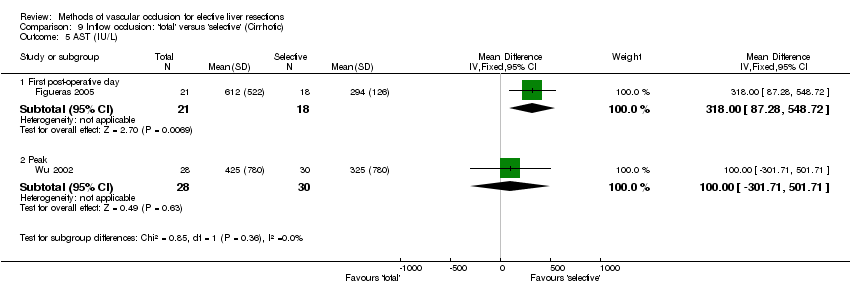
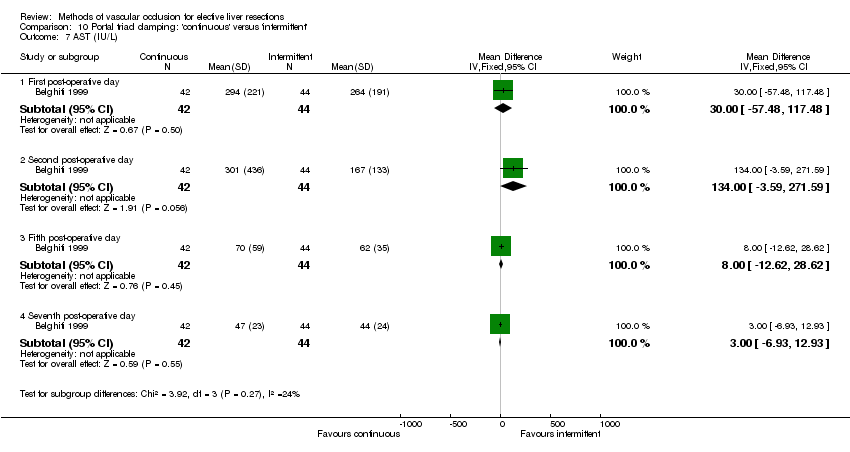
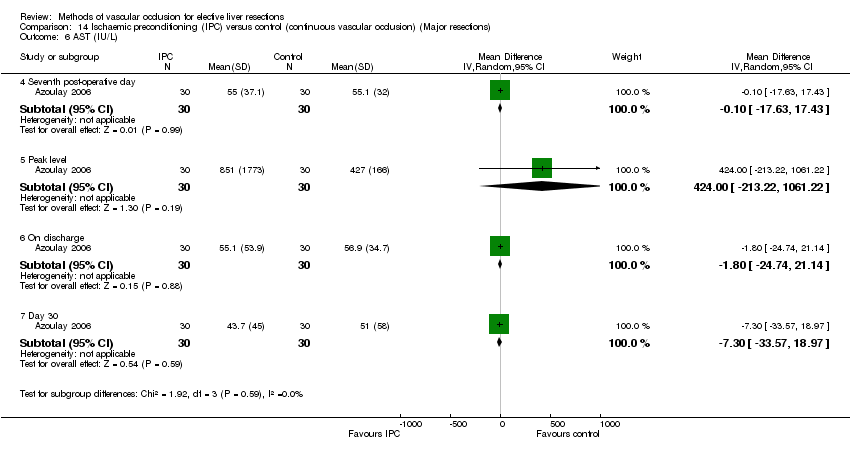
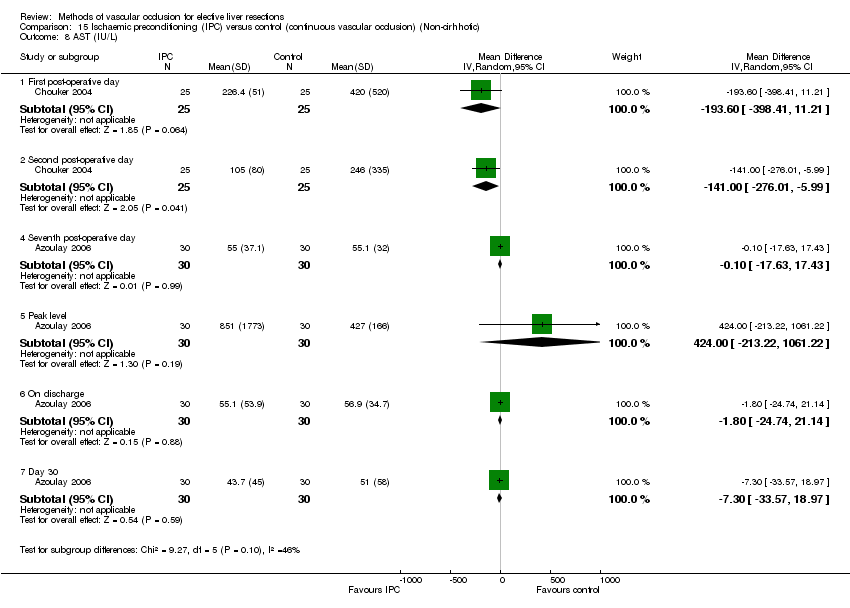
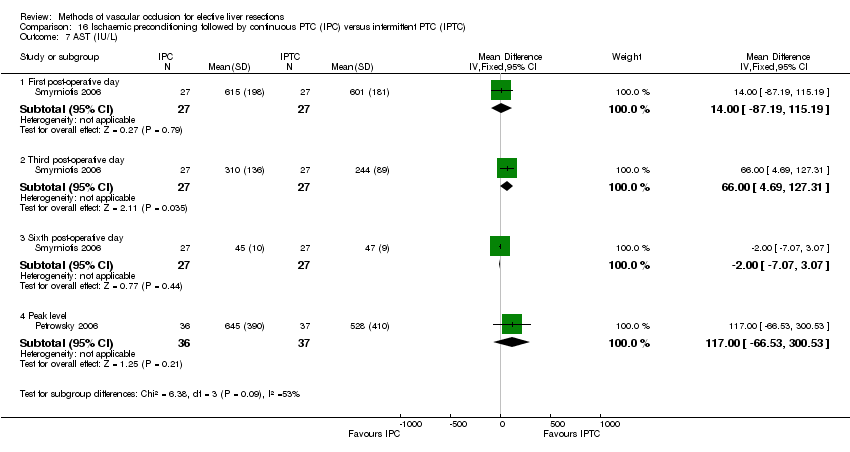
| AST (IU/L) | | | | | | | | |
| 1st POD (post‐operative day) | ‐16.00 [‐157.08, 125.08]
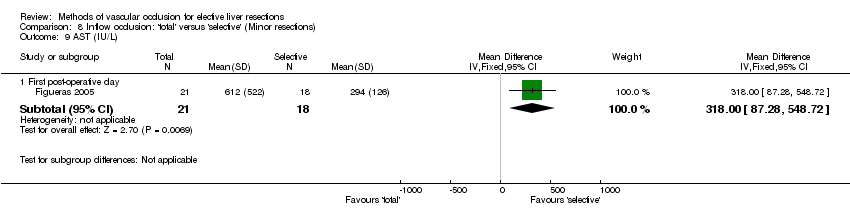
(n = 44) | ‐ | 318 [87.28, 548.72]*
(n = 39 cirrhotic livers only) | 318 [87.28, 548.72]*
(n = 39 cirrhotic livers only) | 318 [87.28, 548.72]*
(n = 39) | 30.00 [‐57.48, 117.48]
(n = 86)
340 vs 240
(n = 35) | 340 vs 240
(n = 35) | 235 vs 274
(n = 92) |
| 2nd POD | ‐ | ‐ | ‐ | ‐ | ‐ | 134.00 [‐3.59, 271.59]
(n = 86) | ‐ | ‐ |
| 3rd POD | ‐ | ‐ | ‐ | ‐ | ‐ | ‐ | ‐ | 76 vs 80
(n = 92) |
| 5th POD | ‐1.00 [‐14.01, 12.01]
(n = 44) | ‐ | ‐ | ‐ | ‐ | 8.00 [‐12.62, 28.62]
(n = 86) | ‐ | ‐ |
| 7th POD | ‐ | ‐ | ‐ | ‐ | ‐ | 3.00 [‐6.93, 12.93]
(n = 86) | ‐ | 39 vs 37
(n = 92) |
| Peak | ‐ | 600 vs 720
n = 118 | 100 [‐301.71, 501.71]
(n = 58) | ‐ | 100 [‐301.71, 501.71]
(n = 58) | ‐ | ‐ | ‐ |
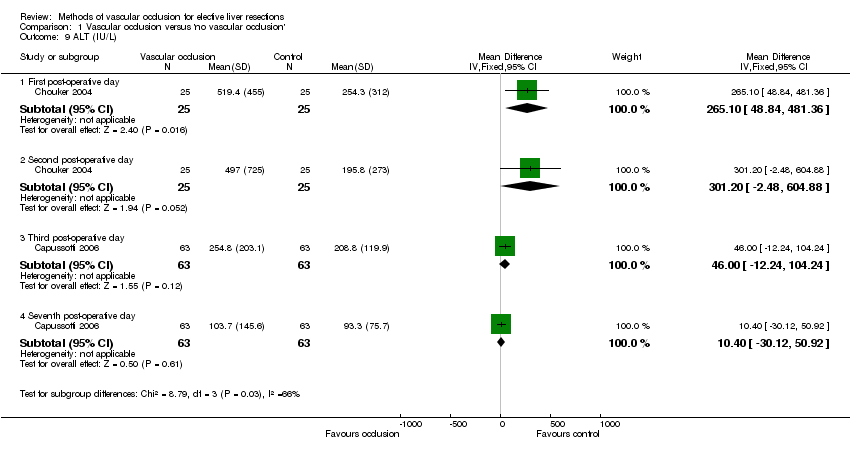
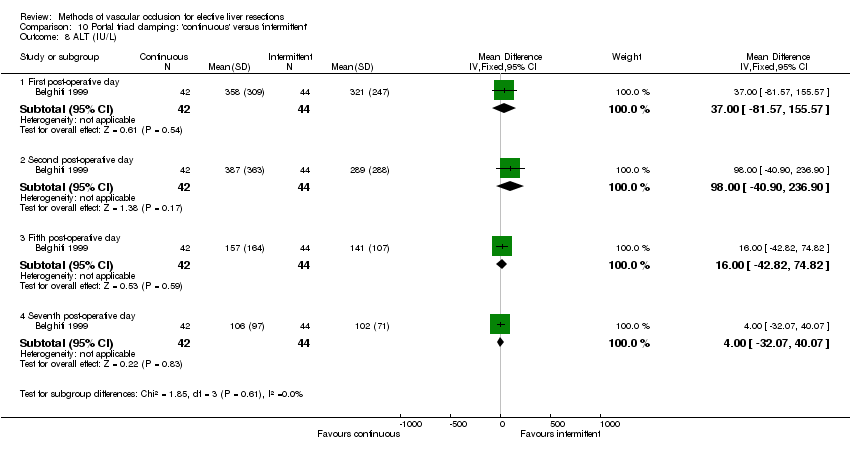
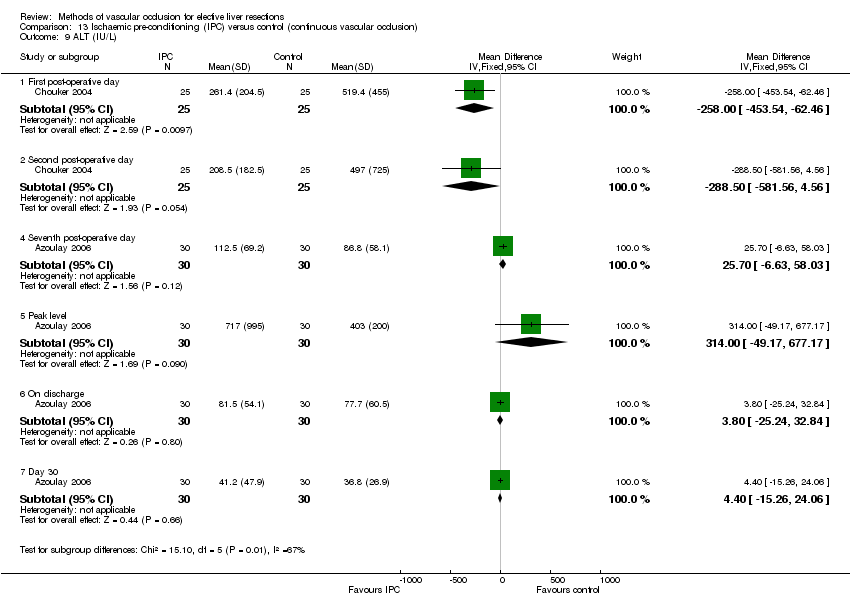
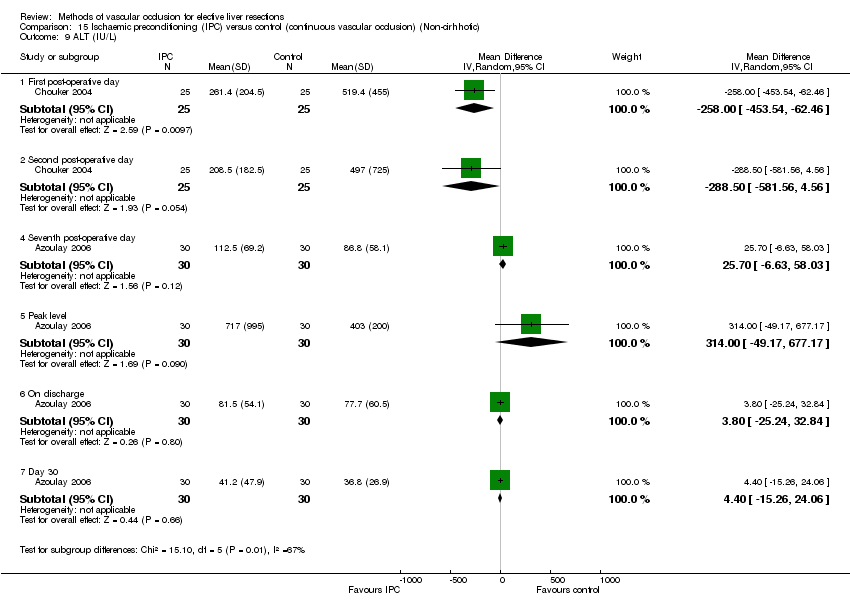
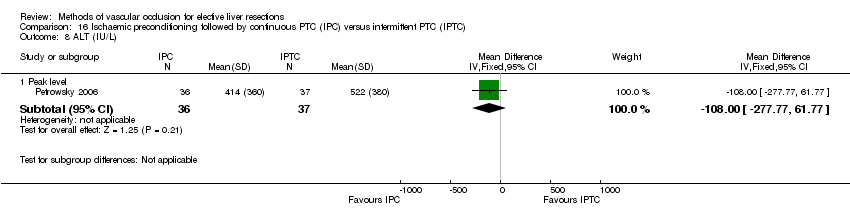
| ALT (IU/L) | | | | | | | | |
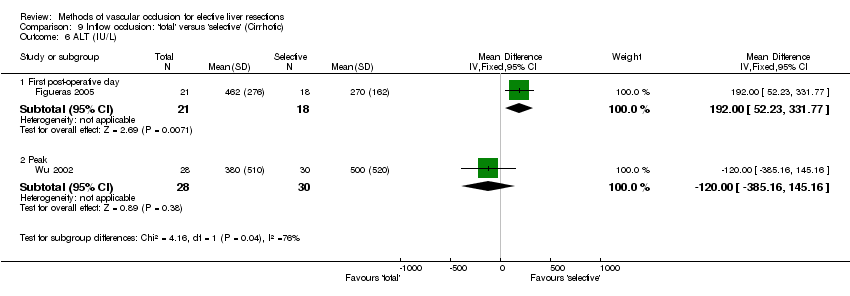
| 1st POD | ‐ | ‐ | 30.00 [‐78.11, 138.11]
(n = 80) | 30.00 [‐78.11, 138.11]
(n = 80) | 192.00 [52.23, 331.77]
(n = 39) | 37.00 [‐81.57, 155.57]
(n = 86)
260 vs 180
(n = 35) | 260 vs 180
(n = 35) | 255 vs 224
(n = 92) |
| 2nd POD | ‐ | ‐ | ‐ | ‐ | | 98.00 [‐40.90, 236.90]
(n = 86) | ‐ | ‐ |
| 3rd POD | ‐ | ‐ | ‐ | ‐ | ‐ | ‐ | ‐ | 130 vs 115
(n = 92) |
| 5th POD | ‐ | ‐ | ‐ | ‐ | | 16.00 [‐42.82, 74.82]
(n = 86) | ‐ | ‐ |
| 7th POD | ‐ | ‐ | ‐ | ‐ | | 4.00 [‐32.07, 40.07]
(n = 86) | ‐ | 85 vs 89
(n = 92) |
| Peak | ‐ | 740 vs 860
(n = 118) | ‐120 [‐385.16, 145.16]
(n = 58) | ‐ | ‐120 [‐385.16, 145.16]
(n = 58) | ‐ | ‐ | ‐ |
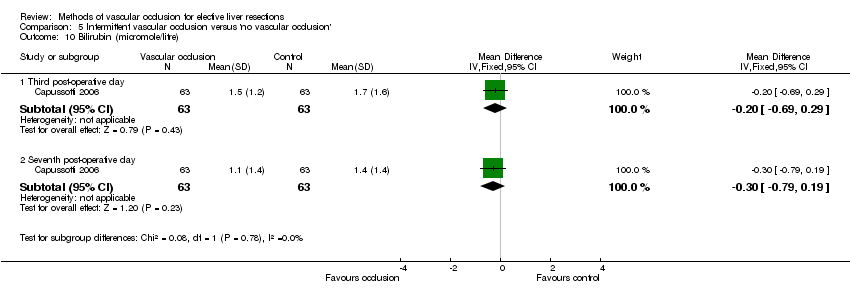
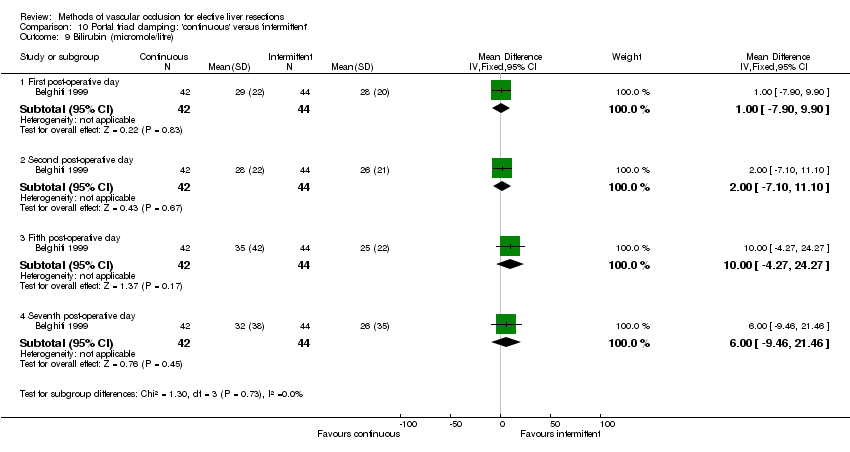
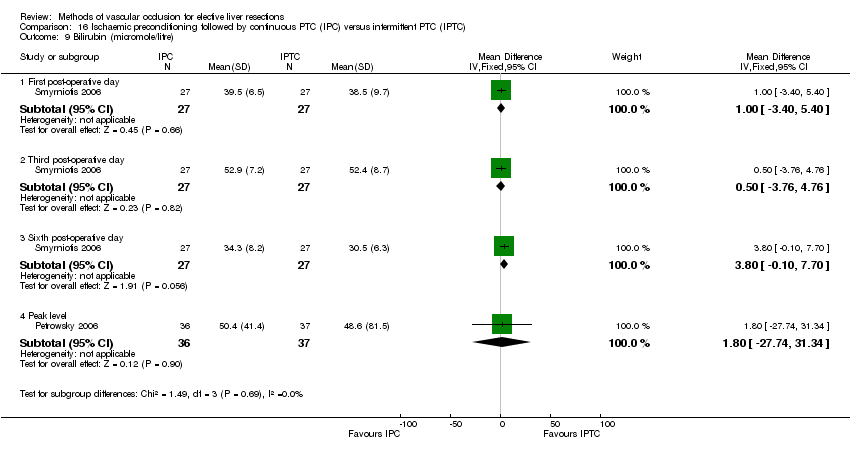
| BILIRUBIN (micromole / litre) | | | | | | | | |
| 1st POD | ‐ | ‐ | ‐ | ‐ | ‐ | 1.00 [‐7.90, 9.90]
(n = 86)
24 vs 36
(n = 35) | 24 vs 36
(n = 35) | ‐ |
| 2nd POD | ‐ | ‐ | ‐ | ‐ | ‐ | 2.00 [‐7.10, 11.10]
(n = 86) | ‐ | ‐ |
| 5th POD | ‐ | ‐ | ‐ | ‐ | ‐ | 10.00 [‐4.27, 24.27]
(n = 86) | ‐ | ‐ |
| 7th POD | ‐ | ‐ | ‐ | ‐ | ‐ | 6.00 [‐9.46, 21.46]
(n = 86) | ‐ | 13.7 vs 11.9
(n = 92) |
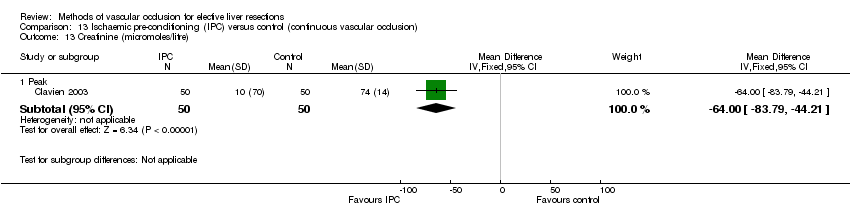
| Peak | ‐ | 1.5 vs 1.7
(n = 118) | No difference in peak bilirubin levels
(n = 58) | No difference in peak bilirubin levels
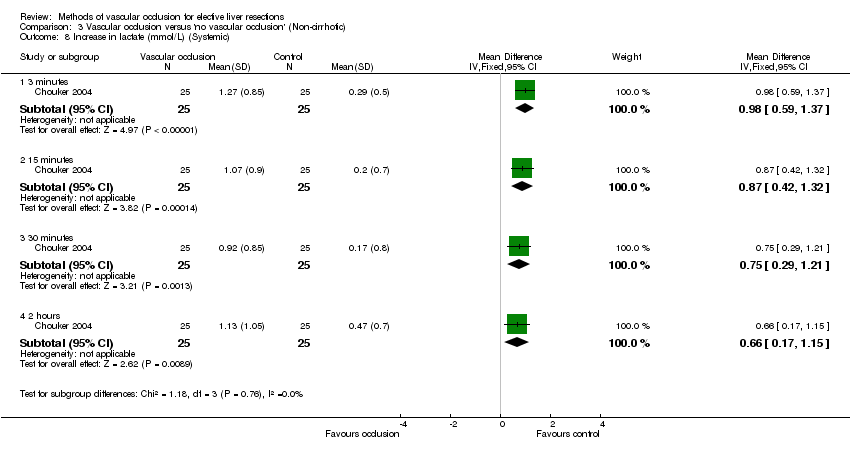
(n = 58) | ‐ | 0.87 [0.42, 1.32]*
(n = 50) | ‐ | 11.1 vs 12.0
(n = 92) |
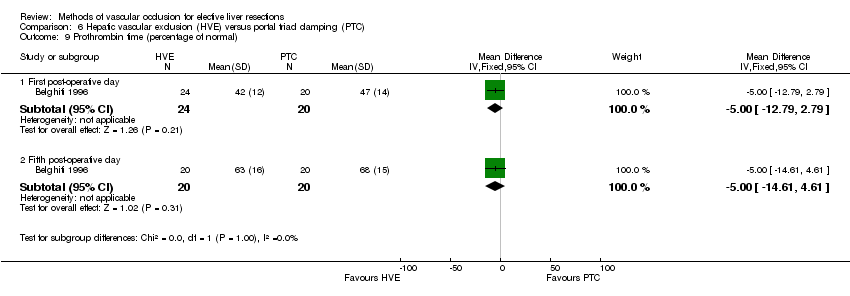
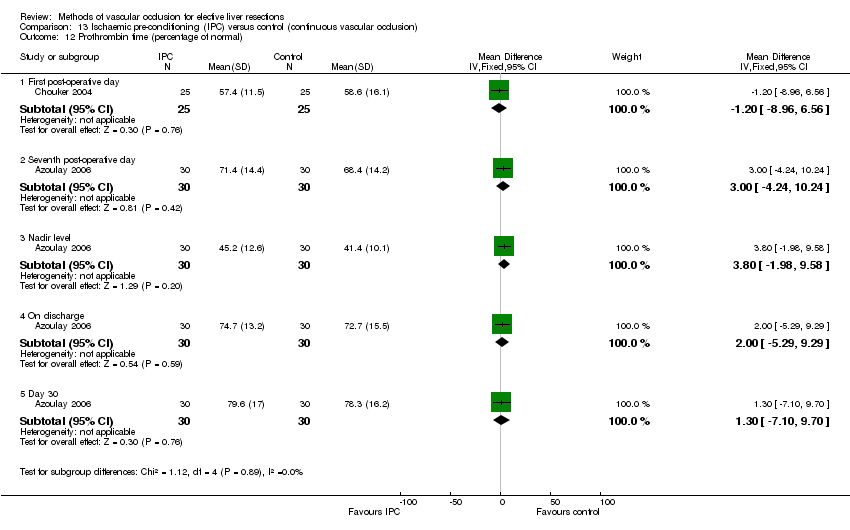
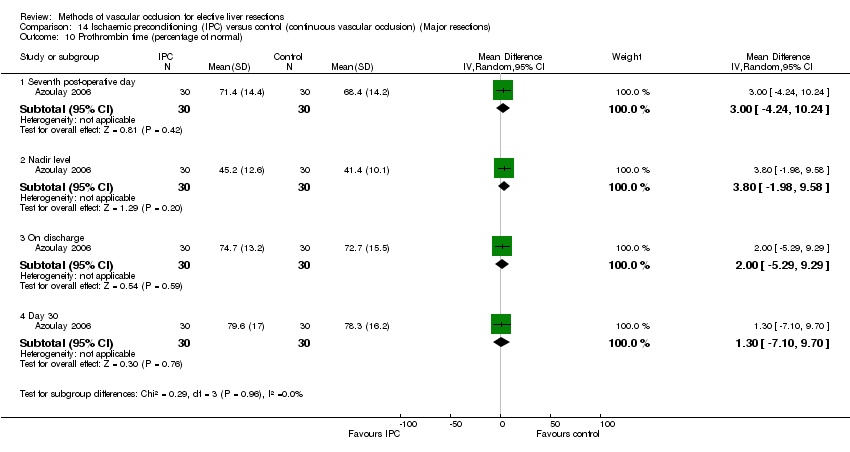
| PROTHROMBIN TIME (as percentage of normal function) | | | | | | | | |
| 1st POD | ‐5.00 [‐12.79, 2.79]
(n = 44) | ‐ | ‐ | ‐ | ‐ | ‐2.00 [‐7.92, 3.92]
(n = 86)
72% vs 67%
(n = 35) | 72% vs 67%
(n = 35) | ‐ |
| 2nd POD | ‐ | ‐ | ‐ | ‐ | ‐ | 1.00 [‐5.76, 7.76]
(n = 86) | ‐ | ‐ |
| 5th POD | ‐5.00 [‐14.61, 4.61]
(n = 44) | ‐ | ‐ | ‐ | ‐ | 18.00 [11.24, 24.76]
(n = 86) | ‐ | ‐ |
| 7th POD | ‐ | ‐ | ‐ | ‐ | ‐ | 0.00 [‐6.60, 6.60]
(n = 86) | ‐ | 63.9 vs 59.1
(n = 92) |
| Peak | ‐ | ‐ | ‐ | ‐ | ‐ | ‐ | ‐ | 62.6 vs 63.2
(n = 92) |
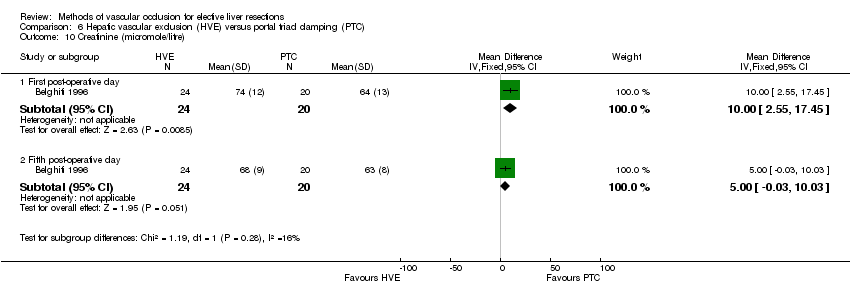
| CREATININE (micromole/litre) | | | | | | | | |
| 1st POD | 10.00 [2.55, 17.45]*
(n = 44) | ‐ | ‐ | ‐ | ‐ | ‐ | ‐ | ‐ |
| 5th POD | 5.00 [‐0.03, 10.03]
(n = 44) | ‐ | ‐ | ‐ | ‐ | ‐ | ‐ | ‐ |
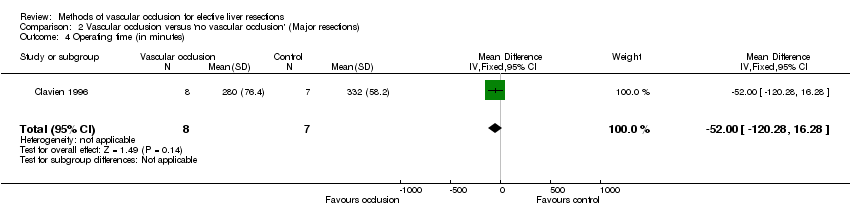
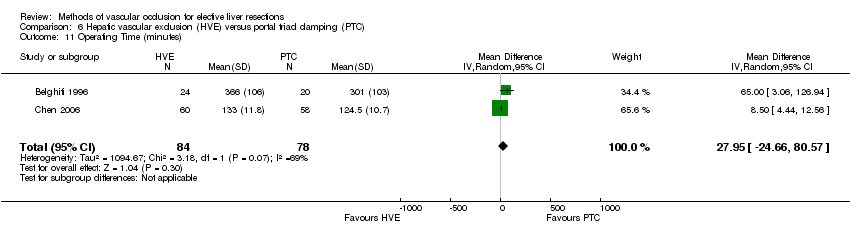
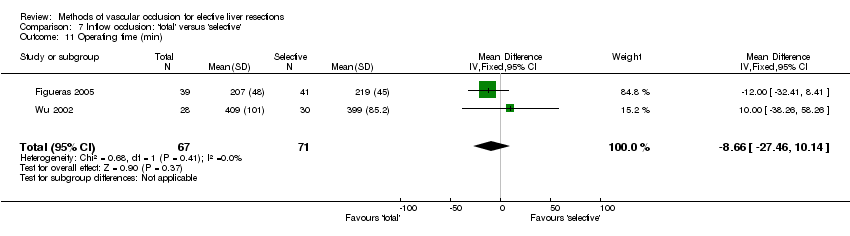
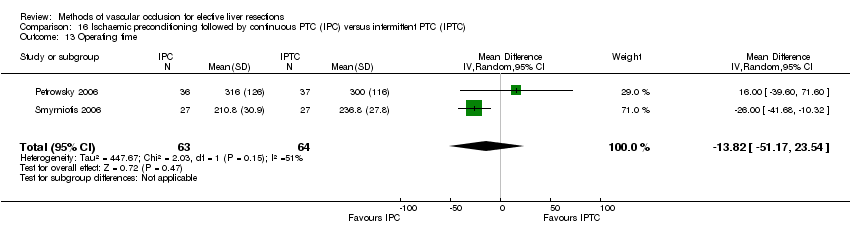
| OPERATING TIME (min) | 27.95 [‐24.66, 80.57]
(n = 162) | Included in meta‐analysis | ‐8.66 [‐27.46, 10.14]
(n = 138) | ‐12.00 [‐32.41, 8.41]
(n = 80) | 10.00 [‐38.26, 58.26]
(n = 58) | ‐13.40 [‐68.08, 41.28]
(n = 35) | ‐13.40 [‐68.08, 41.28]
(n = 35) | 255 vs 307*
(n = 92) |
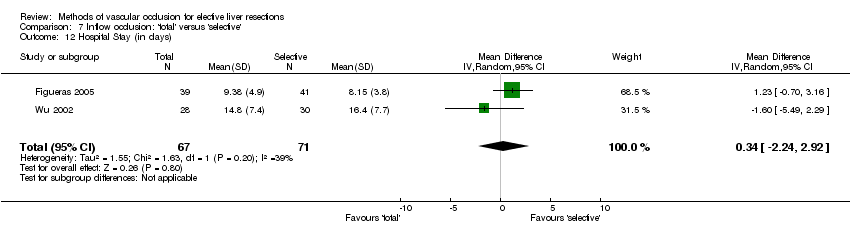
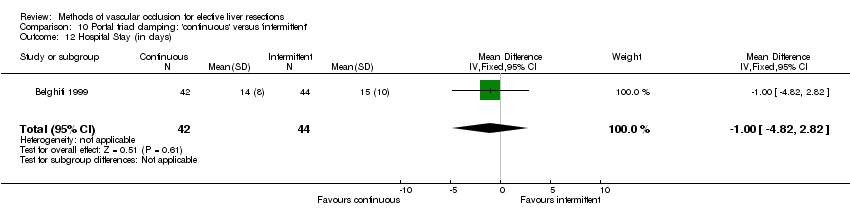
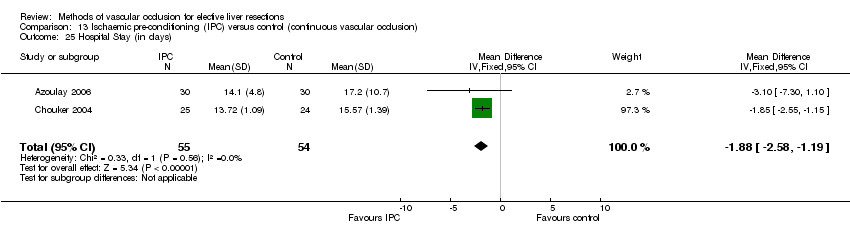
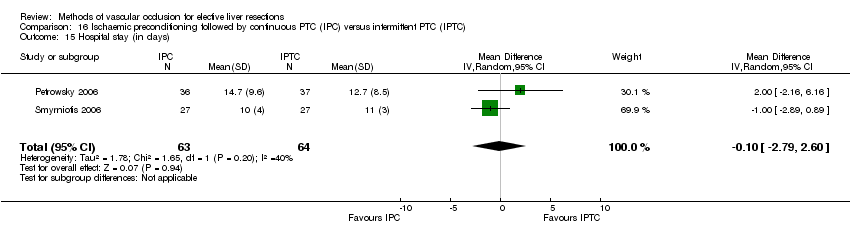
| HOSPITAL STAY (days) | 5.00 [‐0.36, 10.36]
(n = 44) | ‐ | 0.34 [‐2.24, 2.92]?
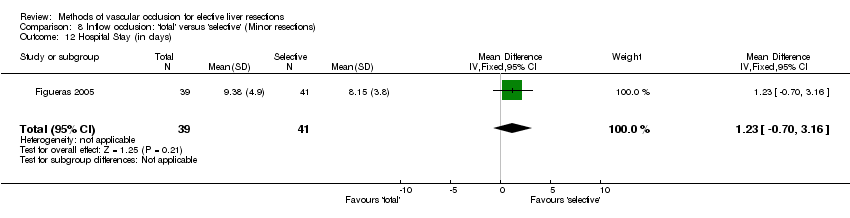
(n = 138) | 1.23 [‐0.70, 3.16]
(n = 80) | ‐1.60 [‐5.49, 2.29]
(n = 58) | ‐1.00 [‐4.82, 2.82]
(n = 86) | ‐ | 12 vs 12
(n = 92) |