Scolaris Content Display Scolaris Content Display

Risk of bias summary: review authors' judgements about each risk of bias item for each included study.
Figuras y tablas -
Figure 1

Risk of bias summary: review authors' judgements about each risk of bias item for each included study.

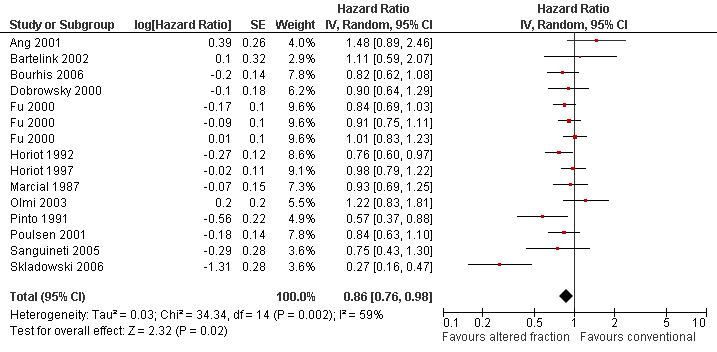
Forest plot of comparison: Summary analyses for altered fractionation versus conventional radiotherapy, outcome: Total mortality.
Figuras y tablas -
Figure 2

Forest plot of comparison: Summary analyses for altered fractionation versus conventional radiotherapy, outcome: Total mortality.

Forest plot of comparison: Summary analyses for altered fractionation versus conventional radiotherapy, outcome: Locoregional control.
Figuras y tablas -
Figure 3

Forest plot of comparison: Summary analyses for altered fractionation versus conventional radiotherapy, outcome: Locoregional control.

Forest plot of comparison: Summary analyses for altered fractionation versus conventional radiotherapy, outcome: Disease free survival.
Figuras y tablas -
Figure 4

Forest plot of comparison: Summary analyses for altered fractionation versus conventional radiotherapy, outcome: Disease free survival.

Comparison 1 Altered fractionation versus conventional radiotherapy, Outcome 1 Total mortality (using IPD where available).
Figuras y tablas -
Analysis 1.1

Comparison 1 Altered fractionation versus conventional radiotherapy, Outcome 1 Total mortality (using IPD where available).

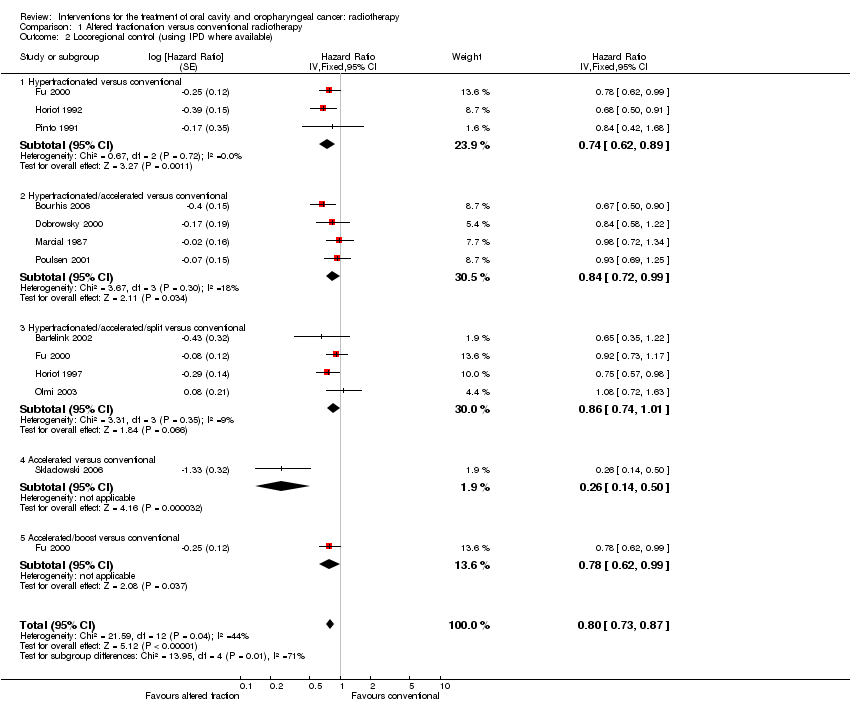
Comparison 1 Altered fractionation versus conventional radiotherapy, Outcome 2 Locoregional control (using IPD where available).
Figuras y tablas -
Analysis 1.2

Comparison 1 Altered fractionation versus conventional radiotherapy, Outcome 2 Locoregional control (using IPD where available).

Comparison 1 Altered fractionation versus conventional radiotherapy, Outcome 3 Disease free survival.
Figuras y tablas -
Analysis 1.3

Comparison 1 Altered fractionation versus conventional radiotherapy, Outcome 3 Disease free survival.

Comparison 2 Summary analyses for altered fractionation versus conventional radiotherapy, Outcome 1 Total mortality.
Figuras y tablas -
Analysis 2.1

Comparison 2 Summary analyses for altered fractionation versus conventional radiotherapy, Outcome 1 Total mortality.

Comparison 2 Summary analyses for altered fractionation versus conventional radiotherapy, Outcome 2 Locoregional control.
Figuras y tablas -
Analysis 2.2

Comparison 2 Summary analyses for altered fractionation versus conventional radiotherapy, Outcome 2 Locoregional control.

Comparison 2 Summary analyses for altered fractionation versus conventional radiotherapy, Outcome 3 Disease free survival.
Figuras y tablas -
Analysis 2.3

Comparison 2 Summary analyses for altered fractionation versus conventional radiotherapy, Outcome 3 Disease free survival.

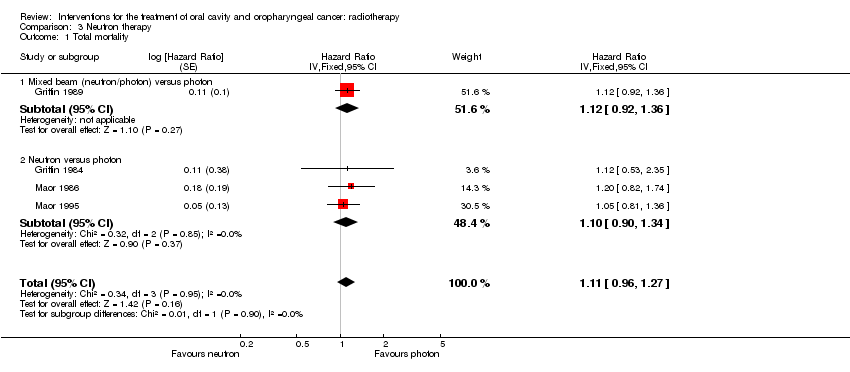
Comparison 3 Neutron therapy, Outcome 1 Total mortality.
Figuras y tablas -
Analysis 3.1

Comparison 3 Neutron therapy, Outcome 1 Total mortality.

Altered fractionation compared with conventional radiotherapy for the treatment of oral cavity and oropharyngeal cancer

Patient or population: people with oral cavity and oropharyngeal cancer

Settings: hospital

Intervention: altered fractionation

Comparison: conventional

Outcomes

Illustrative comparative risks* (95% CI)

Relative effect
(95% CI)

No of participants
(studies)

Quality of the evidence
(GRADE)

Comments

Assumed risk

Corresponding risk

Conventional

Altered fractionation

Mortality

(follow‐up: 5 years)

Low risk population

HR 0.86 (0.76 to 0.98)

[3751]
(13)

+OOO
very low2,3,4

Analysis conducted on all included studies

200 per 10001

175 per 1000
(156 to 196)

Medium risk population

500 per 1000

449 per 1000
(410 to 493)

High risk population

700 per 10001

645 per 1000
(599 to 693)

Mortality

(follow‐up: 5 years)

Low risk population

HR 0.93 (0.80 to 1.07)

[1511]
(5)

+++O
moderate2

Analysis conducted for studies at low risk of bias

200 per 10001

187 per 1000

(163 to 212)

Medium risk population

500 per 1000

475 per 1000

(426 to 524)

High risk population

700 per 10001

674 per 1000

(618 to 724)

*The basis for the assumed risk (e.g. the median control group risk across studies) is provided in footnotes. The corresponding risk (and its 95% confidence interval) is based on the assumed risk in the comparison group and the relative effect of the intervention (and its 95% CI).

CI: confidence interval; HR: hazard ratio.

GRADE Working Group grades of evidence
High quality: Further research is very unlikely to change our confidence in the estimate of effect.
Moderate quality: Further research is likely to have an important impact on our confidence in the estimate of effect and may change the estimate.
Low quality: Further research is very likely to have an important impact on our confidence in the estimate of effect and is likely to change the estimate.
Very low quality: We are very uncertain about the estimate.

1Based on data presented by McGurk 2005

2Studies included patients with other head and neck cancers

3Heterogeneity due to one study

4Assessed as unclear regarding allocation concealment, incomplete outcome data, selective reporting and/or other biases for 8 included trials

Figuras y tablas -
Table 1. Percentage of patients with oral cavity (OC) or oropharyngeal (OP) cancer in studies included in this review

Trial ID

%OC

%OP

Total % OC/OP

Ang 2001*

49

51

100

Bergermann 1992

100

0

100

Horiot 1992

0

100

100

Inoue 2001

100

0

100

Marcial 1993

0

100

100

Olmi 2003

 0

100

100

Pinto 1991

0

100

100

Sanguineti 2005*

100

Bourhis 2006

14

77

91

Bartelink 2002

33

47

80

Horiot 1997

16

64

80

Griffin 1989

27

52

79

Poulsen 2001

11

67

78

Maor 1986

26

51

77

Maor 1995

23

51

75

Hukku 1991

10

62

72

Dobrowsky 2000

30

41

71

Fu 2000

10

60

71

Lawrence 1974

45

26

71

Terz 1981

38

29

67

Ghoshal 2008

0

65

65

Cox 1990

20

44

64

Weissberg 1983

19

45

64

Fu 1995

11

51

61

MacDougall 1990

40

21

61

Marcial 1987

15

46

61

Griffin 1984

25

33

58

Ketcham 1969

56

unclear

>56

Bjarnason 2009

19

35

54

Skladowski 2006

22

28

50

*Data were available from the authors for those participants with cancer of the oral cavity or oropharynx only.

Figuras y tablas -
Table 1. Percentage of patients with oral cavity (OC) or oropharyngeal (OP) cancer in studies included in this review
Table 2. Results from comparisons where there are data from a single study only

Total mortality

Locoregional control

Disease free survival

Accelerated/split versus conventional

Marcial 1993

5 years

RR 1.17 (95% CI 0.57 to 2.43)

Split course versus accelerated

Hukku 1991

2 years

RR 1.00 (95% CI 0.82 to 1.22)

2 years

RR 1.33 (95% CI 0.67 to 2.67)

2 years

RR 0.83 (95% CI 0.29 to 2.42)

Variable total dose/duration of radiotherapy

Cox 1990

High versus standard

HR 1.08 (95% CI 0.69 to 1.70)

High versus standard

HR 0.78 (95% CI 0.55 to 1.11)

Low versus standard

HR 1.38 (95% CI 0.83 to 2.29)

Low versus standard

HR 1.13 (95% CI 0.78 to 1.64)

Morning versus afternoon radiotherapy

Bjarnason 2009

2 years

RR 1.09 (95% CI 0.74 to 1.59)

HR 0.92 (95% CI 0.60 to 1.42)

Mixed beam versus photon

Griffin 1989

HR 1.12 (95% CI 0.92 to 1.36)

HR 1.04 (95% CI 0.84 to 1.29)

Neutron versus photon

MacDougall 1990

5 years

RR 1.15 (95% CI 0.95 to 1.40)

5 years

RR 0.97 (95% CI 0.69 to 1.36)

5 years

RR 0.63 (95% CI 0.36 to 1.09)

Pre‐operative radiotherapy versus surgery alone

Ketcham 1969

Timing unclear

RR 0.63 (95% CI 0.28 to 1.46)

Terz 1981

HR 0.83 (95% CI 0.64 to 1.07)

Pre‐operative and post‐operative radiotherapy versus post‐operative radiotherapy alone

Bergermann 1992

HR 0.67 (95% CI 0.35 to 1.28)

HR 1.13 (95% CI 0.78 to 1.64)

HR 1.13 (95% CI 0.78 to 1.64)

Low dose rate interstitial radiotherapy versus high dose rate interstitial radiotherapy

Inoue 2001

HR 1.00 (95% CI 0.16 to 6.44)

CI = confidence interval; HR = hazard ratio; RR = risk ratio.

Figuras y tablas -
Table 2. Results from comparisons where there are data from a single study only
Table 3. Sensitivity analyses: altered fractionation versus conventional radiotherapy

All trials

Trials assessed as being at low risk of bias

Total mortality

HR 0.86 (95% CI 0.76 to 0.98)

(13 trials)

HR 0.93 (95% CI 0.80 to 1.07)

(5 trials)

Locoregional control

HR 0.79 (95% CI 0.70 to 0.89)

(11 trials)

HR 0.79 (95% CI 0.68 to 0.91)

(4 trials)

Disease free survival

HR 0.85 (95% CI 0.70 to 1.03)

(8 trials)

HR 0.95 (95% CI 0.0.74 to 1.22)*

(2 trials)

*Fixed‐effect model due to limited number of trials.
CI = confidence interval; HR = hazard ratio.

Figuras y tablas -
Table 3. Sensitivity analyses: altered fractionation versus conventional radiotherapy
Comparison 1. Altered fractionation versus conventional radiotherapy

Outcome or subgroup title

No. of studies

No. of participants

Statistical method

Effect size

1 Total mortality (using IPD where available) Show forest plot

13

Hazard Ratio (Fixed, 95% CI)

0.88 [0.82, 0.95]

1.1 Hyperfractionated versus conventional

3

Hazard Ratio (Fixed, 95% CI)

0.78 [0.68, 0.90]

1.2 Hyperfractionated/accelerated versus conventional

4

Hazard Ratio (Fixed, 95% CI)

0.87 [0.75, 1.00]

1.3 Hyperfractionated/accelerated/split versus conventional

4

Hazard Ratio (Fixed, 95% CI)

1.02 [0.90, 1.17]

1.4 Accelerated versus conventional

1

Hazard Ratio (Fixed, 95% CI)

0.27 [0.16, 0.47]

1.5 Accelerated/boost versus conventional

3

Hazard Ratio (Fixed, 95% CI)

0.95 [0.80, 1.13]

2 Locoregional control (using IPD where available) Show forest plot

11

Hazard Ratio (Fixed, 95% CI)

0.80 [0.73, 0.87]

2.1 Hyperfractionated versus conventional

3

Hazard Ratio (Fixed, 95% CI)

0.74 [0.62, 0.89]

2.2 Hyperfractionated/accelerated versus conventional

4

Hazard Ratio (Fixed, 95% CI)

0.84 [0.72, 0.99]

2.3 Hyperfractionated/accelerated/split versus conventional

4

Hazard Ratio (Fixed, 95% CI)

0.86 [0.74, 1.01]

2.4 Accelerated versus conventional

1

Hazard Ratio (Fixed, 95% CI)

0.26 [0.14, 0.50]

2.5 Accelerated/boost versus conventional

1

Hazard Ratio (Fixed, 95% CI)

0.78 [0.62, 0.99]

3 Disease free survival Show forest plot

8

Hazard Ratio (Fixed, 95% CI)

0.88 [0.80, 0.96]

3.1 Hyperfractionated versus conventional

1

Hazard Ratio (Fixed, 95% CI)

0.88 [0.72, 1.07]

3.2 Hyperfractionated/accelerated versus conventional

1

Hazard Ratio (Fixed, 95% CI)

0.87 [0.66, 1.14]

3.3 Hyperfractionated/accelerated/split versus conventional

2

Hazard Ratio (Fixed, 95% CI)

1.04 [0.88, 1.24]

3.4 Accelerated versus conventional

2

Hazard Ratio (Fixed, 95% CI)

0.68 [0.51, 0.91]

3.5 Accelerated/boost versus conventional

4

Hazard Ratio (Fixed, 95% CI)

0.82 [0.69, 0.96]

Figuras y tablas -
Comparison 1. Altered fractionation versus conventional radiotherapy
Comparison 2. Summary analyses for altered fractionation versus conventional radiotherapy

Outcome or subgroup title

No. of studies

No. of participants

Statistical method

Effect size

1 Total mortality Show forest plot

13

Hazard Ratio (Random, 95% CI)

0.86 [0.76, 0.98]

2 Locoregional control Show forest plot

11

Hazard Ratio (Random, 95% CI)

0.79 [0.70, 0.89]

3 Disease free survival Show forest plot

8

Hazard Ratio (Random, 95% CI)

0.85 [0.70, 1.03]

Figuras y tablas -
Comparison 2. Summary analyses for altered fractionation versus conventional radiotherapy
Comparison 3. Neutron therapy

Outcome or subgroup title

No. of studies

No. of participants

Statistical method

Effect size

1 Total mortality Show forest plot

4

Hazard Ratio (Fixed, 95% CI)

1.11 [0.96, 1.27]

1.1 Mixed beam (neutron/photon) versus photon

1

Hazard Ratio (Fixed, 95% CI)

1.12 [0.92, 1.36]

1.2 Neutron versus photon

3

Hazard Ratio (Fixed, 95% CI)

1.10 [0.90, 1.34]

Figuras y tablas -
Comparison 3. Neutron therapy