Scolaris Content Display Scolaris Content Display

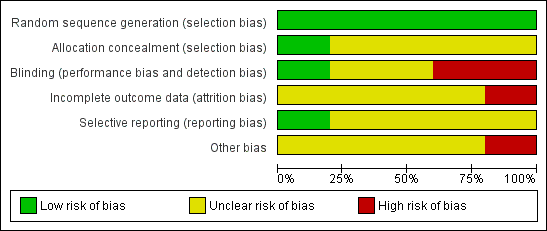
Risk of bias graph: review authors' judgements about each risk of bias item presented as percentages across all included studies.
Figuras y tablas -
Figure 1

Risk of bias graph: review authors' judgements about each risk of bias item presented as percentages across all included studies.

Risk of bias summary: review authors' judgements about each risk of bias item for each included study.
Figuras y tablas -
Figure 2

Risk of bias summary: review authors' judgements about each risk of bias item for each included study.

Comparison 1 CHLORPROMAZINE vs PLACEBO, Outcome 1 Leaving the study early.
Figuras y tablas -
Analysis 1.1

Comparison 1 CHLORPROMAZINE vs PLACEBO, Outcome 1 Leaving the study early.

Comparison 1 CHLORPROMAZINE vs PLACEBO, Outcome 2 Global state: not improved after 8 years (Psychiatric rating scale, not improved=1,2; improved=4,5).
Figuras y tablas -
Analysis 1.2

Comparison 1 CHLORPROMAZINE vs PLACEBO, Outcome 2 Global state: not improved after 8 years (Psychiatric rating scale, not improved=1,2; improved=4,5).

Comparison 1 CHLORPROMAZINE vs PLACEBO, Outcome 3 Rehospitalisation within 3 years ‐ completer.
Figuras y tablas -
Analysis 1.3

Comparison 1 CHLORPROMAZINE vs PLACEBO, Outcome 3 Rehospitalisation within 3 years ‐ completer.

Comparison 1 CHLORPROMAZINE vs PLACEBO, Outcome 4 Rehospitalisation within 3 years ‐ intent to treat.
Figuras y tablas -
Analysis 1.4

Comparison 1 CHLORPROMAZINE vs PLACEBO, Outcome 4 Rehospitalisation within 3 years ‐ intent to treat.

Comparison 1 CHLORPROMAZINE vs PLACEBO, Outcome 5 Adverse effects: various outcomes.
Figuras y tablas -
Analysis 1.5

Comparison 1 CHLORPROMAZINE vs PLACEBO, Outcome 5 Adverse effects: various outcomes.

Comparison 2 FLUPHENAZINE vs PLACEBO, Outcome 1 Leaving the study early.
Figuras y tablas -
Analysis 2.1

Comparison 2 FLUPHENAZINE vs PLACEBO, Outcome 1 Leaving the study early.

Comparison 2 FLUPHENAZINE vs PLACEBO, Outcome 2 Adverse effects: various outcomes.
Figuras y tablas -
Analysis 2.2

Comparison 2 FLUPHENAZINE vs PLACEBO, Outcome 2 Adverse effects: various outcomes.

Comparison 3 THIORIDAZINE vs PLACEBO, Outcome 1 Leaving the study early.
Figuras y tablas -
Analysis 3.1

Comparison 3 THIORIDAZINE vs PLACEBO, Outcome 1 Leaving the study early.

Comparison 3 THIORIDAZINE vs PLACEBO, Outcome 2 Adverse effects: various outcomes.
Figuras y tablas -
Analysis 3.2

Comparison 3 THIORIDAZINE vs PLACEBO, Outcome 2 Adverse effects: various outcomes.

Comparison 4 TRIFLUOPERAZINE vs PSYCHOTHERAPY, Outcome 1 Leaving the study early.
Figuras y tablas -
Analysis 4.1

Comparison 4 TRIFLUOPERAZINE vs PSYCHOTHERAPY, Outcome 1 Leaving the study early.

Comparison 4 TRIFLUOPERAZINE vs PSYCHOTHERAPY, Outcome 2 Global state: Overall Health Score ‐ Meninger Health Sickness Scale (higher score=better) 2‐years post‐discharge.
Figuras y tablas -
Analysis 4.2

Comparison 4 TRIFLUOPERAZINE vs PSYCHOTHERAPY, Outcome 2 Global state: Overall Health Score ‐ Meninger Health Sickness Scale (higher score=better) 2‐years post‐discharge.

Comparison 4 TRIFLUOPERAZINE vs PSYCHOTHERAPY, Outcome 3 Adverse effects: number of adverse events.
Figuras y tablas -
Analysis 4.3

Comparison 4 TRIFLUOPERAZINE vs PSYCHOTHERAPY, Outcome 3 Adverse effects: number of adverse events.

Comparison 5 TYPICAL ANTIPSYCHOTIC vs PSYCHOSOCIAL TREATMENT, Outcome 1 Global state: 1.Global Psychopathology Scale.
Figuras y tablas -
Analysis 5.1

Comparison 5 TYPICAL ANTIPSYCHOTIC vs PSYCHOSOCIAL TREATMENT, Outcome 1 Global state: 1.Global Psychopathology Scale.

Comparison 5 TYPICAL ANTIPSYCHOTIC vs PSYCHOSOCIAL TREATMENT, Outcome 2 Global state: 2. Global Improvement Scale.
Figuras y tablas -
Analysis 5.2

Comparison 5 TYPICAL ANTIPSYCHOTIC vs PSYCHOSOCIAL TREATMENT, Outcome 2 Global state: 2. Global Improvement Scale.

Comparison 1. CHLORPROMAZINE vs PLACEBO

Outcome or subgroup title

No. of studies

No. of participants

Statistical method

Effect size

1 Leaving the study early Show forest plot

3

353

Risk Ratio (M‐H, Fixed, 95% CI)

0.40 [0.29, 0.54]

2 Global state: not improved after 8 years (Psychiatric rating scale, not improved=1,2; improved=4,5) Show forest plot

1

40

Risk Ratio (M‐H, Fixed, 95% CI)

0.76 [0.53, 1.11]

3 Rehospitalisation within 3 years ‐ completer Show forest plot

1

80

Risk Ratio (M‐H, Fixed, 95% CI)

2.29 [1.31, 4.03]

4 Rehospitalisation within 3 years ‐ intent to treat Show forest plot

1

127

Risk Ratio (M‐H, Fixed, 95% CI)

2.30 [1.50, 3.54]

5 Adverse effects: various outcomes Show forest plot

1

Risk Ratio (M‐H, Fixed, 95% CI)

Subtotals only

5.1 drowsiness

1

162

Risk Ratio (M‐H, Fixed, 95% CI)

5.65 [2.72, 11.73]

5.2 restlessness

1

162

Risk Ratio (M‐H, Fixed, 95% CI)

1.19 [0.83, 1.71]

5.3 constipation

1

162

Risk Ratio (M‐H, Fixed, 95% CI)

2.71 [1.37, 5.35]

5.4 nausea or upper gastrointestinal distress

1

162

Risk Ratio (M‐H, Fixed, 95% CI)

6.17 [1.92, 19.79]

5.5 dryness of mouth or throat

1

162

Risk Ratio (M‐H, Fixed, 95% CI)

4.63 [1.67, 12.82]

5.6 dizziness, faintness or weakness

1

162

Risk Ratio (M‐H, Fixed, 95% CI)

4.41 [1.59, 12.29]

5.7 muscle rigidity

1

162

Risk Ratio (M‐H, Fixed, 95% CI)

1.54 [0.60, 3.97]

5.8 nasal congestion

1

162

Risk Ratio (M‐H, Fixed, 95% CI)

2.10 [0.69, 6.43]

5.9 facial rigidity

1

162

Risk Ratio (M‐H, Fixed, 95% CI)

2.31 [0.77, 6.96]

5.10 tremor of hands, arms or face

1

162

Risk Ratio (M‐H, Fixed, 95% CI)

1.05 [0.29, 3.77]

5.11 headache

1

162

Risk Ratio (M‐H, Fixed, 95% CI)

0.84 [0.33, 2.13]

5.12 loss of associated movements

1

162

Risk Ratio (M‐H, Fixed, 95% CI)

1.26 [0.22, 7.35]

5.13 akathesis‐restlessness of feet

1

162

Risk Ratio (M‐H, Fixed, 95% CI)

1.40 [0.35, 5.67]

Figuras y tablas -
Comparison 1. CHLORPROMAZINE vs PLACEBO
Comparison 2. FLUPHENAZINE vs PLACEBO

Outcome or subgroup title

No. of studies

No. of participants

Statistical method

Effect size

1 Leaving the study early Show forest plot

1

240

Risk Ratio (M‐H, Fixed, 95% CI)

0.51 [0.34, 0.77]

2 Adverse effects: various outcomes Show forest plot

1

Risk Ratio (M‐H, Fixed, 95% CI)

Subtotals only

2.1 drowsiness

1

165

Risk Ratio (M‐H, Fixed, 95% CI)

4.07 [1.92, 8.62]

2.2 restlessness

1

165

Risk Ratio (M‐H, Fixed, 95% CI)

0.90 [0.60, 1.34]

2.3 constipation

1

165

Risk Ratio (M‐H, Fixed, 95% CI)

2.26 [1.12, 4.54]

2.4 nausea or upper gastrointestinal distress

1

165

Risk Ratio (M‐H, Fixed, 95% CI)

1.36 [0.33, 5.49]

2.5 dryness of mouth or throat

1

165

Risk Ratio (M‐H, Fixed, 95% CI)

3.46 [1.22, 9.83]

2.6 dizziness, faintness, weakness

1

165

Risk Ratio (M‐H, Fixed, 95% CI)

2.24 [0.74, 6.73]

2.7 muscle rigidity

1

165

Risk Ratio (M‐H, Fixed, 95% CI)

2.98 [1.28, 6.97]

2.8 nasal congestion

1

165

Risk Ratio (M‐H, Fixed, 95% CI)

2.24 [0.74, 6.73]

2.9 facial rigidity

1

165

Risk Ratio (M‐H, Fixed, 95% CI)

2.64 [0.90, 7.77]

2.10 tremor of hands, arms, face

1

165

Risk Ratio (M‐H, Fixed, 95% CI)

2.24 [0.74, 6.73]

2.11 headache

1

165

Risk Ratio (M‐H, Fixed, 95% CI)

1.12 [0.47, 2.64]

2.12 loss of associated movements

1

165

Risk Ratio (M‐H, Fixed, 95% CI)

7.32 [1.75, 30.53]

2.13 akathesis‐restlessness of feet

1

165

Risk Ratio (M‐H, Fixed, 95% CI)

3.52 [1.04, 11.90]

Figuras y tablas -
Comparison 2. FLUPHENAZINE vs PLACEBO
Comparison 3. THIORIDAZINE vs PLACEBO

Outcome or subgroup title

No. of studies

No. of participants

Statistical method

Effect size

1 Leaving the study early Show forest plot

1

236

Risk Ratio (M‐H, Fixed, 95% CI)

0.44 [0.28, 0.69]

2 Adverse effects: various outcomes Show forest plot

1

Risk Ratio (M‐H, Fixed, 95% CI)

Subtotals only

2.1 drowsiness

1

165

Risk Ratio (M‐H, Fixed, 95% CI)

5.46 [2.62, 11.36]

2.2 restlessness

1

165

Risk Ratio (M‐H, Fixed, 95% CI)

1.01 [0.69, 1.48]

2.3 constipation

1

165

Risk Ratio (M‐H, Fixed, 95% CI)

1.72 [0.83, 3.57]

2.4 nausea or upper gastrointestinal distress

1

165

Risk Ratio (M‐H, Fixed, 95% CI)

8.13 [2.58, 25.59]

2.5 dryness of mouth or throat

1

165

Risk Ratio (M‐H, Fixed, 95% CI)

5.69 [2.09, 15.50]

2.6 dizziness, faintness, weakness

1

165

Risk Ratio (M‐H, Fixed, 95% CI)

4.47 [1.61, 12.41]

2.7 muscle rigidity

1

165

Risk Ratio (M‐H, Fixed, 95% CI)

0.54 [0.16, 1.85]

2.8 nasal congestion

1

165

Risk Ratio (M‐H, Fixed, 95% CI)

3.25 [1.14, 9.31]

2.9 facial rigidity

1

165

Risk Ratio (M‐H, Fixed, 95% CI)

1.63 [0.51, 5.19]

2.10 tremor of hands, arms, face

1

165

Risk Ratio (M‐H, Fixed, 95% CI)

2.44 [0.82, 7.25]

2.11 headache

1

165

Risk Ratio (M‐H, Fixed, 95% CI)

0.81 [0.32, 2.06]

2.12 loss of associated movements

1

165

Risk Ratio (M‐H, Fixed, 95% CI)

0.16 [0.01, 3.34]

2.13 akathesis‐restlessness of feet

1

165

Risk Ratio (M‐H, Fixed, 95% CI)

1.36 [0.33, 5.49]

Figuras y tablas -
Comparison 3. THIORIDAZINE vs PLACEBO
Comparison 4. TRIFLUOPERAZINE vs PSYCHOTHERAPY

Outcome or subgroup title

No. of studies

No. of participants

Statistical method

Effect size

1 Leaving the study early Show forest plot

1

94

Risk Ratio (M‐H, Fixed, 95% CI)

0.96 [0.25, 3.61]

2 Global state: Overall Health Score ‐ Meninger Health Sickness Scale (higher score=better) 2‐years post‐discharge Show forest plot

1

92

Mean Difference (IV, Fixed, 95% CI)

5.80 [1.61, 9.99]

3 Adverse effects: number of adverse events Show forest plot

1

162

Risk Ratio (M‐H, Fixed, 95% CI)

5.65 [2.72, 11.73]

Figuras y tablas -
Comparison 4. TRIFLUOPERAZINE vs PSYCHOTHERAPY
Comparison 5. TYPICAL ANTIPSYCHOTIC vs PSYCHOSOCIAL TREATMENT

Outcome or subgroup title

No. of studies

No. of participants

Statistical method

Effect size

1 Global state: 1.Global Psychopathology Scale Show forest plot

1

89

Mean Difference (IV, Fixed, 95% CI)

0.01 [‐0.55, 0.57]

2 Global state: 2. Global Improvement Scale Show forest plot

1

89

Mean Difference (IV, Fixed, 95% CI)

‐0.03 [‐0.49, 0.43]

Figuras y tablas -
Comparison 5. TYPICAL ANTIPSYCHOTIC vs PSYCHOSOCIAL TREATMENT