Flufenazina (oral) versus placebo para la esquizofrenia
Resumen
Antecedentes
La flufenazina es uno de los primeros medicamentos clasificados como "antipsicóticos" y ha estado ampliamente disponible durante cinco décadas.
Objetivos
Comparar los efectos de la flufenazina oral con el placebo para el tratamiento de la esquizofrenia. Evaluar cualquier estudio económico disponible y valorar los datos de los resultados.
Métodos de búsqueda
Se realizaron búsquedas en el registro de ensayos del Grupo Cochrane de Esquizofrenia (23 de julio de 2013, 23 de diciembre de 2014, 9 de noviembre de 2016 y 28 de diciembre de 2017 ), que se basa en búsquedas regulares en CINAHL, BIOSIS, AMED, EMBASE, PubMed, MEDLINE, PsycINFO y en registros de ensayos clínicos. No hay limitaciones de idioma, fecha, tipo de documento o estado de publicación para la inclusión de los archivos en el registro.
Criterios de selección
Se buscaron todos los ensayos controlados aleatorizados que compararan la flufenazina oral con un placebo relevante para los pacientes con esquizofrenia. Los principales resultados de interés fueron el estado general y los efectos adversos.
Obtención y análisis de los datos
En cuanto a los efectos de las intervenciones, un equipo de la revisión inspeccionó las citas y los resúmenes de forma independiente, ordenó documentos y volvió a inspeccionar y evaluar la calidad de los ensayos. Los datos se extrajeron de forma independiente. Los datos dicotómicos se analizaron mediante el riesgo relativo (RR) de efectos fijos y el intervalo de confianza (IC) del 95%. Se excluyeron los datos continuos si más del 50% de las personas se perdieron durante el seguimiento, pero, cuando fue posible, se calcularon las diferencias medias (DM). Un equipo de revisión económica buscó y seleccionó de manera fiable los estudios económicos para proporcionar un resumen económico de los datos disponibles. Cuando no se encontraron estudios económicos relevantes que cumplieran los requisitos para la inclusión, el equipo de revisión económica valoró los datos de resultado de la efectividad ya incluidos para proporcionar un resumen económico rudimentario.
Resultados principales
De más de 1200 registros electrónicos de 415 estudios identificados por la búsqueda inicial y esta búsqueda actualizada, se excluyeron 48 estudios potencialmente relevantes y se incluyeron siete ensayos publicados entre 1964 y 1999 que asignaron al azar a 439 (en su mayoría participantes adultos). No se identificaron nuevos ensayos incluidos para esta actualización de la revisión. En comparación con el placebo, los resultados del estado global de "no mejoró o empeoró" no fueron significativamente diferentes a mediano plazo en un estudio pequeño (n = 50, 1 ECA, RR 1,12; IC: 0,79 a 1,58, muy baja calidad de la evidencia). El riesgo de recaída a largo plazo fue mayor en dos estudios pequeños en personas que recibieron placebo (n = 86, 2 ECA, RR 0,39; IC: 0,05 a 3,31, muybaja calidad de la evidencia), aunque con un alto grado de heterogeneidad en los resultados. En el mismo pequeño estudio se informó de que sólo una persona a la que se había asignado flufenazina había muerto durante el seguimiento a largo plazo (n = 50, 1 ECA, RR 2,38; IC: 0,10 a 55,72, baja calidad de la evidencia). Los efectos adversos extrapiramidales a corto plazo fueron significativamente más frecuentes con la flufenazina en comparación con el placebo en otros dos estudios para los resultados de la acatisia (n = 227, 2 ECA, RR 3,43; IC: 1,23 a 9,56, calidad moderada de la evidencia) y la rigidez (n = 227, 2 ECA, RR 3,54; IC: 1,76 a 7,14, calidad moderada de la evidencia). En cuanto a los resultados económicos, se valoraron los resultados de la recaída y se presentaron en tablas adicionales.
Conclusiones de los autores
Los hallazgos de esta revisión confirman mucho de lo que los clínicos y los receptores de la atención ya saben, pero proporcionan una cuantificación para apoyar la impresión clínica. La posición mundial de la flufenazina como tratamiento eficaz de las psicosis no se ve amenazada por el resultado de esta revisión. Sin embargo, la flufenazina es un tratamiento imperfecto y, si se puede acceder, otros fármacos de bajo coste menos asociados con los efectos adversos pueden ser una opción igualmente eficaz para los pacientes con esquizofrenia.
PICO
Resumen en términos sencillos
Flufenazina (oral) versus placebo para la esquizofrenia
Pregunta de la revisión: ¿Es la flufenazina efectiva para el tratamiento de la esquizofrenia en comparación con el placebo?
Antecedentes
La flufenazina es uno de los primeros medicamentos clasificados como "antipsicóticos" y ha estado ampliamente disponible durante décadas.
Búsqueda de la evidencia
En diciembre de 2017 se actualizó la búsqueda electrónica de ensayos que asignaron al azar a pacientes con esquizofrenia para que recibieran flufenazina o placebo por vía oral. No se encontraron nuevos estudios que se añadieran en esta actualización.
Evidencia encontrada
Siete ensayos cumplieron los requisitos de la revisión y proporcionaron datos utilizables. La evidencia de que se dispone actualmente es de mala calidad y sugiere que, si bien la flufenazina es un antipsicótico potente y eficaz, tiene considerables efectos secundarios.
Conclusiones
Los fármacos antipsicóticos son la primera línea y el pilar del tratamiento de la esquizofrenia. Ayudan a tratar eficazmente los síntomas psicóticos como oír voces y ver cosas (alucinaciones) y tener creencias extrañas (delirios). La flufenazina fue uno de los primeros antipsicóticos y está disponible desde hace unos 50 años. La flufenazina es barata y en los países en vías de desarrollo puede ser uno de los únicos tratamientos farmacológicos disponibles. En la mayor parte de Europa y Norteamérica, a pesar de que todavía se dispone de ellas, la llegada de nuevos medicamentos antipsicóticos ha reducido el uso de la flufenazina y su cuota de mercado. La flufenazina tiene efectos secundarios debilitantes, entre ellos: mareos; trastornos del movimiento, como movimientos involuntarios o espasmos; temblores y sacudidas; inquietud interior y la incapacidad de permanecer sentado; y problemas de presión arterial, fiebre y rigidez muscular.
Esta revisión incluyó siete estudios y comparó los efectos de la flufenazina tomada por vía oral con el placebo (tratamiento "simulado"). En general, las conclusiones de la revisión apoyan la opinión generalizada de que la flufenazina es un antipsicótico potente y eficaz, pero que tiene considerables efectos secundarios, por lo que tal vez sea preferible utilizar otros medicamentos antipsicóticos. La flufenazina es un tratamiento imperfecto con graves efectos secundarios, por lo que otros medicamentos antipsicóticos de bajo coste y con menos efectos secundarios pueden ser mejores para los pacientes con esquizofrenia. A pesar de ello, la flufenazina es de bajo coste y está ampliamente disponible, por lo que es probable que siga siendo uno de los tratamientos más utilizados para la esquizofrenia en todo el mundo. Sin embargo, algunos de los efectos secundarios de la flufenazina podrían ser costosos en términos de sufrimiento humano y coste personal del tratamiento. Aunque la flufenazina se ha utilizado como medicamento antipsicótico durante decenios, todavía hay un número sorprendentemente pequeño de estudios bien realizados que miden su efectividad y su potencial para causar efectos secundarios. Las futuras investigaciones a gran escala deberían informar sobre resultados importantes como la mejora de la salud mental, la recaída, el alta e ingreso en el hospital, los niveles de satisfacción con el tratamiento y la calidad de vida.
Este resumen en términos sencillos ha sido redactado por el consumidor, Ben Gray de RETHINK.
Authors' conclusions
Summary of findings
| ORAL FLUPHENAZINE versus PLACEBO for Schizophrenia | ||||||
| Patient or population: patients with Schizophrenia | ||||||
| Outcomes | Illustrative comparative risks* (95% CI) | Relative effect | No of Participants | Quality of the evidence | Comments | |
|---|---|---|---|---|---|---|
| Assumed risk | Corresponding risk | |||||
| Control | ORAL FLUPHENAZINE versus PLACEBO | |||||
| Global state: Not improved or worsened ‐ medium term | 680 per 10001 | 762 per 1000 | RR 1.12 | 50 | ⊕⊝⊝⊝ | |
| Global state: Relapse ‐ long term | Low | RR 0.39 | 86 | ⊕⊝⊝⊝ | Note: high degree of heterogeneity between included studies. | |
| 200 per 10001,4 | 78 per 1000 | |||||
| Moderate | ||||||
| 600 per 10001,4 | 234 per 1000 | |||||
| High | ||||||
| 800 per 10001,4 | 312 per 1000 | |||||
| Adverse effects: Death ‐ long term | Low7 | RR 2.38 | 50 | ⊕⊕⊝⊝ | ||
| 0 per 1000 | 0 per 1000 | |||||
| Moderate7 | ||||||
| 30 per 1000 | 71 per 1000 | |||||
| High7 | ||||||
| 90 per 1000 | 214 per 1000 | |||||
| Adverse effects: Extrapyramidal effects (akathisia) ‐ short term | Low8 | RR 3.43 | 227 | ⊕⊕⊕⊝ | ||
| 0 per 1000 | 0 per 1000 | |||||
| Moderate8 | ||||||
| 100 per 1000 | 343 per 1000 | |||||
| High8 | ||||||
| 200 per 1000 | 686 per 1000 | |||||
| Adverse effects: Extrapyramidal effects (rigidity) ‐ short term | Low10 | RR 3.54 | 227 | ⊕⊕⊕⊝ | ||
| 50 per 1000 | 177 per 1000 | |||||
| Moderate10 | ||||||
| 250 per 1000 | 885 per 1000 | |||||
| High10 | ||||||
| 500 per 1000 | 1000 per 1000 | |||||
| *The basis for the assumed risk (e.g. the median control group risk across studies) is provided in footnotes. The corresponding risk (and its 95% confidence interval) is based on the assumed risk in the comparison group and the relative effect of the intervention (and its 95% CI). | ||||||
| GRADE Working Group grades of evidence | ||||||
| 1 Mean baseline risk presented for single study. Key: High quality ‐ no downgrading of the evidence. | ||||||
Background
Description of the condition
One in every 10,000 people per year is diagnosed with schizophrenia, with a lifetime prevalence of about 1% (Jablensky 1992). It often runs a chronic course with acute exacerbations and often partial remissions. Over the past few decades, a large body of evidence has accumulated linking excessive dopamine transmission to psychosis and more direct evidence emerges from neuro‐imaging studies which showed an increased dopamine synthesis (Hietala 1995; Lindstrom 1999; Meyer 2002), an exaggerated release of dopamine and a higher than normal levels of dopamine at baseline (Abi‐Dargham 2000; Gjedde 2001). The antipsychotic group of drugs with its anti‐dopaminergic effects is the mainstay treatment for this illness (Dencker 1980). These are generally regarded as highly effective, especially in controlling such symptoms as hallucinations and fixed false beliefs (delusions) (Kane 1986). Moreover, they seem to reduce the risk of acute relapse. A systematic review undertaken two decades ago also suggested that, for those with serious mental illness, stopping antipsychotics resulted in 58% of people relapsing, whereas only 16% of those who were still on the drugs became acutely ill within a one‐year period (Davis 1986).
Schizophrenia usually begins in young adulthood and has a lifetime prevalence of about 1% irrespective of culture, social class and race. Schizophrenia is a chronic relapsing mental illness, characterised by symptoms such as hallucinations, delusions, disordered thinking, and emotional withdrawal. Antipsychotic drugs are effective for controlling florid symptoms such as hallucinations and delusions but are less effective for treating emotional withdrawal. Antipsychotics are associated with adverse effects such as movement disorders, and the overall cost of the illness to the individual, their carers and the community is considerable.
Description of the intervention
Fluphenazine, a phenothiazine derivative, was one of the first drugs to be classed as an 'antipsychotic' and was approved by the FDA in 1959. In Britain it was first used for the relief of anxiety. The American reports, however, were the first to indicate its value in psychotic illness (Darling 1959; Holt 1960). Fluphenazine has trifluoromethyl and piperazine groups which bring about increase in potency that in many pharmacodynamic properties may be about 40 times as potent as chlorpromazine. This is associated with a rapid and prolonged action, relatively little sedative activity and little or no increase in autonomic and haemodynamic effects.
Fluphenazine is an inexpensive and widely accessible antipsychotic drug that has been available to treat people with schizophrenia for five decades. In this review, for perhaps the first time, we objectively quantify the effects of oral administration of fluphenazine in comparison with placebo. It is indeed a potent antipsychotic but with considerable adverse effects. Other drugs may well be preferable.
How the intervention might work
Fluphenazine is thought to elicit its antipsychotic effects via interference with central dopaminergic pathways and blocking receptors, particularly D2, in the mesolimbic zone of the brain. Extrapyramidal side effects are a result of interaction with dopaminergic pathways in the basal ganglia. As fluphenazine is not specific to one action within the body, it is known to cause adverse effects ranging from orthostatic hypotension as a result of its alpha adrenergic blocking activity to anticholinergic and extrapyramidal symptoms (tardive dyskinesia, pseudo‐parkinsonism, dystonia, dyskinesia, akathisia). In addition, the use of fluphenazine has been associated with a potentially fatal disturbance of blood pressure, temperature and muscle control (neuroleptic malignant syndrome). As with all antipsychotic medications, fluphenazine is characterised by inter‐individual variability in pharmacokinetics, most marked with the oral preparation. It is extensively metabolised, undergoing 'first pass' metabolism by the liver and is excreted in both the urine and faeces. Fluphenazine is highly protein‐bound (greater than 90%) in plasma. With oral fluphenazine, peak plasma/serum levels are attained within a few hours. The serum half‐life of it is approximately 15 hours. Fluphenazine crosses the blood‐brain barrier, crosses the placenta easily and cannot be removed by dialysis (Wikipedia 2006).
Why it is important to do this review
Fluphenazine is still one of the drugs commonly used for people with schizophrenia and is given by mouth or short‐acting injection. Although we have not found precise data on how much fluphenazine is used worldwide, it is one of the World Health Organization's Essential Drugs (WHO 2005) and in the developing world, where non‐proprietary preparations of fluphenazine are inexpensive, it may be one of the only drug treatments available. However, although it is still available in most of Europe and North America, the arrival of a newer generation of antipsychotic drugs has reduced its market share in the respective countries. This version of the review updates our past work (Matar 2007a; Matar 2007b). This is an update of a Cochrane Review first published in 2007 (Issue 1) of The Cochrane Database of Systematic Reviews.
In terms of the costs of schizophrenia, this was estimated at about £6.7 billion in England in 2004/05, of which the direct costs were £2 million while the indirect costs accounted for the rest (Mangalore 2007). Based on the only available BNF costs from 1999 (BNF 1999), oral fluphenazine (hydrochloride) costs approximately 1.77 pence per 1mg tablet, which based on a maximum therapeutic dose of 20mg per day, ranges to 35p per person per day. The newer, atypical antipsychotics in comparison are more expensive than typical antipsychotics, with olanzapine available at £13.11 for 28 five milligram tablets, and clozapine (Clozaril) at £21.56 for 28 one hundred milligram tablets.
It is essential to complement the clinical effectiveness of oral fluphenazine with its cost‐effectiveness; Davies et al. (Davies 2007) conducted a study on cost‐effectiveness of the first generation antipsychotics (i.e. flupentixol, trifluoperazine, chlorpromazine) and the second generation antipsychotics (i.e. risperidone, olanzapine, amisulpiride). The study findings argue that there is no evidence to suggest that atypical (second generation) antipsychotics are more cost‐effective than typical (first generation) antipsychotics.
Objectives
To compare the effects of oral fluphenazine with placebo for the treatment of schizophrenia.
For an economic review team to critically appraise and summarise current evidence on the resource use, cost and cost‐effectiveness of trifluoperazine for schizophrenia.
Methods
Criteria for considering studies for this review
Types of studies
We included all relevant randomised controlled trials. We included trials that are described as 'double blind' ‐ in which randomisation is implied ‐ in a sensitivity analysis (see Sensitivity analysis). We excluded quasi‐randomised studies, such as those that allocate intervention by alternate days of the week. Where people are given additional treatments as well as oral fluphenazine, we only included data if the adjunct treatment was evenly distributed between groups and it was only the fluphenazine or placebo that is randomised.
With regards to selecting studies for economic evaluations, two review authors graded studies as per the following:
Grade A ‐ Full economic evaluation: studies that focus on cost‐effectiveness analysis, cost‐utility analysis and cost benefit analysis.
Grade B ‐ Partial economic evaluation: studies that focus on cost‐analysis, cost‐minimisation studies and cost‐description of oral fluphenazine.
Grade C ‐ Randomised trials that reported limited information, such as estimates of resources use or costs associated with oral fluphenazine.
Types of participants
Adults, however defined, with schizophrenia or related disorders, including schizophreniform disorder, schizoaffective disorder and delusional disorder, by any means of diagnosis.
We are interested in making sure that information is as relevant as possible to the current care of people with schizophrenia, so highlighted the current clinical state clearly (acute, early post‐acute, partial remission, remission), as well as the stage (prodromal, first episode, early illness, persistent), and whether the studies primarily focused on people with particular problems (for example, negative symptoms, treatment‐resistant illnesses).
Types of interventions
1. Fluphenazine: any dose of only oral administration
2. Placebo: (active or inactive) or no treatment
Types of outcome measures
Where possible, outcomes were made binary by dividing them into two categories ‐ 'clinically significant change' and 'no clinically significant change'.
We categorised outcomes as short term (0‐8 weeks), medium term (9 to 26 weeks) and long term (27 weeks to 104 weeks).
Primary outcomes
1. Global state
1.1 Not improved or worsened
2. Adverse effects
2.1 General
2.2 Specific
2.2.1 Extrapyramidal symptoms (parkinsonian symptoms, dystonia, akathisia, and tardive dyskinesia)
2.2.2 Anticholinergic symptoms
2.2.3 Others
Secondary outcomes
1. Global state
1.1 Relapse
1.2 Time in exacerbated state
1.3 Leaving the study early
1.4 Length of stay in hospital
1.5 Satisfaction with treatment ‐ participant/carer
1.6 Death
2. Mental state
2.1 General symptoms
2.2 Specific symptoms
2.2.1 Positive symptoms (delusions, hallucinations, disordered thinking)
2.2.2 Negative symptoms (avolition, poor self‐care, blunted affect)
2.2.3 Mood ‐ depression
3. Behaviour
3.1 General behaviour
3.2 Specific behaviours (e.g. aggressive or violent behaviour)
3.2.1 Social functioning
3.2.2 Employment status during trial (employed/unemployed)
3.2.3 Occurrence of violent incidents (to self, others or property)
4. Economic
4.1 Cost of care
5. 'Summary of findings' table
We used the GRADE approach to interpret findings (Schünemann 2008); and used GRADE profiler to import data from RevMan 5 to create 'Summary of findings' tables (GRADEpro; Review Manager). These tables provided outcome‐specific information concerning the overall quality of evidence from each included study in the comparison, the magnitude of effect of the interventions examined, and the sum of available data on all outcomes we rated as important to patient care and decision making. We selected the following main outcomes for inclusion in the 'Summary of findings' table:
-
Global state ‐ not improved or worsened ‐ medium term.
-
Relapse ‐ long term.
-
Adverse effects: death ‐ long term.
-
Adverse effects: extrapyramidal effects (akathisia) ‐ short term.
-
Adverse effects: extrapyramidal effects (rigidity) ‐ short term.
Search methods for identification of studies
Electronic searches
Cochrane Schizophrenia Group’s Study‐Based Register of Trials
On 23 December 2014 and 9 November 2016, the information specialist searched the register using the following search strategy:
(*Fluphenazine* AND *Placebo*) in Intervention Field of STUDY
In such study‐based register, searching the major concept retrieves all the synonyms and relevant studies because all the studies have already been organised based on their interventions and linked to the relevant topics.
This register is compiled by systematic searches of major resources (including AMED, BIOSIS, CINAHL, EMBASE, MEDLINE, PsycINFO, PubMed, and registries of clinical trials) and their monthly updates, hand‐searches, grey literature, and conference proceedings (see Group’s Module). There is no language, date, document type, or publication status limitations for inclusion of records into the register.
For previous searches, please see Appendix 1.
Searching other resources
1. Reference searching
We inspected references of all identified studies for further relevant studies.
2. Personal contact
We contacted the first author of each included study for information regarding unpublished trials.
Data collection and analysis
Methods used in data collection and analysis for this update are below; for previous methods please see Appendix 2 and Appendix 3.
Selection of studies
Review authors HEM and MQA will independently inspect citations from the searches and identify relevant abstracts; SJS independently re‐inspected a random 20% sample of these abstracts to ensure reliability of selection. Where disputes arose, we acquired the full report for more detailed scrutiny. HEM then obtained and inspected full reports of the abstracts or reports meeting the review criteria. SJSre‐inspected a random 20% of these full reports in order to ensure reliability of selection. Where it was not possible to resolve disagreement by discussion, we attempted to contact the authors of the study concerned for clarification.
Data extraction and management
1. Extraction
Review authors (HEM, MQA) extracted data from all included studies. In addition, to ensure reliability, SJS independently extracted data from a random sample of these studies, comprising 10% of the total. We attempted to extract data presented only in graphs and figures whenever possible, but included only if two reviewers independently obtain the same result. If studies were multi‐centre, then where possible we extracted data relevant to each. We discussed any disagreement and documented our decisions. If necessary, we attempted to contact authors through an open‐ended request in order to obtain missing information or for clarification. HEM helped clarify issues regarding any remaining problems and we documented these final decisions.
2. Management
2.1 Forms
We extracted data onto standard, simple forms.
We included continuous data from rating scales only if:
a) the psychometric properties of the measuring instrument have been described in a peer‐reviewed journal (Marshall 2000); and
b) the measuring instrument has not been written or modified by one of the trialists for that particular trial.
c) the instrument was a global assessment of an area of functioning and not sub‐scores which are not, in themselves, validated or shown to be reliable. However there are exceptions, we included sub‐scores from mental state scales measuring positive and negative symptoms of schizophrenia.
Ideally the measuring instrument should either be i. a self‐report or ii. completed by an independent rater or relative (not the therapist). We realise that this is not often reported clearly; in 'Description of studies' noted if this was the case or not.
2.3 Endpoint versus change data
There are advantages of both endpoint and change data: change data can remove a component of between‐person variability from the analysis; however, calculation of change needs two assessments (baseline and endpoint) that can be difficult to obtain in unstable and difficult‐to‐measure conditions such as schizophrenia. We decided primarily to use endpoint data, and only use change data if the former were not available. If necessary, combined endpoint and change data in the analysis, as we prefered to use mean differences (MDs) rather than standardised mean differences (SMDs) throughout (Higgins 2011).
2.4 Skewed data
Continuous data on clinical and social outcomes are often not normally distributed. To avoid the pitfall of applying parametric tests to non‐parametric data, we applied the following standards to relevant continuous data before inclusion.
For endpoint data from studies including fewer than 200 participants:
a) when a scale starts from the finite number zero, we subtracted the lowest possible value from the mean, and divide this by the standard deviation. If this value is lower than one, it strongly suggests that the data are skewed and we excluded these data. If this ratio is higher than one but less than two, there is suggestion that the data are skewed: we entered these data and test whether their inclusion or exclusion would change the results substantially. Finally, if the ratio is larger than two we included these data, because it is less likely that they are skewed (Altman 1996; Higgins 2011).
b) if a scale starts from a positive value (such as the Positive and Negative Syndrome Scale (PANSS), which can have values from 30 to 210 (Kay 1986)), we modified the calculation described above to take the scale starting point into account. In these cases skewed data are present if 2 SD > (S − S min), where S is the mean score and 'S min' is the minimum score.
Please note: we entered all relevant data from studies of more than 200 participants in the analysis irrespective of the above rules, because skewed data pose less of a problem in large studies. We also entered all relevant change data, as when continuous data are presented on a scale that includes a possibility of negative values (such as change data), it is difficult to tell whether or not data are skewed.
2.5 Common measurement
To facilitate comparison between trials we, where relevant, converted variables that can be reported in different metrics, such as days in hospital (mean days per year, per week or per month) to a common metric (e.g. mean days per month).
2.6 Conversion of continuous to binary
Where possible, we made efforts to convert outcome measures to dichotomous data. This can be done by identifying cut‐off points on rating scales and dividing participants accordingly into 'clinically improved' or 'not clinically improved'. It is generally assumed that if there is a 50% reduction in a scale‐derived score such as the Brief Psychiatric Rating Scale (BPRS) (Overall 1962), or the PANSS (Kay 1986), this could be considered as a clinically significant response (Leucht 2005, Leucht 2005). If data based on these thresholds were not available, we used the primary cut‐off presented by the original authors.
2.7 Direction of graphs
Where possible, we entered data in such a way that the area to the left of the line of no effect indicates a favourable outcome for insert your intervention here. Where keeping to this made it impossible to avoid outcome titles with clumsy double‐negatives (e.g. 'not un‐improved') we reported data where the left of the line indicates an unfavourable outcome and noted this in the relevant graphs.
Assessment of risk of bias in included studies
Review authors insert relevant initials here worked independently to assess risk of bias by using criteria described in the Cochrane Handbook for Systematic Reviews of Interventions to assess trial quality (Higgins 2011a). This set of criteria is based on evidence of associations between potential overestimation of effect and the level of risk of bias of the article that may be due to aspects of sequence generation, allocation concealment, blinding, incomplete outcome data and selective reporting, or the way in which these 'domains' are reported.
If the raters disagreed, we made the final rating by consensus, with the involvement of another member of the review group. Where inadequate details of randomisation and other characteristics of trials are provided, we attempted to contact authors of the studies in order to obtain further information. We reported non‐concurrence in quality assessment, but if disputes arise regarding the category to which a trial is to be allocated, we resolved this by discussion.
We noted the level of risk of bias in both the text of the review, Figure 1, Figure 2, and the 'summary of findings Table 1.

Study flow diagram: 2006 search.
Study flow diagram: 2012 update search (no additional studies).
Measures of treatment effect
1. Binary data
For binary outcomes we calculated a standard estimation of the risk ratio (RR) and its 95% confidence interval (CI), as it has been shown that RR is more intuitive than odds ratios (Boissel 1999); and that odds ratios tend to be interpreted as RR by clinicians (Deeks 2000). Although the number needed to treat for an additional beneficial outcome (NNTB) and the number needed to treat for an additional harmful outcome (NNTH), with their CIs, are intuitively attractive to clinicians, they are problematic to calculate and interpret in meta‐analyses (Hutton 2009). For binary data presented in the 'Summary of findings' table/s we, where possible, calculated illustrative comparative risks.
2. Continuous data
For continuous outcomes we estimated MD between groups. We preferred not to calculate effect size measures (SMD). However if scales of very considerable similarity are used, we presumed there is a small difference in measurement, and we calculated effect size and transform the effect back to the units of one or more of the specific instruments.
Unit of analysis issues
1. Cluster trials
Studies increasingly employ 'cluster randomisation' (such as randomisation by clinician or practice), but analysis and pooling of clustered data poses problems. Firstly, authors often fail to account for intra‐class correlation in clustered studies, leading to a unit‐of‐analysis error whereby P values are spuriously low, CIs unduly narrow and statistical significance overestimated (Divine 1992). This causes type I errors (Bland 1997; Gulliford 1999).
Where clustering has been incorporated into the analysis of primary studies, we presented these data as if from a non‐cluster randomised study, but adjusted for the clustering effect.
Where clustering is not accounted for in primary studies, we presented data in a table, with a (*) symbol to indicate the presence of a probable unit of analysis error. We contacted first authors of studies to obtain intra‐class correlation coefficients for their clustered data and adjusted for this by using accepted methods (Gulliford 1999).
We sought statistical advice and have been advised that the binary data from cluster trials presented in a report should be divided by a 'design effect'. This is calculated using the mean number of participants per cluster (m) and the intra‐class correlation coefficient (ICC): thus design effect = 1 + (m − 1) * ICC (Donner 2002). If the ICC is not reported we assumed it to be 0.1 (Ukoumunne 1999).
If cluster studies have been appropriately analysed and taken intra‐class correlation coefficients and relevant data documented in the report into account, synthesis with other studies was possible using the generic inverse variance technique.
2. Cross‐over trials
A major concern of cross‐over trials is the carry‐over effect. This occurs if an effect (e.g. pharmacological, physiological or psychological) of the treatment in the first phase is carried over to the second phase. As a consequence, participants can differ significantly from their initial state at entry to the second phase, despite a wash‐out phase. For the same reason cross‐over trials are not appropriate if the condition of interest is unstable (Elbourne 2002). As both carry‐over and unstable conditions are very likely in severe mental illness, we only used data from the first phase of cross‐over studies.
3. Studies with multiple treatment groups
Where a study involves more than two treatment arms, if relevant, we presented the additional treatment arms in comparisons. If data are binary we simply added these and combined within the two‐by‐two table. If data are continuous we combined data following the formula for combining data in the Cochrane Handbook for Systematic Reviews of Interventions (Higgins 2011). Where additional treatment arms are not relevant, we did not reproduce these data.
Dealing with missing data
1. Overall loss of credibility
At some degree of loss of follow‐up, data must lose credibility (Xia 2009). We chose that, for any particular outcome, should more than 50% of data be unaccounted for we would not reproduce these data or use them within analyses. If, however, more than 50% of those in one arm of a study are lost, but the total loss is less than 50%, we addressed this within the 'Summary of findings' table/s by down‐rating quality. Finally, we also downgraded quality within the 'Summary of findings' table/s should the loss be 25% to 50% in total.
2. Binary
In the case where attrition for a binary outcome is between 0% and 50% and where these data are not clearly described, we presented data on a 'once‐randomised‐always‐analyse' basis (an intention‐to‐treat analysis (ITT)). Those leaving the study early were all assumed to have the same rates of negative outcome as those who completed, with the exception of the outcome of death and adverse effects. For these outcomes the rate of those who stay in the study ‐ in that particular arm of the trial ‐ was used for those who did not. We undertook a sensitivity analysis testing how prone the primary outcomes are to change when data only from people who complete the study to that point are compared to the intention‐to‐treat analysis using the above assumptions.
3. Continuous
3.1 Attrition
We used data where attrition for a continuous outcome is between 0% and 50%, and data only from people who complete the study to that point were reported.
3.2 Standard deviations
If standard deviations (SDs) are not reported, we tried to obtain the missing values from the authors. If these are not available, where there are missing measures of variance for continuous data, but an exact standard error (SE) and CIs available for group means, and either P value or t value available for differences in mean, we can calculate SDs according to the rules described in the Cochrane Handbook for Systematic Reviews of Interventions (Deeks 2011). When only the SE is reported, SDs are calculated by the formula SD = SE * √(n). The Cochrane Handbook for Systematic Reviews of Interventions present detailed formulae for estimating SDs from P, t or F values, CIs, ranges or other statistics (Deeks 2011). If these formulae do not apply, we calculated the SDs according to a validated imputation method which is based on the SDs of the other included studies (Furukawa 2006). Although some of these imputation strategies can introduce error, the alternative would be to exclude a given study’s outcome and thus to lose information. Nevertheless, examined the validity of the imputations in a sensitivity analysis that excludes imputed values.
3.3 Assumptions about participants who left the trials early or were lost to follow‐up
Various methods are available to account for participants who left the trials early or were lost to follow‐up. Some trials just present the results of study completers; others use the method of last observation carried forward (LOCF); while more recently, methods such as multiple imputation or mixed‐effects models for repeated measurements (MMRM) have become more of a standard. While the latter methods seem to be somewhat better than LOCF (Leon 2006), we feel that the high percentage of participants leaving the studies early and differences between groups in their reasons for doing so is often the core problem in randomised schizophrenia trials. We therefore did not exclude studies based on the statistical approach used. However, by preference we used the more sophisticated approaches, i.e. we prefered to use MMRM or multiple‐imputation to LOCF, and we only presented completer analyses if some kind of ITT data were not available at all. Moreover, we addressed this issue in the item 'Incomplete outcome data' of the 'Risk of bias' tool.
Assessment of heterogeneity
1. Clinical heterogeneity
We considered all included studies initially, without seeing comparison data, to judge clinical heterogeneity. We simply inspected all studies for participants who are clearly outliers or situations that we had not predicted would arise and, where found, discussed such situations or participant groups.
2. Methodological heterogeneity
We considered all included studies initially, without seeing comparison data, to judge methodological heterogeneity. We simply inspected all studies for clearly outlying methods which we had not predicted would arise and discussed any such methodological outliers.
3. Statistical heterogeneity
3.1 Visual inspection
We inspected graphs visually to investigate the possibility of statistical heterogeneity.
3.2 Employing the I² statistic
We investigated heterogeneity between studies by considering the I² statistic alongside the Chi² P value. The I² statistic provides an estimate of the percentage of inconsistency thought to be due to chance (Higgins 2003). The importance of the observed value of I² depends on the magnitude and direction of effects as well as the strength of evidence for heterogeneity (e.g. P value from Chi² test, or a confidence interval for I²). We interpreted an I² estimate greater than or equal to 50% and accompanied by a statistically significant Chi² statistic as evidence of substantial heterogeneity (Deeks 2011). When substantial levels of heterogeneity are found in the primary outcome, we explored reasons for heterogeneity (Subgroup analysis and investigation of heterogeneity).
Assessment of reporting biases
Reporting biases arise when the dissemination of research findings is influenced by the nature and direction of results (Egger 1997). These are described in Chapter 10 of the Cochrane Handbook for Systematic Reviews of Interventions (Sterne 2011). We are aware that funnel plots may be useful in investigating reporting biases, but are of limited power to detect small‐study effects. We did not use funnel plots for outcomes where there are 10 or fewer studies, or where all studies are of similar size. In other cases, where funnel plots are possible, we will seek statistical advice in their interpretation.
Data synthesis
We understand that there is no closed argument for preference for use of fixed‐effect or random‐effects models. The random‐effects method incorporates an assumption that the different studies are estimating different, yet related, intervention effects. This often seems to be true to us and the random‐effects model takes into account differences between studies, even if there is no statistically significant heterogeneity. There is, however, a disadvantage to the random‐effects model: it puts added weight onto small studies, which often are the most biased ones. Depending on the direction of effect, these studies can either inflate or deflate the effect size. We chose to use a random‐effect model for all analyses.
Economic Summary
Data was summarised according to the Cochrane Campbell Economic Methods Group (Higgins 2011) and a narrative abstract provided for each included study. A table summarising the data was also provided for any studies had they been identified.
We anticipated that most studies would be Grade C level of economic evidence and that we would use data from such studies to calculate a GBP value associated with the outcomes. These approximate values were calculated by (a) using the PSSRU calculation of £338 (weighted average of all adult mental health inpatient bed days) per hospital bed day based in a UK NHS setting (PSSRU 2012) , and (b) assuming that one relapse equals one hospital admission, a median length of stay as 16 days, as per Hospital Episode Statistics 2012 (HES 2012; main speciality ‘adult mental illness’) we utilised results of the effects of the intervention that presented service use data for an adult ward as well as for relapse rates (HES is a data warehouse containing details of all admissions, outpatient appointments and A&E attendances at NHS hospitals in England).
We have not factored any associated costs (including cost and resource use of treatment) prior to the relevant measured outcomes of relapse and hospital discharge. We are using UK NHS PSSRU reference costs of 2012, and therefore present the outcomes in terms of a GBP value found in the comparison data as a proxy measure for relative risk, which is achieved through the assumption of average (median) length of hospital stay (16 days) and average cost per day (£338). The average cost of relapse ‐ based on our assumption that one relapse equals one hospital admission lasting 16 days (338 x 16) ‐ has been calculated at £5,408 per person. From this number, the average cost of relapse has been calculated for both (a) the number of participants alone who experienced relapse in both the intervention or control group (n=relapsed x 5,408) and (b) the entire population at risk of relapse between groups (£ of n=relapsed per group ÷ total N receiving intervention across studies).
The authors wish to emphasise the numerous assumptions that have been made for the purposes of presenting this economic data, specifically at Grade C quality level:
-
The current included studies contributing to the Grade C‐level of quality were undertaken between the years of 1963 to 1999; and, taking this into account ‐
-
The average length of stay and costs have been calculated from current available data, that is, according to 2012 HES costs, from most primarily a UK NHS perspective; and
-
The GBP value data that are presented reflect a proxy measure only; that is, the GBP value of the intervention effect on the measured outcome, and not taking into account any costs or resource use that may likely have been incurred prior to the actual outcome (which includes, but is not limited to, costs and resource use prior to intervention, the intervention itself and post‐intervention up to outcome).
Subgroup analysis and investigation of heterogeneity
1. Subgroup analyses
1.1 Primary outcome
No subgroup analysis was expected.
2. Investigation of heterogeneity
We reported if inconsistency was high. Firstly, we investigated whether data have been entered correctly. Secondly, if data are correct, we inspected the graph visually and remove outlying studies successively to see if homogeneity is restored. For this review we have decided that should this occur with data contributing to the summary finding of no more than 10% of the total weighting, we presented data. If not, we did not pool these data and discussed any issues. We know of no supporting research for this 10% cut‐off but are investigating use of prediction intervals as an alternative to this unsatisfactory state.
When unanticipated clinical or methodological heterogeneity is obvious we simply stated hypotheses regarding these for future reviews or versions of this review. We do not anticipate undertaking analyses relating to these.
Sensitivity analysis
1. Implication of randomisation
We included trials in a sensitivity analysis if they were described in some way that implies randomisation. For primary outcomes, if the inclusion of these trials did not result in a substantive difference, they remained in the analyses. If their inclusion did result in statistically significant differences, we did not add the data from these lower‐quality studies to the results of the higher‐quality trials, but presented these data within a subcategory.
2. Assumptions for lost binary data
Where assumptions have to be made regarding people lost to follow‐up (see Dealing with missing data), we compared the findings of the primary outcomes when we use our assumption compared with completer data only. If there is a substantial difference, we reported results and discussed them, but continued to employ our assumption.
Where assumptions have to be made regarding missing SD data (see Dealing with missing data), we compared the findings of primary outcomes when we used our assumption compared with complete data only. We undertook a sensitivity analysis to test how prone results are to change when completer data only were compared to the imputed data using the above assumption. If there was a substantial difference, we reported results and discussed them, but continued to employ our assumption.
3. Risk of bias
We analysed the effects of excluding trials that are judged to be at high risk of bias across one or more of the 'Risk of bias' domains (implied as randomised with no further details available, allocation concealment, blinding and outcome reporting) for the meta‐analysis of the primary outcome. If the exclusion of trials at high risk of bias did not alter the direction of effect or the precision of the effect estimates substantially, then we included relevant data from these trials.
4. Imputed values
We undertook a sensitivity analysis to assess the effects of including data from trials where we use imputed values for ICC in calculating the design effect in cluster‐randomised trials.
If substantial differences were noted in the direction or precision of effect estimates in any of the sensitivity analyses listed above, we did not pool data from the excluded trials with the other trials contributing to the outcome, but presented them separately.
5. Fixed‐ and random‐effects
We synthesised data using radnom‐effects model; however, we also synthesised data for the primary outcome using a fixed effect model to evaluate whether this alters the significance of the results.
It was expected that several sensitivity analyses could be undertaken within this review. The following hypotheses were be tested:
When compared with placebo, for the primary outcomes of interest (see: Criteria for considering studies for this review), fluphenazine is differentially effective for:
1. Men and women.
2. People who are under 18 years of age, between 18 and 64, or over 65 years of age.
3. People who became ill recently (i.e. acute episode approximately less than one month's duration) as opposed to people who have been ill for a longer duration.
4. People who are given low doses (1‐ 5 mg/day), and those given high doses (over 5 mg/day).
5. People who have schizophrenia diagnosed according to any operational criterion i.e. a pre‐stated checklist of symptoms/problems/time periods/exclusions) as opposed to those who have entered the trial with loosely defined illness.
6. People treated earlier (pre‐1990) and people treated in recent years (1990 to 2006).
We additionally applied all sensitivity analyses to the primary outcomes of this review.
Economic summary
We undertook a sensitivity analysis taking into account both the mean length of hospital stay; the median length of hospital stay (HES 2012); and the associated upper (£376) and lower quartile (£299) ranges of the weighted average cost of all adult mental health inpatient bed days (PSSRU 2012), to investigate how far this affects the direction of the estimated value.
Results
Description of studies
For substantive descriptions of studies please see the Included studies and Excluded studies tables.
1. Effects of intervention
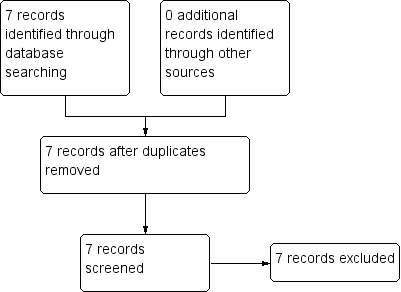
The initial 2006 search yielded 1274 electronic records for 422 studies, of which we rejected 834 during the first inspection. We inspected the remaining 433 papers. Three hundred and forty‐three were rejected, as they were clearly not relevant. The remaining 82 papers (55 studies) were considered to match the inclusion criteria closely enough to be mentioned in either the 'Included studies'; 'excluded studies' and 'awaiting classification' tables.
The 2012 update search yielded seven studies, each of which was excluded. The seven studies previously awaiting 'classification' were moved to 'excluded studies' for this review. Therefore, the current review cites 48 studies as 'excluded studies' and 16 reports of the seven 'included studies'. There was over 90% agreement for trial selection and once we had investigated any disagreement and acquired and reassessed the papers, concordance was 100%. Initially, there was also over 90% agreement in the extracted data. We easily resolved any disagreement by discussion (see Figure 1 and Figure 2). Further update undertaken in December 2017 and yielded no new studies.
2. Economic
We identified 15 potential studies in our economic evaluation search (Figure 3), none of which met our inclusion criteria for Grade A and B. Had we found any studies of Grade A or B quality, they would have been presented in Table 1. Eleven of these references were excluded on the basis of the title or abstract alone, leaving with four references left for assessment. These four references referred to two studies and these two studies were subsequently excluded (Table 2). We therefore present data for Grade C economic evaluation only.

Study flow diagram: economic Cochrane Schizophrenia Group’s Health Economic Database (CSzGHED) search 23 July 2013.
| Study | Country | Participants | Perspective | Type of Economic Evaluation | Resource Use provided | Unit Costs Provided | ICER | QALY/DALY | Net Benefit Ratio | Grading |
|---|---|---|---|---|---|---|---|---|---|---|
| Study ID | Status | Reasons for exclusion |
|---|---|---|
| Excluded | Allocation: randomised (current systematic review). | |
| Excluded | Allocation: randomised. Particiapants: schizophrenia. Interventions: fluphenazine IM. |
Included studies
We included seven studies (total n = 439 participants).
We found no studies meeting our inclusion criteria for economic evaluation Grades A and B. However, for Grade C‐level evidence, we utilised the data from relevant economic outcomes of interest (relapse and hospital discharge) from three trials included in the effectiveness section of the systematic review (Marder 1994; Millar 1963; Rifkin 1976).
1.1 Methods
In all included studies, randomisation was either reported or implied. The mean duration of treatment was about 170 days (~six months), but this was highly skewed (standard deviation (SD) 253). The most common study length was six weeks (Carpenter 1999; Clark 1971; Millar 1963) but the range was considerable with the longest lasting two years (Marder 1994).
1.2 Setting
Four studies were hospital‐based (Clark 1971; Goldberg 1964; Hordern 1964; Millar 1963), while three were undertaken in the community (Carpenter 1999; Marder 1994; Rifkin 1976). Five studies were conducted in the United States of America (Carpenter 1999; Clark 1971; Goldberg 1964; Marder 1994; Rifkin 1976), one in Australia (Hordern 1964) and one in the United Kingdom (Millar 1963).
1.3 Participants
All trials included participants diagnosed with schizophrenia and two of the seven trials described the diagnostic criteria used (Diagnostic and Statistical Manual version III (DSM‐III) or Research Diagnostic Criteria (RDC)). The other studies used a clinical diagnosis of schizophrenia. The mean age of the participants was about 38 years, range 16 to 75, and they were mostly chronic patients with a mean hospitalisation period of about 20 years. In Marder 1994, all participants were men, whilst in Hordern 1964 and Millar 1963 the participants were all women. In the remaining studies participants were of mixed sex.
1.4 Study size
The mean number of participants was about n = 60, ranging from 36 to 190.
1.5 Interventions
All trials compared oral fluphenazine with inactive placebo. The doses of oral fluphenazine in these studies ranged from 2.5 mg/day (Millar 1963) up to a potential of 20 mg/day (Rifkin 1976). The mean dose was 8.2 mg per day (SD 3.9). The standard oral dosage in minor disturbances 2 mg to 5 mg/day, or in the treatment of psychotic disorders up to 20 mg to 40 mg daily (www.psychotropics.dk).
1.6 Outcomes
1.6.1 General remarks
Most outcomes were dichotomous, and presented as such, or were continuous data. In many studies, outcomes were few and where data were reported they were rendered unusable. None of the included studies attempted to quantify levels of satisfaction or quality of life and there is no evidence of any direct economic evaluation of fluphenazine. However, we were able to measure some aspects of the global and mental state and adverse effects.
1.7 Outcome scales
The following scales were used and provided data for the analysis.
1.7.1 Global state:
1.7.1.1 Clinical Global Impression (CGI)Guy 1976
A rating instrument commonly used in studies in schizophrenia that enables clinicians to quantify severity of illness and overall clinical improvement. A seven‐point scoring system is usually used with low scores indicating decreased severity and/or greater recovery. Carpenter 1999 and Clark 1971 reported dichotomised data from this scale, measuring improvement scores. Continuous data from Clark 1971 were also used in our results, however SDs were imputed using the method described in Dealing with missing data.
1.7.1.2 The Multidimensional Scale for Rating Psychiatric Patients (MDRSP)Lorr 1953
The Multidimensional Rating Scale or Hamilton's schizophrenia scale is a modification of the Inpatient Multidimensional Psychiatric Scale. The MDRSP is completed after a psychiatric interview. It consists of 18 items, in the form of simple questions, to be rated along a four‐point scale. The severity scores are defined by short behavioural descriptions on the form, thus avoiding interpretation problems. The scale is mainly designed for the evaluation of chronically hospitalised schizophrenic patients. Hordern 1964 reported dichotomised data from this scale for levels of improvement.
1.7.1.3 Brief Psychiatric Rating Scale (BPRS)Overall 1962
The scale measures positive symptoms and quantifies factors such as thought disorder, activation, hostility. somatic, hallucinatory, and depressive states. The original scale had 16 items, but a revised 18‐item scale is more commonly used, with scores ranging from 0 to 126. Each item is defined on a seven‐point scale from 0 = not present to seven = extremely severe. Higher scores equate to severity of illness.
Excluded studies
We excluded 48 studies. Seven were not randomised, did not imply randomisation or did not describe the allocation procedure at all. In one study, participants were not suffering from schizophrenia. Another sizeable proportion of the trials did not compare oral fluphenazine with placebo, but with other treatments. A few were fluphenazine‐withdrawal studies which are not relevant to this review. These withdrawal studies will be included in a future review. Three studies had no usable outcomes. Either data did not have clear clinical implications or genuinely relevant clinical data were not adequately reported. Frequently the numbers of participants in each group were not specified, means or SDs were not given or data were not reported from individual arms of cross‐over studies. The seven studies identified in the 2012 search were all excluded, owing either to no randomisation (Kinross‐Wright 1963; Matheu 1961), no diagnosis of schizophrenia (Hanlon 1970; Howell 1961), not the appropriate intervention (Marder 1993; Shafti 2009) or no usable data were presented (Zahn 1993).
For the economic search, we excluded two studies (four references); three papers were in fact systematic reviews relating to the previous version of this review (Matar 2007), and one paper compared costs and benefits of two doses of fluphenazine decanoate (Mardar 1984), as opposed to oral (Table 2).
Awaiting assessment
No studies are awaiting assessment.
Ongoing studies
We are not aware of any ongoing studies.
Risk of bias in included studies
Please see the relevant 'Risk of bias' tables in the Characteristics of included studies section and Figure 4; Figure 5.

'Risk of bias' graph: review authors' judgements about each risk of bias item presented as percentages across all included studies.

'Risk of bias' summary: review authors' judgements about each risk of bias item for each included study.
Allocation
None of the seven included studies described the methods used to generate random allocation, yet six of them were reported to be "randomly assigned" and readers are given little assurance that bias was minimised during the allocation procedure. Hordern 1964, did not mention "random assignment", and reported that assignment of participants to fluphenazine or placebo groups was matched on age, length of illness, and severity of illness and the number of participants in each group was identical. Millar 1963 also obtained the same numbers in each group in a randomly assigned procedure with no further description.
Blinding
Only two studies (25%) gave a description of their attempts to make the investigation double‐blind. Clark 1971 reported that identically appearing medication was administrated from a bottle labelled only with the participant's name and Millar 1963 reported that only the hospital pharmacist knew the composition of the groups. However neither of them actually tested how successful these attempts were. In the other six trials, it was indicated that attempts at blinding had been made, but without any further description.
Incomplete outcome data
Five studies reported that participants left the study early. Only two, Goldberg 1964 and Clark 1971, reported specifically the reasons for withdrawal.
Selective reporting
Studies frequently presented both dichotomous and continuous data in graphs, or just reported statistical measures of probability (P values). This often made it impossible to acquire raw data for synthesis. Continuous data were frequently poorly described; often no standard deviations/standard errors were presented or no data were presented at all. In this way a lot of potentially informative data were lost. In some studies it seemed that attempts had been made to use the original trials as vehicles for answering a host of other questions about schizophrenia. As a consequence, data from the randomised parts of the studies became buried beneath copious subgroup analyses.
Other potential sources of bias
The quality of trials has been assessed in individual 'Risk of bias' tables under the Characteristics of included studies section, using the guidance from the Cochrane Handbook for Systematic Reviews of Interventions categories (Higgins 2011). Due to poor reporting standards from particularly old studies, the majority of the risk of bias domains have been rated 'unclear' for the risk of bias.
Effects of interventions
See: Summary of findings 1 ORAL FLUPHENAZINE versus PLACEBO for Schizophrenia
1. COMPARISON: ORAL FLUPHENAZINE versus PLACEBO
1.1 Global state
1.1.1 Not improved or worsened
We found no significant difference between oral fluphenazine and placebo for 'not improved or worse' (CGI) over short‐term assessment (n = 125, 3 RCTs). Dichotomised multidimensional rating scale scores at 12 weeks 'not improved or worse' were also non‐significant (n = 50, 1 RCT, Analysis 1.1).
1.1.2 Relapse
Only Millar 1963 reported on relapse up to six weeks (short term) with results indicating a trend favouring fluphenazine (n = 38, 1 RCT, risk ratio (RR) 0.25 95% confidence interval (CI) 0.06 to 1.03, P = 0.05). Two studies, Marder 1994 and Rifkin 1976, reported data for long‐term relapse, which significantly favoured fluphenazine but data are heterogeneous (I2 92%). Using a random‐effects model rendered data equivocal (n = 86, 2 RCTs, Analysis 1.2).
1.1.3 Percentage of time in prodrome state
Marder 1994 reported data at one‐ and two‐year time points, but data are skewed (high SDs) and are best inspected outside of a forest plot, using an additional table (Analysis 1.3). The data suggest that a greater amount of time was spent in a prodromal state amongst placebo participants, at both one and two years.
1.1.4 Percentage of time in exacerbated state
Again, Marder 1994 reported data at one‐ and two‐year time points, but data are skewed and are best inspected outside of a forest plot, using an additional table (Analysis 1.4). Data suggest that, by one year, participants receiving oral fluphenazine spent more time in an exacerbated state that those on placebo. However, by two years, people receiving placebo spent longer in an exacerbated state.
1.1.5 CGI severity of illness ‐ average score
Data for global state using the CGI were reported in one study (Clark 1971), which demonstrated greater improvement in global state (n = 36, 1 RCT, mean difference (MD) ‐0.77 95% CI ‐1.39 to ‐0.15), this was a statistically significant result (P = 0.02); however, these data were imputed using the adjusted final mean and the P value between studies, and the significance of the results should be treated with caution (Analysis 1.5).
1.2 Leaving study early
1.2.1 Non‐specific reasons
Although people allocated to oral fluphenazine left the study less often than participants who were given placebo in the short term, the data did not reach statistical significance (n = 227, 2 RCTs). For ‐medium‐term assessment, we found only one study reporting on attrition (n = 50) and data were not significantly different. Long‐term follow‐up from two studies (n = 86) were also equivocal, and as a proxy measure for treatment acceptability the oral fluphenazine group did not find treatment any more acceptable than the placebo group when assessed over short‐, medium‐ and long‐term evaluation. Overall, across all time periods, only about 15% of people left these studies early (n = 363, 5 RCTs, Analysis 1.6).
1.2.2 Specific reasons
Leaving the study early due to court case transfers was significantly higher (P = 0.02) in the fluphenazine group (n = 190, 1 RCT, RR 10.65 95% CI 1.39 to 81.58). Other reasons for leaving the study early: 'incorrect diagnosis' (n = 190, 1 RCT), 'marked early remission' (n = 190, 1 RCT) and 'serious complication of treatment' (n = 190, 1 RCT) were not significantly different. We found the number of participants leaving the study early due to treatment failure favoured oral fluphenazine with significantly more people dropping out from the placebo group (n = 190, 1 RCT, RR 0.11 95% CI 0.03 to 0.35, Analysis 1.7).
1.2.3 Marked improvement/ hospital discharge
Data were equivocal for this positive outcome (forest plots are presented to display results right to the line of no effect, indicating a favourable outcome for oral fluphenazine). Only one participant receiving oral fluphenazine in one small study was discharged due to marked improvement (n = 36, 1 RCT, Analysis 1.8).
1.3 Adverse effects
1.3.1 Anticholinergic effects
There is some suggestion that fluphenazine increases a person's chance of experiencing anticholinergic effects such as constipation (n = 190, 1 RCT, RR 2.22 95% CI 1.19 to 4.15), dry mouth (n = 227, 2 RCTs, RR 3.62 95% CI 1.39 to 9.42) and increased salivation (n = 190, 1 RCT, RR 18.10 95% CI 1.06 to 309.15). Data for blurred vision, drooling, gastrointestinal distress, nasal congestion, urinary disturbance, and vomiting were not significantly different (Analysis 1.9).
1.3.2 Cardiovascular effects
No significant differences were found between fluphenazine and placebo for dizziness/faintness/weakness (n = 190, 1 RCT), hypotension (n = 37, 1 RCT), syncope (n = 37, 1 RCT), or tachycardia (n = 37, 1 RCT, Analysis 1.10).
1.3.3 Central nervous system
There is also some suggestion that fluphenazine increases a person's chance of experiencing some neurological symptoms such as drowsiness (n = 190, 1 RCT, RR 3.91 95% CI 1.98 to 7.71). Reports of headache did not reveal any significant differences between fluphenazine and placebo groups (n = 190, 1 RCT). Other outcomes, anxiety, convulsion/seizures, depression, sedation/lethargy were equivocal (Analysis 1.11).
1.3.4 Death
Only one study (Rifkin 1976) reported on the outcome of death, with one death occurring in the fluphenazine group during long‐term follow‐up (n = 50, 1 RCT, Analysis 1.12).
1.3.5 Endocrine
We found no statistically significant difference between fluphenazine and placebo for the outcomes of amenorrhoea (n = 190, 1 RCT), lactation (n = 190, 1 RCT) or swelling of the breasts (n = 190, 1 RCT) at short term (Analysis 1.13).
1.3.6 Extrapyramidal effects
In the short term, there is evidence that fluphenazine increases a person's chances of experiencing akathisia (n = 227, 2 RCTs, RR 3.43 95% CI 1.23 to 9.56), facial rigidity (n = 190, 1 RCT, RR 2.77 95% CI 1.03 to 7.46), 'loss of associated movements' (n = 190, 1 RCT, RR 6.39 95% CI 1.95 to 20.98), rigidity (n = 227, 2 RCTs, RR 3.54 95% CI 1.76 to 7.14) and tremor (n = 227, 2 RCTs, RR 3.19 95% CI 1.25 to 8.11). We found measures of akinesia, associated movements, dystonia and restlessness/insomnia were not significantly different from those allocated to placebo. Evidence in the medium term indicates that fluphenazine increases the likelihood of having parkinsonism (n = 50, 1 RCT, RR 5.50 95% CI 1.36 to 22.32), but akathisia, akinesia and dystonia were equivocal (Analysis 1.14).
1.3.7 Other
We did not find any statistically significant data for the outcomes of convulsion/seizures (n = 190, 1 RCT), diarrhoea (n = 190, 1 RCT), infection (n = 190, 1 RCT), or rash (n = 227, 2 RCTs, Analysis 1.16).
1.4 Economic outcomes
Cost of relapse
See Analysis 1.2, and additional Table 3 and Table 4 to aid interpretation of results.
| Base Case | Cost per day (£) | Cost of actual relapse (£) | Cost of relapse for study population (£)** | ||
|---|---|---|---|---|---|
| Fluphenazine | Placebo | Fluphenazine | Placebo | ||
| Median length1 of stay and mean cost2 | 5,408 | 91,936 | 205,504 | 1,437 | 3,425 |
116 days.
2£338.
*Unlike the effectiveness data of this review, the included economic studies have not been weighted according to sample size; hence risk ratios (RR) of cost of relapse for the study population (if calculated) may not be equal to the RR as calculated by RevMan.
**Cost attributed to each individual participant within each arm of the trial, irrespective of whether they relapsed or not.
***For ease of interpretation, lower number is preferred over higher.
| Sensitivity analyses | Cost per day (£) | Cost of actual relapse (£) | Cost of relapse for study population (£)** | ||
|---|---|---|---|---|---|
| Fluphenazine | Placebo | Fluphenazine | Placebo | ||
| Mean length of stay1 and mean cost3 | 18,049 | 306,833 | 685,862 | 4,794 | 11,431 |
| Mean length of stay1 and mean lower quartile cost4 | 15,966 | 271,422 | 606,708 | 4,241 | 10,112 |
| Mean length of stay1 and mean upper quartile cost5 | 20,078 | 341,326 | 762,964 | 5,333 | 12,716 |
| Median length of stay2 and mean lower quartile cost4 | 4,784 | 81,328 | 181,792 | 1,271 | 3,030 |
| Median length of stay2 and mean upper quartile cost5 | 6,016 | 102,272 | 228,608 | 1,598 | 3,810 |
153.4 days
216 days
3£338
4£299
5£376
*Unlike the effectiveness data of this review, the included economic studies have not been weighted according to sample size; hence risk ratios (RR) of cost of relapse for the study population (if calculated) may not be equal to the RR as calculated by RevMan.
**Cost attributed to each individual participant within each arm of the trial, irrespective of whether they relapsed or not.
***For ease of interpretation, lower number is preferred over higher.
Hospital discharge
There were no data for this outcome in the included studies.
2. SENSITIVITY ANALYSES
2.1 Men and women
Three studies included either all male (Marder 1994) or all female (Hordern 1964; Millar 1963) participants. However, only Marder 1994 reported data for any of our primary outcomes; therefore, a sensitivity analysis was not possible for this comparison. Note HM: this section is repeated below.
2.2 People who are under 18 years of age, between 18 and 64, or over 65 years of age
The age ranges of all participants across the included studies were all similar (between 16 and 58 years old). Where participants younger than 18 were included in the relevant studies (the youngest being 16 years old in Goldberg 1964, and 17 years old in Rifkin 1976), it was not possible to extract their data from the individual reports. Therefore, a sensitivity analysis has not been undertaken.
2.3 Chronic versus acutely ill people (< one month in duration)
Limited data were available from only one study. Participants who were chronically ill did not leave the study early in greater numbers than acutely ill patients. We found relapse did occur more often in the placebo arm of those chronically ill compared with those acutely ill, but the sample sizes were small and uneven and more data are required to draw any inferences (Analysis 1.17).
2.4 Low doses (1‐5 mg/day) and high doses (over 5 mg/day)
Again, limited data were available, but it is suggested that there is little difference between levels of improvement between participants in studies that used either a high dose (15 mg/day used in Carpenter 1999; n = 38, 1 RCT) or a flexible dose regimen in the short term (2‐10 mg/day in Clark 1971; or up to 14 mg/day in Hordern 1964; n = 87, 2 RCTs, Analysis 1.18).
2.5 Diagnosed according to any operational criterion versus those with loosely defined illness
It is indicated that there is again little difference in results for no improvement when participants have been diagnosed according to operational criteria (DSM‐III‐R, n = 38, 1 RCT) or with loose diagnostic criteria or definitions (n = 87, 2 RCTs, Analysis 1.19).
2.6 Studies published before 1990 versus studies published between 1990 and the present
Data were available for the outcomes of 'no global improvement' in the short term. There were no clear differences between the results of earlier studies and those published in the last 16 years (Analysis 1.20).
2.7 Implication of randomisation
Only one study was rated as a low risk of bias for adequate randomisation (Clark 1971); results for the primary outcome of global state (not improved or worse) remain the same when all other studies that implied randomisation were removed from the meta‐analysis (n = 37, 1 RCT, RR 0.59, 95% CI 0.24 to 1.42). For the other secondary outcomes of adverse effects; the effect of removing the other studies that were meta‐analysed with Clark 1971 and implied as being randomised is that data are no longer statistically significant for short‐term extrapyramidal akathisia (from P = 0.02 to P = 0.18), or tremor (P = 0.01 to P = 0.09).
2.8 Assumptions for lost binary data
There were no clear differences between the results when completer‐only data were used compared to data assumed for those lost to follow‐up.
2.9 Risk of bias
Each included study was rated as a 'high' risk of bias across one or more of the domains of randomisation (implied as randomised with no further details available): allocation concealment, blinding and outcome reporting for the meta‐analysis of the primary outcome. The result of excluding each study on this basis leaves us with no data to compare, therefore a sensitivity analysis was not possible.
2.10 Imputed values
We also sought to undertake a sensitivity analysis to assess the effects of including data from trials where we used imputed values for ICC in calculating the design effect in cluster‐randomised trials. However, we encountered no such studies.
2.11 Fixed‐effect and random‐effects
We found that there was no difference in the results when synthesising data for the primary outcome of global state (not improved or worse) using a random‐effects model. However, for short‐term extrapyramidal effects (tremor), when using a random‐effects model, results were no longer statistically significant (from P = 0.01 to P = 0.07).
2.12 Economic outcomes
See Analysis 1.2 and additional Table 3 and Table 4 to aid interpretation of results.
Discussion
Summary of main results
1. COMPARISON ONE: ORAL FLUPHENAZINE versus PLACEBO
1.1 Global State
1.1.1 No improvement
There were few data available for global improvement. Data were only obtained from three studies, and both short‐term and medium‐term assessment did not reveal any significant differences between fluphenazine and placebo, although a trend may be evident from the graphical representations of the data, suggesting that oral fluphenazine is superior to placebo, and perhaps this would have clearly emerged if larger and longer studies were used.
1.1.2 Relapse
There are surprisingly little data regarding relapse but the strongest results come from a small study with a duration of one year (Rifkin 1976), however, there was substantial heterogeneity present, perhaps due to the difference between the participant population and stages (remitted, non‐psychotic participants in Rifkin 1976, and participants with at least two episodes of acute schizophrenia or continuing psychotic symptoms in previous two years in Marder 1994). A larger sample size would have probably ensured more unequivocal data in favour of fluphenazine.
1.2 Leaving study early
The finding that using fluphenazine resulted in more people staying in the study could be seen as heartening. Perhaps a genuine decrease in the distressing symptoms of schizophrenia leads to an increased concordance with medication, despite the unpleasant adverse effects of this drug.
1.3 Mental state
In spite of more than five decades of research on this benchmark antipsychotic treatment, very little can be said from trials regarding its direct effect on mental state regarding general or specific symptoms of schizophrenia.
1.4 Adverse effects
Although we were able to include a few studies in this review, clinicians will not be surprised that fluphenazine produces acute extrapyramidal disorders; dystonia, parkinsonism, akathisia, tremor, rigidity, weakness and anticholinergic effects. This Cochrane review, however, is a rare report of the best available and quantitative data on a compound over half a century old. Estimates of the incidence of extrapyramidal disorders, however, are not available from this review, as these necessitate a long follow‐up period that was only attempted in a few trials. It may be surprising that there was only one death incident reported among over 439 people with schizophrenia who were randomised to oral fluphenazine or placebo. The lifetime incidence of suicide for people suffering from schizophrenia is 10% to 13% (Caldwell 1992). The occurrence of only one death indicates that either trial‐care is more vigilant than routine care or that death is an under‐reported outcome.
1.5 Economic summary
As we have stated, the current economic evidence we present uses up‐to‐date values calculated using PSSRU unit costs of health and social care in GBP terms and average length of stay in UK NHS hospitals using HES data. Bearing this in mind, the Grade C level of economic evidence used was taken from the effect of intervention data of relapse/worsening from studies that were conducted between 1963 to 1994 in either the UK or USA. Therefore, the international applicability of the data presented is questionable, as is the accuracy of the potential value (GBP) that was calculated from the measured outcome only. What the results do show us, however, is what is already known ‐ that there is a price attached to relapse and other outcome measures commonly addressed in systematic reviews ‐ this economic summary is intended to highlight this issue and promote discussion in order for the research community to clarify the best way to approach economic analyses in systematic reviews.
2. SENSITIVITY ANALYSES
As we knew would be likely from the start, the power to detect a real difference between studies in any one of the sensitivity analyses was very low. Only subsets of already limited lists of trials were available. The wide confidence intervals could be hiding true differences in effect between the acutely and chronically ill people, and early trials versus current studies.
Overall completeness and applicability of evidence
1. Generalisability
This work includes studies that span nearly four decades of evaluative studies within psychiatry. It is possible that the rigour of these experiments has changed over time, as have the participants. There is some empirical evidence that the quality of schizophrenia trial reporting has not changed much over time (Thornley 1998) or, if it has changed, it may even have deteriorated (Ahmed 1998). We have found no time‐related differences in reporting of studies within this review and no suggestion of a change of the effect size over time. We identified trials by meticulous searching; nevertheless, for a compound formulated so long ago, publication biases may be difficult to avoid. The strength of this review is that it presents up‐to‐date quantitative data for a benchmark treatment for schizophrenia which is used throughout the world.
2. Applicability
The seven included studies involve many people who would be recognisable in everyday practice. There are those with strictly diagnosed illnesses, very likely to suffer from schizophrenia, and people whose illness was diagnosed using less rigorous criteria. The dose of fluphenazine in the studies included in this review could be considered standard (mean 8.2 mg/day SD 3.9). Although the outcomes that have been used in this review are accessible to both clinicians and recipients of care, generalising to treatment in community settings, could be problematic. Four studies were undertaken in hospital and three in the community, which is where most people with schizophrenia now reside.
There are no Grade A or B economic evaluations conducted on fluphenazine. With Grade C data which reports outcome measures, we have attempted to value the outcomes in GBP terms. This may not be an accurate measure of costs incurred or saved and as such we would not recommend that these results be used. This is intended to encourage debate on how best to use such reported data.
3. Heterogeneity
Two outcomes were heterogeneous, but all other outcomes were homogeneous. However, no more than five studies were pooled so the chances of data being heterogeneous were always small. In addition, several methods were used to observe different adverse effects e.g. tremor and blurred vision. This made analyses and interpretation for the results even more difficult.
4. Limited data
Data were often inadequately reported and rendered many outcomes unusable. Most trials report only six‐ to 12‐week outcomes for a mostly lifelong illness. No studies reported on service utilisation, economic outcomes, or on satisfaction with care.
Quality of the evidence
1. General
Generally, the quality of the available evidence was rated as either very low, low to moderate (See summary of findings Table 1). This was largely due to the age of the included studies and poor reporting standards, some of which were published up to 50 years ago, pre‐dating the CONSORT statement (Moher 2001; Schulz 2010). Missing or unreported outcomes were common, which restricted the amount of evidence available for use in this systematic review and data that may have been relevant in meta‐analysis. Any future studies in this area must adhere to CONSORT principles, ensuring that all trials are transparently reported, that all tables and figures express what data they are presenting, so that no trials can reach publication without revelation of methodological inadequacies. A flow diagram should also be used in order to document the process in which participants are recruited to those that are ultimately followed‐up, promoting completeness, clarity and transparency of reporting.
2. Specific: economic evaluation
We did not come across any studies that was of Grade A or B economic evaluation (which includes but not limited to cost‐effectiveness analysis, cost‐utility analysis and cost‐benefit analysis).
Potential biases in the review process
The review authors sought to adhere to the protocol, through the independent inspection of citations and full articles of potentially relevant studies. Furthermore, the review authors independently extracted data onto standard simple forms; however, we met for discussion where inconsistencies or disagreements arose regarding the available data.
Agreements and disagreements with other studies or reviews
We are not aware of other systematic reviews evaluating the effects of oral fluphenazine versus placebo in the treatment of schizophrenia.
Limitations of the economic evaluation
The economic authors appreciate the limitations of the methods used in the economic summary. It is fair to say that the data provided display a rudimentary estimate of the value in GBP terms associated with the outcomes of relapse and hospital discharge. As we did not include cost of treatment or costs associated with treatment, it is acknowledged that the direction of the estimated result may well change. The aim of this economic summary is to generate debate and discussion; to not take effectiveness data at face value without considering potential economic consequences; and to utilise the data in a way that will be of greater use to decision/policy‐makers. We will welcome discussion on the methods used for Grade C level economic evidence and the planned methods described for Grade A and B level evidence should future reviews find those studies. We are aware that policy‐makers and commissioners often consider these reviews while deciding on service provision and valuing outcomes in GBP terms may make it easier to review evidence such as relapse.
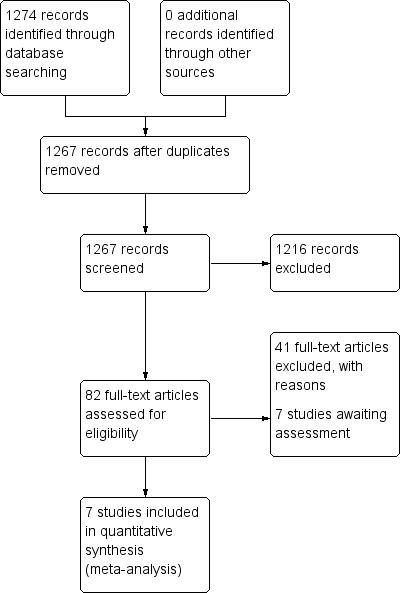
Study flow diagram: 2006 search.

Study flow diagram: 2012 update search (no additional studies).
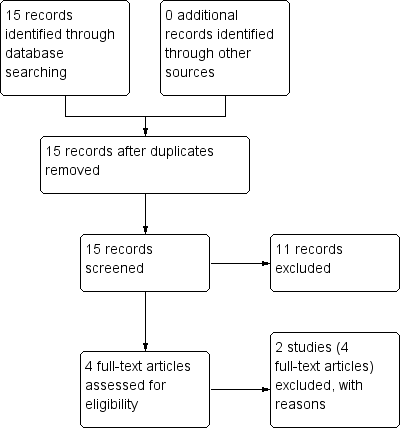
Study flow diagram: economic Cochrane Schizophrenia Group’s Health Economic Database (CSzGHED) search 23 July 2013.

'Risk of bias' graph: review authors' judgements about each risk of bias item presented as percentages across all included studies.

'Risk of bias' summary: review authors' judgements about each risk of bias item for each included study.

Comparison 1: ORAL FLUPHENAZINE versus PLACEBO, Outcome 1: Global state: 1. Not improved or worsened

Comparison 1: ORAL FLUPHENAZINE versus PLACEBO, Outcome 2: Global state: 2. Relapse
| Global state: 3. Percentage of time in prodrome state (skewed data) | ||||
| Study | Intervention | Mean | SD | N |
|---|---|---|---|---|
| one‐year data | ||||
| Marder 1994 | Oral fluphenazine | 10.5 | 15.90 | 17 |
| Placebo | 19.4 | 22.30 | 19 | |
| two‐year data | ||||
| Marder 1994 | Oral fluphenazine | 2.80 | 3.80 | 14 |
| Placebo | 4.90 | 5.70 | 15 | |
Comparison 1: ORAL FLUPHENAZINE versus PLACEBO, Outcome 3: Global state: 3. Percentage of time in prodrome state (skewed data)
| Global state: 4. Percentage of time in exacerbated state (skewed data) | ||||
| Study | Intervention | Mean | SD | N |
|---|---|---|---|---|
| one‐year data | ||||
| Marder 1994 | Oral fluphenazine | 11.8 | 15.00 | 17 |
| Placebo | 7.20 | 10.70 | 19 | |
| two‐year data | ||||
| Marder 1994 | Oral fluphenazine | 5.50 | 10.40 | 14 |
| Placebo | 12.9 | 13.6 | 15 | |
Comparison 1: ORAL FLUPHENAZINE versus PLACEBO, Outcome 4: Global state: 4. Percentage of time in exacerbated state (skewed data)

Comparison 1: ORAL FLUPHENAZINE versus PLACEBO, Outcome 5: Global state: 5. average score: CGI ‐ severity of illness score (high = poor)

Comparison 1: ORAL FLUPHENAZINE versus PLACEBO, Outcome 6: Leaving the study early: 1. Non‐specific reasons

Comparison 1: ORAL FLUPHENAZINE versus PLACEBO, Outcome 7: Leaving the study early: 2. Specific reason ‐ short term

Comparison 1: ORAL FLUPHENAZINE versus PLACEBO, Outcome 8: Leaving the study early: 3. Marked improvement/ hospital discharge

Comparison 1: ORAL FLUPHENAZINE versus PLACEBO, Outcome 9: Adverse effects: 1. Anticholinergic effects ‐ short term

Comparison 1: ORAL FLUPHENAZINE versus PLACEBO, Outcome 10: Adverse effects: 2. Cardivascular effects ‐ short term

Comparison 1: ORAL FLUPHENAZINE versus PLACEBO, Outcome 11: Adverse effects: 3. CNS ‐ short term

Comparison 1: ORAL FLUPHENAZINE versus PLACEBO, Outcome 12: Adverse effects: 4. Death ‐ long term

Comparison 1: ORAL FLUPHENAZINE versus PLACEBO, Outcome 13: Adverse effects: 5. Endocrine ‐ short term

Comparison 1: ORAL FLUPHENAZINE versus PLACEBO, Outcome 14: Adverse effects: 6a. Extrapyramidal effects ‐ short term

Comparison 1: ORAL FLUPHENAZINE versus PLACEBO, Outcome 15: Adverse effects: 6b. Extrapyramidal effects ‐ medium term

Comparison 1: ORAL FLUPHENAZINE versus PLACEBO, Outcome 16: Adverse effects: 7. Others ‐ short term

Comparison 1: ORAL FLUPHENAZINE versus PLACEBO, Outcome 17: Sensitivity analysis: 1. CHRONIC versus ACUTE

Comparison 1: ORAL FLUPHENAZINE versus PLACEBO, Outcome 18: Sensitivity analysis: 2. LOW DOSES (1‐5 mg/day) versus HIGH DOSES (5mg/day>)

Comparison 1: ORAL FLUPHENAZINE versus PLACEBO, Outcome 19: Sensitivity analysis: 3. OPERATIONAL CRITERIA versus LOOSE DEFINITIONS

Comparison 1: ORAL FLUPHENAZINE versus PLACEBO, Outcome 20: Sensitivity analysis: 4. BEFORE 1990 versus AFTER 1990
| ORAL FLUPHENAZINE versus PLACEBO for Schizophrenia | ||||||
| Patient or population: patients with Schizophrenia | ||||||
| Outcomes | Illustrative comparative risks* (95% CI) | Relative effect | No of Participants | Quality of the evidence | Comments | |
|---|---|---|---|---|---|---|
| Assumed risk | Corresponding risk | |||||
| Control | ORAL FLUPHENAZINE versus PLACEBO | |||||
| Global state: Not improved or worsened ‐ medium term | 680 per 10001 | 762 per 1000 | RR 1.12 | 50 | ⊕⊝⊝⊝ | |
| Global state: Relapse ‐ long term | Low | RR 0.39 | 86 | ⊕⊝⊝⊝ | Note: high degree of heterogeneity between included studies. | |
| 200 per 10001,4 | 78 per 1000 | |||||
| Moderate | ||||||
| 600 per 10001,4 | 234 per 1000 | |||||
| High | ||||||
| 800 per 10001,4 | 312 per 1000 | |||||
| Adverse effects: Death ‐ long term | Low7 | RR 2.38 | 50 | ⊕⊕⊝⊝ | ||
| 0 per 1000 | 0 per 1000 | |||||
| Moderate7 | ||||||
| 30 per 1000 | 71 per 1000 | |||||
| High7 | ||||||
| 90 per 1000 | 214 per 1000 | |||||
| Adverse effects: Extrapyramidal effects (akathisia) ‐ short term | Low8 | RR 3.43 | 227 | ⊕⊕⊕⊝ | ||
| 0 per 1000 | 0 per 1000 | |||||
| Moderate8 | ||||||
| 100 per 1000 | 343 per 1000 | |||||
| High8 | ||||||
| 200 per 1000 | 686 per 1000 | |||||
| Adverse effects: Extrapyramidal effects (rigidity) ‐ short term | Low10 | RR 3.54 | 227 | ⊕⊕⊕⊝ | ||
| 50 per 1000 | 177 per 1000 | |||||
| Moderate10 | ||||||
| 250 per 1000 | 885 per 1000 | |||||
| High10 | ||||||
| 500 per 1000 | 1000 per 1000 | |||||
| *The basis for the assumed risk (e.g. the median control group risk across studies) is provided in footnotes. The corresponding risk (and its 95% confidence interval) is based on the assumed risk in the comparison group and the relative effect of the intervention (and its 95% CI). | ||||||
| GRADE Working Group grades of evidence | ||||||
| 1 Mean baseline risk presented for single study. Key: High quality ‐ no downgrading of the evidence. | ||||||
| Study | Country | Participants | Perspective | Type of Economic Evaluation | Resource Use provided | Unit Costs Provided | ICER | QALY/DALY | Net Benefit Ratio | Grading |
|---|---|---|---|---|---|---|---|---|---|---|
| Study ID | Status | Reasons for exclusion |
|---|---|---|
| Excluded | Allocation: randomised (current systematic review). | |
| Excluded | Allocation: randomised. Particiapants: schizophrenia. Interventions: fluphenazine IM. |
| Base Case | Cost per day (£) | Cost of actual relapse (£) | Cost of relapse for study population (£)** | ||
|---|---|---|---|---|---|
| Fluphenazine | Placebo | Fluphenazine | Placebo | ||
| Median length1 of stay and mean cost2 | 5,408 | 91,936 | 205,504 | 1,437 | 3,425 |
| 116 days. | |||||
| Sensitivity analyses | Cost per day (£) | Cost of actual relapse (£) | Cost of relapse for study population (£)** | ||
|---|---|---|---|---|---|
| Fluphenazine | Placebo | Fluphenazine | Placebo | ||
| Mean length of stay1 and mean cost3 | 18,049 | 306,833 | 685,862 | 4,794 | 11,431 |
| Mean length of stay1 and mean lower quartile cost4 | 15,966 | 271,422 | 606,708 | 4,241 | 10,112 |
| Mean length of stay1 and mean upper quartile cost5 | 20,078 | 341,326 | 762,964 | 5,333 | 12,716 |
| Median length of stay2 and mean lower quartile cost4 | 4,784 | 81,328 | 181,792 | 1,271 | 3,030 |
| Median length of stay2 and mean upper quartile cost5 | 6,016 | 102,272 | 228,608 | 1,598 | 3,810 |
| 153.4 days | |||||
| Outcome or subgroup title | No. of studies | No. of participants | Statistical method | Effect size |
| 1.1 Global state: 1. Not improved or worsened Show forest plot | 3 | Risk Ratio (M‐H, Fixed, 95% CI) | Subtotals only | |
| 1.1.1 short term (CGI/MDRS) | 3 | 125 | Risk Ratio (M‐H, Fixed, 95% CI) | 0.80 [0.57, 1.12] |
| 1.1.2 medium term (MDRS) | 1 | 50 | Risk Ratio (M‐H, Fixed, 95% CI) | 1.12 [0.79, 1.58] |
| 1.2 Global state: 2. Relapse Show forest plot | 3 | 124 | Risk Ratio (M‐H, Random, 95% CI) | 0.35 [0.07, 1.68] |
| 1.2.1 short term | 1 | 38 | Risk Ratio (M‐H, Random, 95% CI) | 0.25 [0.06, 1.03] |
| 1.2.2 long term | 2 | 86 | Risk Ratio (M‐H, Random, 95% CI) | 0.39 [0.05, 3.31] |
| 1.3 Global state: 3. Percentage of time in prodrome state (skewed data) Show forest plot | 1 | Other data | No numeric data | |
| 1.3.1 one‐year data | 1 | Other data | No numeric data | |
| 1.3.2 two‐year data | 1 | Other data | No numeric data | |
| 1.4 Global state: 4. Percentage of time in exacerbated state (skewed data) Show forest plot | 1 | Other data | No numeric data | |
| 1.4.1 one‐year data | 1 | Other data | No numeric data | |
| 1.4.2 two‐year data | 1 | Other data | No numeric data | |
| 1.5 Global state: 5. average score: CGI ‐ severity of illness score (high = poor) Show forest plot | 1 | Mean Difference (IV, Fixed, 95% CI) | Subtotals only | |
| 1.5.1 short term | 1 | 36 | Mean Difference (IV, Fixed, 95% CI) | ‐0.77 [‐1.39, ‐0.15] |
| 1.6 Leaving the study early: 1. Non‐specific reasons Show forest plot | 5 | 363 | Risk Ratio (M‐H, Fixed, 95% CI) | 0.73 [0.49, 1.10] |
| 1.6.1 short term | 2 | 227 | Risk Ratio (M‐H, Fixed, 95% CI) | 0.68 [0.43, 1.07] |
| 1.6.2 medium term | 1 | 50 | Risk Ratio (M‐H, Fixed, 95% CI) | 5.00 [0.25, 99.16] |
| 1.6.3 long term | 2 | 86 | Risk Ratio (M‐H, Fixed, 95% CI) | 0.69 [0.24, 1.97] |
| 1.7 Leaving the study early: 2. Specific reason ‐ short term Show forest plot | 3 | Risk Ratio (M‐H, Fixed, 95% CI) | Subtotals only | |
| 1.7.1 administrative/hospital transfer | 1 | 37 | Risk Ratio (M‐H, Fixed, 95% CI) | 1.06 [0.07, 15.64] |
| 1.7.2 AWOL | 1 | 37 | Risk Ratio (M‐H, Fixed, 95% CI) | 1.06 [0.07, 15.64] |
| 1.7.3 court cases, transfer, eloped | 1 | 190 | Risk Ratio (M‐H, Fixed, 95% CI) | 10.65 [1.39, 81.58] |
| 1.7.4 incorrect diagnosis | 1 | 190 | Risk Ratio (M‐H, Fixed, 95% CI) | 1.07 [0.07, 16.78] |
| 1.7.5 marked early remission | 1 | 190 | Risk Ratio (M‐H, Fixed, 95% CI) | 2.13 [0.20, 23.10] |
| 1.7.6 serious complication of treatment | 1 | 190 | Risk Ratio (M‐H, Fixed, 95% CI) | 11.71 [0.66, 208.85] |
| 1.7.7 severe extrapyramidal effects | 1 | 50 | Risk Ratio (M‐H, Fixed, 95% CI) | 3.00 [0.13, 70.30] |
| 1.7.8 treatment failure | 1 | 190 | Risk Ratio (M‐H, Fixed, 95% CI) | 0.11 [0.03, 0.35] |
| 1.8 Leaving the study early: 3. Marked improvement/ hospital discharge Show forest plot | 1 | Risk Ratio (M‐H, Fixed, 95% CI) | Subtotals only | |
| 1.8.1 discharged due to marked improvement | 1 | 36 | Risk Ratio (M‐H, Fixed, 95% CI) | 3.00 [0.13, 69.09] |
| 1.9 Adverse effects: 1. Anticholinergic effects ‐ short term Show forest plot | 2 | Risk Ratio (M‐H, Fixed, 95% CI) | Subtotals only | |
| 1.9.1 blurred vision | 1 | 37 | Risk Ratio (M‐H, Fixed, 95% CI) | 5.26 [0.27, 102.66] |
| 1.9.2 constipation | 1 | 190 | Risk Ratio (M‐H, Fixed, 95% CI) | 2.22 [1.19, 4.15] |
| 1.9.3 drooling | 1 | 37 | Risk Ratio (M‐H, Fixed, 95% CI) | 3.16 [0.14, 72.84] |
| 1.9.4 dryness mouth or throat | 2 | 227 | Risk Ratio (M‐H, Fixed, 95% CI) | 3.62 [1.39, 9.42] |
| 1.9.5 gastrointestinal distress and nausea | 2 | 227 | Risk Ratio (M‐H, Fixed, 95% CI) | 0.90 [0.30, 2.72] |
| 1.9.6 increased salivation | 1 | 190 | Risk Ratio (M‐H, Fixed, 95% CI) | 18.10 [1.06, 309.15] |
| 1.9.7 nasal congestion | 1 | 37 | Risk Ratio (M‐H, Fixed, 95% CI) | 3.16 [0.14, 72.84] |
| 1.9.8 urinary disturbance | 1 | 190 | Risk Ratio (M‐H, Fixed, 95% CI) | 3.20 [0.34, 30.17] |
| 1.9.9 vomiting | 1 | 190 | Risk Ratio (M‐H, Fixed, 95% CI) | 5.32 [0.26, 109.41] |
| 1.10 Adverse effects: 2. Cardivascular effects ‐ short term Show forest plot | 2 | Risk Ratio (M‐H, Fixed, 95% CI) | Subtotals only | |
| 1.10.1 dizziness, faintness, weakness | 1 | 190 | Risk Ratio (M‐H, Fixed, 95% CI) | 2.34 [0.85, 6.49] |
| 1.10.2 hypotension | 1 | 37 | Risk Ratio (M‐H, Fixed, 95% CI) | 3.16 [0.14, 72.84] |
| 1.10.3 syncope | 1 | 37 | Risk Ratio (M‐H, Fixed, 95% CI) | 3.16 [0.14, 72.84] |
| 1.10.4 tachycardia | 1 | 37 | Risk Ratio (M‐H, Fixed, 95% CI) | 3.16 [0.14, 72.84] |
| 1.11 Adverse effects: 3. CNS ‐ short term Show forest plot | 2 | Risk Ratio (M‐H, Fixed, 95% CI) | Subtotals only | |
| 1.11.1 anxiety, agitation, excitement and confusion | 1 | 37 | Risk Ratio (M‐H, Fixed, 95% CI) | 1.06 [0.17, 6.72] |
| 1.11.2 convulsion or seizures | 1 | 190 | Risk Ratio (M‐H, Fixed, 95% CI) | 0.35 [0.01, 8.60] |
| 1.11.3 depression | 1 | 37 | Risk Ratio (M‐H, Fixed, 95% CI) | 0.35 [0.02, 8.09] |
| 1.11.4 drowsiness | 1 | 190 | Risk Ratio (M‐H, Fixed, 95% CI) | 3.91 [1.98, 7.71] |
| 1.11.5 headache | 1 | 190 | Risk Ratio (M‐H, Fixed, 95% CI) | 1.17 [0.52, 2.63] |
| 1.11.6 sedation and lethargy | 1 | 37 | Risk Ratio (M‐H, Fixed, 95% CI) | 1.06 [0.31, 3.60] |
| 1.12 Adverse effects: 4. Death ‐ long term Show forest plot | 1 | 50 | Risk Ratio (M‐H, Fixed, 95% CI) | 2.38 [0.10, 55.72] |
| 1.13 Adverse effects: 5. Endocrine ‐ short term Show forest plot | 1 | Risk Ratio (M‐H, Fixed, 95% CI) | Subtotals only | |
| 1.13.1 amenorrhea | 1 | 190 | Risk Ratio (M‐H, Fixed, 95% CI) | 1.07 [0.27, 4.14] |
| 1.13.2 lactation | 1 | 190 | Risk Ratio (M‐H, Fixed, 95% CI) | 7.45 [0.39, 142.32] |
| 1.13.3 swelling of breasts | 1 | 190 | Risk Ratio (M‐H, Fixed, 95% CI) | 5.32 [0.26, 109.41] |
| 1.14 Adverse effects: 6a. Extrapyramidal effects ‐ short term Show forest plot | 2 | Risk Ratio (M‐H, Fixed, 95% CI) | Subtotals only | |
| 1.14.1 akinesia | 1 | 37 | Risk Ratio (M‐H, Fixed, 95% CI) | 3.16 [0.14, 72.84] |
| 1.14.2 akathisia | 2 | 227 | Risk Ratio (M‐H, Fixed, 95% CI) | 3.43 [1.23, 9.56] |
| 1.14.3 associated movements | 1 | 37 | Risk Ratio (M‐H, Fixed, 95% CI) | 7.37 [0.41, 133.37] |
| 1.14.4 dystonia | 1 | 190 | Risk Ratio (M‐H, Fixed, 95% CI) | 13.84 [0.79, 242.25] |
| 1.14.5 facial rigidity | 1 | 190 | Risk Ratio (M‐H, Fixed, 95% CI) | 2.77 [1.03, 7.46] |
| 1.14.6 loss of associated movements | 1 | 190 | Risk Ratio (M‐H, Fixed, 95% CI) | 6.39 [1.95, 20.98] |
| 1.14.7 restlessness, insomnia | 2 | 227 | Risk Ratio (M‐H, Fixed, 95% CI) | 0.99 [0.69, 1.40] |
| 1.14.8 rigidity | 2 | 227 | Risk Ratio (M‐H, Fixed, 95% CI) | 3.54 [1.76, 7.14] |
| 1.14.9 tremor | 2 | 227 | Risk Ratio (M‐H, Fixed, 95% CI) | 3.19 [1.25, 8.11] |
| 1.15 Adverse effects: 6b. Extrapyramidal effects ‐ medium term Show forest plot | 1 | Risk Ratio (M‐H, Fixed, 95% CI) | Subtotals only | |
| 1.15.1 akathisia | 1 | 50 | Risk Ratio (M‐H, Fixed, 95% CI) | 1.20 [0.42, 3.43] |
| 1.15.2 akinesia | 1 | 50 | Risk Ratio (M‐H, Fixed, 95% CI) | 11.00 [0.64, 188.95] |
| 1.15.3 dystonia | 1 | 50 | Risk Ratio (M‐H, Fixed, 95% CI) | 1.09 [0.92, 1.29] |
| 1.15.4 parkinsonism | 1 | 50 | Risk Ratio (M‐H, Fixed, 95% CI) | 5.50 [1.36, 22.32] |
| 1.16 Adverse effects: 7. Others ‐ short term Show forest plot | 2 | Risk Ratio (M‐H, Fixed, 95% CI) | Subtotals only | |
| 1.16.1 convulsion or seizures | 1 | 190 | Risk Ratio (M‐H, Fixed, 95% CI) | 0.35 [0.01, 8.60] |
| 1.16.2 diarrhoea | 1 | 190 | Risk Ratio (M‐H, Fixed, 95% CI) | 5.32 [0.26, 109.41] |
| 1.16.3 intercurrent infection | 1 | 190 | Risk Ratio (M‐H, Fixed, 95% CI) | 1.07 [0.22, 5.14] |
| 1.16.4 rash | 2 | 227 | Risk Ratio (M‐H, Fixed, 95% CI) | 0.76 [0.15, 3.78] |
| 1.17 Sensitivity analysis: 1. CHRONIC versus ACUTE Show forest plot | 2 | Risk Ratio (M‐H, Fixed, 95% CI) | Subtotals only | |
| 1.17.1 Acute: Global state ‐ not improved ‐ short term | 1 | 37 | Risk Ratio (M‐H, Fixed, 95% CI) | 0.59 [0.24, 1.42] |
| 1.17.2 Chronic: global state ‐ not improved ‐ short term | 1 | 50 | Risk Ratio (M‐H, Fixed, 95% CI) | 0.93 [0.56, 1.55] |
| 1.18 Sensitivity analysis: 2. LOW DOSES (1‐5 mg/day) versus HIGH DOSES (5mg/day>) Show forest plot | 3 | Risk Ratio (M‐H, Fixed, 95% CI) | Subtotals only | |
| 1.18.1 High dose: Global state ‐ not improved ‐ short term | 1 | 38 | Risk Ratio (M‐H, Fixed, 95% CI) | 0.79 [0.48, 1.31] |
| 1.18.2 Flexible dose: Global state ‐ not improved ‐ short term | 2 | 87 | Risk Ratio (M‐H, Fixed, 95% CI) | 0.80 [0.51, 1.25] |
| 1.19 Sensitivity analysis: 3. OPERATIONAL CRITERIA versus LOOSE DEFINITIONS Show forest plot | 3 | Risk Ratio (M‐H, Fixed, 95% CI) | Subtotals only | |
| 1.19.1 DSM‐III‐R: Global state ‐ not improved ‐ short term | 1 | 38 | Risk Ratio (M‐H, Fixed, 95% CI) | 0.79 [0.48, 1.31] |
| 1.19.2 Loose definition: global state ‐ not improved ‐ short term | 2 | 87 | Risk Ratio (M‐H, Fixed, 95% CI) | 0.80 [0.51, 1.25] |
| 1.20 Sensitivity analysis: 4. BEFORE 1990 versus AFTER 1990 Show forest plot | 3 | Risk Ratio (M‐H, Fixed, 95% CI) | Subtotals only | |
| 1.20.1 Before 1990: Global state ‐ not improved ‐ short term | 2 | 87 | Risk Ratio (M‐H, Fixed, 95% CI) | 0.80 [0.51, 1.25] |
| 1.20.2 After 1990: Global state ‐ not improved ‐ short term | 1 | 38 | Risk Ratio (M‐H, Fixed, 95% CI) | 0.79 [0.48, 1.31] |