| 1 Pain (0 to 10 point scale) Show forest plot | 5 | | Mean Difference (IV, Random, 95% CI) | Subtotals only |
|
| 1.1 1 to 2 weeks | 5 | 539 | Mean Difference (IV, Random, 95% CI) | ‐0.25 [‐0.82, 0.33] |
| 1.2 1 month | 5 | 535 | Mean Difference (IV, Random, 95% CI) | ‐0.73 [‐1.18, ‐0.28] |
| 1.3 3 months | 4 | 395 | Mean Difference (IV, Random, 95% CI) | ‐0.48 [‐1.01, 0.05] |
| 1.4 6 months | 3 | 338 | Mean Difference (IV, Random, 95% CI) | ‐0.59 [‐1.18, 0.01] |
| 1.5 12 months | 3 | 265 | Mean Difference (IV, Random, 95% CI) | ‐0.42 [‐1.02, 0.18] |
| 1.6 24 months | 1 | 57 | Mean Difference (IV, Random, 95% CI) | ‐1.1 [‐2.68, 0.48] |
| 2 Proportion of participants with pain improved by a clinically relevant amount (>2.5 units or 30% on a 0 or 1 to 10 scale from baseline or less than 4 out of 10 Show forest plot | 4 | | Risk Ratio (M‐H, Random, 95% CI) | Subtotals only |
|
| 2.1 1 to 2 weeks | 2 | 198 | Risk Ratio (M‐H, Random, 95% CI) | 1.43 [0.78, 2.60] |
| 2.2 1 month | 3 | 326 | Risk Ratio (M‐H, Random, 95% CI) | 1.53 [0.99, 2.36] |
| 2.3 3 months | 2 | 198 | Risk Ratio (M‐H, Random, 95% CI) | 1.60 [1.12, 2.30] |
| 2.4 6 months | 2 | 198 | Risk Ratio (M‐H, Random, 95% CI) | 1.38 [1.02, 1.87] |
| 2.5 12 months | 2 | 230 | Risk Ratio (M‐H, Random, 95% CI) | 1.29 [1.06, 1.58] |
| 2.6 24 months | 1 | 78 | Risk Ratio (M‐H, Random, 95% CI) | 1.43 [0.84, 2.42] |
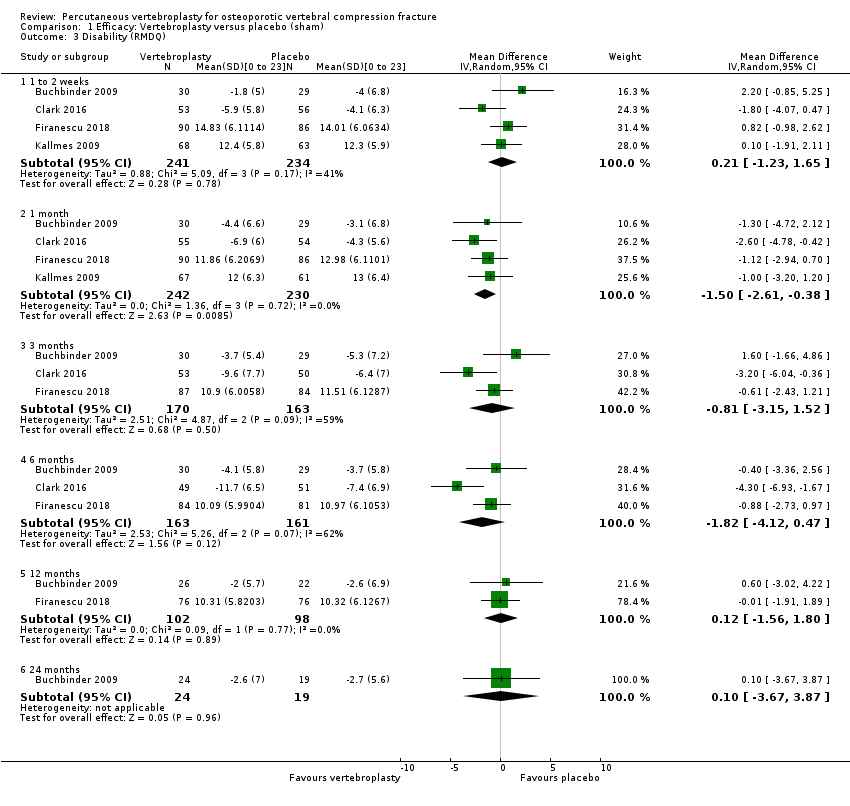
| 3 Disability (RMDQ) Show forest plot | 4 | | Mean Difference (IV, Random, 95% CI) | Subtotals only |
|
| 3.1 1 to 2 weeks | 4 | 475 | Mean Difference (IV, Random, 95% CI) | 0.21 [‐1.23, 1.65] |
| 3.2 1 month | 4 | 472 | Mean Difference (IV, Random, 95% CI) | ‐1.50 [‐2.61, ‐0.38] |
| 3.3 3 months | 3 | 333 | Mean Difference (IV, Random, 95% CI) | ‐0.81 [‐3.15, 1.52] |
| 3.4 6 months | 3 | 324 | Mean Difference (IV, Random, 95% CI) | ‐1.82 [‐4.12, 0.47] |
| 3.5 12 months | 2 | 200 | Mean Difference (IV, Random, 95% CI) | 0.12 [‐1.56, 1.80] |
| 3.6 24 months | 1 | 43 | Mean Difference (IV, Random, 95% CI) | 0.10 [‐3.67, 3.87] |
| 4 Quality of life (QUALEFFO) [0 to 100] Show forest plot | 3 | | Mean Difference (IV, Random, 95% CI) | Subtotals only |
|
| 4.1 1 to 2 weeks | 3 | 352 | Mean Difference (IV, Random, 95% CI) | ‐3.10 [‐6.96, 0.75] |
| 4.2 1 month | 3 | 351 | Mean Difference (IV, Random, 95% CI) | ‐2.33 [‐6.06, 1.41] |
| 4.3 3 months | 2 | 244 | Mean Difference (IV, Random, 95% CI) | ‐0.42 [‐4.23, 3.39] |
| 4.4 6 months | 3 | 330 | Mean Difference (IV, Random, 95% CI) | ‐1.88 [‐6.66, 2.91] |
| 4.5 12 months | 2 | 219 | Mean Difference (IV, Random, 95% CI) | ‐1.32 [‐5.41, 2.77] |
| 4.6 24 months | 1 | 57 | Mean Difference (IV, Random, 95% CI) | 1.30 [‐5.48, 8.08] |
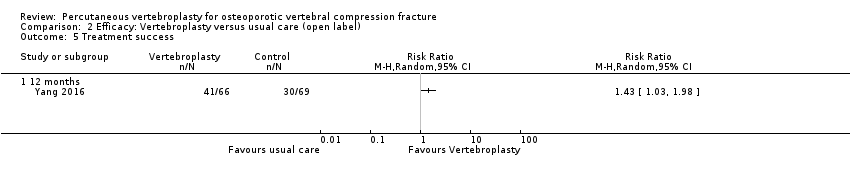
| 5 Treatment success Show forest plot | 1 | | Risk Ratio (M‐H, Random, 95% CI) | Totals not selected |
|
| 5.1 1 week | 1 | | Risk Ratio (M‐H, Random, 95% CI) | 0.0 [0.0, 0.0] |
| 5.2 1 month | 1 | | Risk Ratio (M‐H, Random, 95% CI) | 0.0 [0.0, 0.0] |
| 5.3 3 months | 1 | | Risk Ratio (M‐H, Random, 95% CI) | 0.0 [0.0, 0.0] |
| 5.4 6 months | 1 | | Risk Ratio (M‐H, Random, 95% CI) | 0.0 [0.0, 0.0] |
| 5.5 12 months | 1 | | Risk Ratio (M‐H, Random, 95% CI) | 0.0 [0.0, 0.0] |
| 5.6 24 months | 1 | | Risk Ratio (M‐H, Random, 95% CI) | 0.0 [0.0, 0.0] |
| 6 Quality of Life (EQ5D) Show forest plot | 4 | | Mean Difference (IV, Random, 95% CI) | Subtotals only |
|
| 6.1 1 to 2 weeks | 2 | 164 | Mean Difference (IV, Random, 95% CI) | 0.01 [‐0.03, 0.05] |
| 6.2 1 month | 3 | 285 | Mean Difference (IV, Random, 95% CI) | 0.05 [0.01, 0.09] |
| 6.3 3 months | 3 | 203 | Mean Difference (IV, Random, 95% CI) | 0.04 [‐0.00, 0.08] |
| 6.4 6 months | 2 | 156 | Mean Difference (IV, Random, 95% CI) | 0.06 [0.01, 0.10] |
| 6.5 12 months | 2 | 93 | Mean Difference (IV, Random, 95% CI) | ‐0.05 [‐0.17, 0.07] |
| 6.6 24 months | 1 | 44 | Mean Difference (IV, Random, 95% CI) | 0.0 [‐0.24, 0.24] |


![Comparison 1 Efficacy: Vertebroplasty versus placebo (sham), Outcome 4 Quality of life (QUALEFFO) [0 to 100].](/es/cdsr/doi/10.1002/14651858.CD006349.pub4/media/CDSR/CD006349/image_n/nCD006349-CMP-001-04.png)


![Comparison 2 Efficacy: Vertebroplasty versus usual care (open label), Outcome 2 Disability (RMDQ [0 to 24] or ODI [0 to 100]).](/es/cdsr/doi/10.1002/14651858.CD006349.pub4/media/CDSR/CD006349/image_n/nCD006349-CMP-002-02.png)


![Comparison 9 Sensitivity analysis, Outcome 4 Disability at 1 to 2 weeks (RMDQ [0 to 24] or ODI [0 to 100])).](/es/cdsr/doi/10.1002/14651858.CD006349.pub4/media/CDSR/CD006349/image_n/nCD006349-CMP-009-04.png)
![Comparison 9 Sensitivity analysis, Outcome 5 Disability at 1 month (RMDQ [0 to 24] or ODI [0 to 100]).](/es/cdsr/doi/10.1002/14651858.CD006349.pub4/media/CDSR/CD006349/image_n/nCD006349-CMP-009-05.png)
![Comparison 9 Sensitivity analysis, Outcome 6 Disability at 3 months (RMDQ [0 to 24] or ODI [0 to 100]).](/es/cdsr/doi/10.1002/14651858.CD006349.pub4/media/CDSR/CD006349/image_n/nCD006349-CMP-009-06.png)