Scolaris Content Display Scolaris Content Display

Study flow diagram.
Figuras y tablas -
Figure 1

Study flow diagram.

Risk of bias graph: review authors' judgements about each risk of bias item presented as percentages across all included studies.
Figuras y tablas -
Figure 2

Risk of bias graph: review authors' judgements about each risk of bias item presented as percentages across all included studies.

Risk of bias summary: review authors' judgements about each risk of bias item for each included study.
Figuras y tablas -
Figure 3

Risk of bias summary: review authors' judgements about each risk of bias item for each included study.

Comparison 1 Methylnatrexone versus placebo: rescue‐free laxation:, Outcome 1 Within 24 hours of dose.
Figuras y tablas -
Analysis 1.1

Comparison 1 Methylnatrexone versus placebo: rescue‐free laxation:, Outcome 1 Within 24 hours of dose.

Comparison 1 Methylnatrexone versus placebo: rescue‐free laxation:, Outcome 2 Within 4 hours after 4 of the 7 doses.
Figuras y tablas -
Analysis 1.2

Comparison 1 Methylnatrexone versus placebo: rescue‐free laxation:, Outcome 2 Within 4 hours after 4 of the 7 doses.

Comparison 1 Methylnatrexone versus placebo: rescue‐free laxation:, Outcome 3 Within 4 hours of first dose.
Figuras y tablas -
Analysis 1.3

Comparison 1 Methylnatrexone versus placebo: rescue‐free laxation:, Outcome 3 Within 4 hours of first dose.

Comparison 1 Methylnatrexone versus placebo: rescue‐free laxation:, Outcome 4 Within 4 hours after 1 or 2 doses of the first 4 doses.
Figuras y tablas -
Analysis 1.4

Comparison 1 Methylnatrexone versus placebo: rescue‐free laxation:, Outcome 4 Within 4 hours after 1 or 2 doses of the first 4 doses.

Comparison 1 Methylnatrexone versus placebo: rescue‐free laxation:, Outcome 5 Improvement in constipation distress at day 1.
Figuras y tablas -
Analysis 1.5

Comparison 1 Methylnatrexone versus placebo: rescue‐free laxation:, Outcome 5 Improvement in constipation distress at day 1.

Comparison 1 Methylnatrexone versus placebo: rescue‐free laxation:, Outcome 6 Participant global impression of improvement in bowel status at 1 week.
Figuras y tablas -
Analysis 1.6

Comparison 1 Methylnatrexone versus placebo: rescue‐free laxation:, Outcome 6 Participant global impression of improvement in bowel status at 1 week.

Comparison 1 Methylnatrexone versus placebo: rescue‐free laxation:, Outcome 7 Clinician global impression of improvement in bowel status at 1 week.
Figuras y tablas -
Analysis 1.7

Comparison 1 Methylnatrexone versus placebo: rescue‐free laxation:, Outcome 7 Clinician global impression of improvement in bowel status at 1 week.

Comparison 2 Methylnaltrexone versus placebo: serious adverse event, Outcome 1 Serious adverse event.
Figuras y tablas -
Analysis 2.1

Comparison 2 Methylnaltrexone versus placebo: serious adverse event, Outcome 1 Serious adverse event.

Comparison 3 Methylnaltrexone versus placebo: adverse event, Outcome 1 Adverse events.
Figuras y tablas -
Analysis 3.1

Comparison 3 Methylnaltrexone versus placebo: adverse event, Outcome 1 Adverse events.

Comparison 3 Methylnaltrexone versus placebo: adverse event, Outcome 2 Dropouts due to adverse event.
Figuras y tablas -
Analysis 3.2

Comparison 3 Methylnaltrexone versus placebo: adverse event, Outcome 2 Dropouts due to adverse event.

Comparison 4 Oxycodone/naloxone prolonged‐release tablets versus oxycodone prolonged‐release: adverse event, Outcome 1 Adverse events.
Figuras y tablas -
Analysis 4.1

Comparison 4 Oxycodone/naloxone prolonged‐release tablets versus oxycodone prolonged‐release: adverse event, Outcome 1 Adverse events.

Summary of findings for the main comparison. Naldemedine compared to placebo for opioid‐induced bowel dysfunction in cancer and people receiving palliative care

Naldemedine compared to placebo for opioid‐induced bowel dysfunction in cancer and people receiving palliative care

Patient or population: people with cancer and people receiving palliative care with opioid‐induced bowel dysfunction

Settings: cancer care

Intervention: naldemedine

Comparison: placebo

Outcomes

Illustrative comparative risks* (95% CI)

Relative effect
(95% CI)

No of participants
(studies)

Quality of the evidence
(GRADE)

Comments

Assumed risk

Corresponding risk

Placebo

Naldemedine

Laxation response within 24 hours of dose

Not reported

Laxation response between day 1 and day 14a

375 per 1000

724 per 1000
(510 to 1000)

RR 1.93 (1.36 to 2.74)

NNTB 2.88 (2.04 to 4.92)

225 (1 study)

⊕⊕⊕⊝

Moderateb

Effect on analgesia: opioid withdrawalc

0.1 mg: MD ‐0.13 (‐0.57 to 0.31); 0.2 mg: MD ‐0.40 (‐0.87 to 0.07); 0.4 mg: MD ‐0.02 (‐0.45 to 0.41)

225 (1 study)

⊕⊕⊕⊝

Moderateb

Effect on analgesia: pain intensity

Not reported

Serious adverse eventsa

5 SAEs occurred, all in naldemedine group.

225 (1 study)

⊕⊕⊝⊝
Lowb,d

Adverse eventsa

518 per 1000

704 per 1000 (539 to 927)

RR 1.36 (1.04 to 1.79)

225 (1 study)

⊕⊕⊕⊝

Moderateb

*The basis for the assumed risk (e.g. the median control group risk across studies) is provided in footnotes. The corresponding risk (and its 95% confidence interval) is based on the assumed risk in the comparison group and the relative effect of the intervention (and its 95% CI).

CI: confidence interval; MD: mean difference; NNTB: number needed to treat for an additional beneficial outcome; RR: risk ratio; SAE: serious adverse events.

GRADE Working Group grades of evidence
High quality: we are very confident that the true effect lies close to that of the estimate of the effect.
Moderate quality: we are moderately confident in the effect estimate; the true effect is likely to be close to the estimate of effect, but there is a possibility that it is substantially different.
Low quality: our confidence in the effect estimate is limited; the true effect may be substantially different from the estimate of the effect.
Very low quality: we have very little confidence in the effect estimate; the true effect is likely to be substantially different from the estimate of effect.

aMeasured by clinician or self‐report and in the case of adverse events using severity grades according to the Common Terminology Criteria for Adverse Events.
bDowngraded by one level for limitations to the study design due to unclear risk of bias (reporting bias).
cMeasured by Clinical Opiate Withdrawal Scale.
dDowngraded by one level for imprecision due to limited number of events.

Figuras y tablas -
Summary of findings for the main comparison. Naldemedine compared to placebo for opioid‐induced bowel dysfunction in cancer and people receiving palliative care
Summary of findings 2. Lower‐dose naldemedine compared to higher‐dose naldemedine for opioid‐induced bowel dysfunction in cancer and people receiving palliative care

Lower‐dose naldemedine compared to higher‐dose naldemedine for opioid‐induced bowel dysfunction in cancer and people receiving palliative care

Patient or population: people with cancer and people receiving palliative care with opioid‐induced bowel dysfunction

Setting: cancer care

Intervention: lower dose naldemedine 0.1 mg daily

Comparison: higher dose naldemedine 0.2 mg or 0.4 mg daily

Outcomes

Illustrative comparative risks* (95% CI)

Relative effect
(95% CI)

No of participants
(studies)

Quality of the evidence
(GRADE)

Comments

Assumed risk

Corresponding risk

Higher dose

0.2 mg/0.4 mg daily

Lower dose

0.1 mg daily

Laxation response within 24 hours of dose

Not reported

Laxation response between day 1 and day 14a

0.1 mg vs 0.2 mg: 776 per 1000

0.1 mg vs 0.4 mg: 821 per 1000

0.1 mg vs 0.2 mg: 564 per 1000

(430 to 739)

0.1 mg vs 0.4 mg: 564 per 1000

(433 to 733)

0.1 mg vs 0.2 mg: RR 0.73 (0.55 to 0.95)

0.1 mg vs 0.4 mg: RR 0.69 (0.53 to 0.89)

226 (1 study)

0.1 mg vs 0.2 mg: n = 113

0.1 mg vs 0.4 mg: n = 111

⊕⊕⊕⊝

Moderateb

Effect on analgesia: opioid withdrawal

Not reported

Effect on analgesia: pain intensity

Not reported

Serious adverse events

Not reported

Adverse events

Not reported

*The basis for the assumed risk (e.g. the median control group risk across studies) is provided in footnotes. The corresponding risk (and its 95% confidence interval) is based on the assumed risk in the comparison group and the relative effect of the intervention (and its 95% CI).
CI: confidence interval; RR: risk ratio.

GRADE Working Group grades of evidence
High quality: we are very confident that the true effect lies close to that of the estimate of the effect.
Moderate quality: we are moderately confident in the effect estimate; the true effect is likely to be close to the estimate of effect, but there is a possibility that it is substantially different.
Low quality: our confidence in the effect estimate is limited; the true effect may be substantially different from the estimate of the effect.
Very low quality: we have very little confidence in the effect estimate; the true effect is likely to be substantially different from the estimate of effect.

aMeasured by self‐report.
bDowngraded by one level for limitations to the study design due to unclear risk of bias (reporting bias).

Figuras y tablas -
Summary of findings 2. Lower‐dose naldemedine compared to higher‐dose naldemedine for opioid‐induced bowel dysfunction in cancer and people receiving palliative care
Summary of findings 3. Naloxone compared with placebo for cancer and people receiving palliative care with opioid‐induced bowel dysfunction

Naloxone compared with placebo for cancer and people receiving palliative care with opioid‐induced bowel dysfunction

Patient or population: people with cancer and people receiving palliative care with opioid‐induced bowel dysfunction

Settings: cancer care

Intervention: naloxone

Comparison: placebo

Outcomes

Illustrative comparative risks*

Relative effect

No of participants
(studies)

Quality of the evidence
(GRADE)

Comments

Assumed risk

Corresponding risk

Placebo

Naloxone

Laxation response within 24 hours of a dose

Not reported

Laxation response between day 1 and day 14

Not reported

Effect on analgesia: opioid withdrawal

Not reported

Effect on analgesia: pain intensitya

No statistical difference in pain experienced when taking placebo or naloxone. Full data, including pre‐cross‐over results, were not provided.

17 (1 study)

⊕⊝⊝⊝
Very lowb

Serious adverse events

Not reported

Adverse events

Not reported

*The basis for the assumed risk (e.g. the median control group risk across studies) is provided in footnotes. The corresponding risk (and its 95% confidence interval) is based on the assumed risk in the comparison group and the relative effect of the intervention (and its 95% CI).

GRADE Working Group grades of evidence
High quality: we are very confident that the true effect lies close to that of the estimate of the effect.
Moderate quality: we are moderately confident in the effect estimate; the true effect is likely to be close to the estimate of effect, but there is a possibility that it is substantially different.
Low quality: our confidence in the effect estimate is limited; the true effect may be substantially different from the estimate of the effect.
Very low quality: we have very little confidence in the effect estimate; the true effect is likely to be substantially different from the estimate of effect.

aMeasured using 4‐point scale (0 = no pain, 3 = severe pain).
bDowngraded by three levels due to evidence from one study with a small sample size, which was a cross‐over study with no drug washout between cross‐over, and unclear risk of reporting bias.

Figuras y tablas -
Summary of findings 3. Naloxone compared with placebo for cancer and people receiving palliative care with opioid‐induced bowel dysfunction
Summary of findings 4. Oxycodone/naloxone prolonged release tablets compared with oxycodone prolonged‐released tablets for opioid‐induced bowel dysfunction

Oxycodone/naloxone prolonged release tablets compared with oxycodone prolonged‐released tablets for opioid‐induced bowel dysfunction

Patient or population: people with cancer and people receiving palliative care with opioid‐induced bowel dysfunction

Settings: cancer care

Intervention: oxycodone/naloxone prolonged‐release tablets

Comparison: oxycodone prolonged‐released tablets

Outcomes

Illustrative comparative risks* (95% CI)

Relative effect

No of participants
(studies)

Quality of the evidence
(GRADE)

Comments

Assumed risk

Corresponding risk

Oxycodone

Oxycodone/naloxone

Laxation response within 24 hours of dose

Not reported

Laxation response between day 1 and day 14

Not reported

Effect on analgesia: opioid withdrawalc

Intervention group: mean 6.64 (SD 5.97) comparison group: mean 7.29 (SD 4.59) at 7 days

184 (1 study)

⊕⊕⊕⊝

Moderateb

Effect on analgesia: pain intensitya

Intervention group: mean 3.50 (SD 1.88) and comparison group: mean 3.52 (SD 1.80) at 4 weeks

184 (1 study)

⊕⊕⊕⊝

Moderateb

Another study, Dupoiron 2017 also found outcome to be similar between trial arms, but did not provide any data.

Serious adverse events

43 per 1000

87 per 1000 (27 to 279)

RR 2.00 (95% CI 0.62 to 6.41)

184 (1 study)

⊕⊕⊝⊝

Lowb,d

Adverse events

754 per 1000

815 per 1000 (709 to 935)

RR 1.08 (95% CI 0.94 to 1.24)

234 (2 studies)

⊕⊕⊕⊝

Moderateb

*The basis for the assumed risk (e.g. the median control group risk across studies) is provided in footnotes. The corresponding risk (and its 95% confidence interval) is based on the assumed risk in the comparison group and the relative effect of the intervention (and its 95% CI).

CI: confidence interval; RR: risk ratio; SD: standard deviation.

GRADE Working Group grades of evidence
High quality: we are very confident that the true effect lies close to that of the estimate of the effect.
Moderate quality: we are moderately confident in the effect estimate; the true effect is likely to be close to the estimate of effect, but there is a possibility that it is substantially different.
Low quality: our confidence in the effect estimate is limited; the true effect may be substantially different from the estimate of the effect.
Very low quality: we have very little confidence in the effect estimate; the true effect is likely to be substantially different from the estimate of effect.

aMeasured using the Brief Pain Inventory‐Short Form.
bDowngraded by one level because of study limitations (unclear risk of reporting bias).
cMeasured using the Modified Subjective Opiate Withdrawal Scale.
dDowngraded by one level due to imprecision because of wide confidence intervals.

Figuras y tablas -
Summary of findings 4. Oxycodone/naloxone prolonged release tablets compared with oxycodone prolonged‐released tablets for opioid‐induced bowel dysfunction
Summary of findings 5. Methylnaltrexone compared to placebo for opioid‐induced bowel dysfunction in cancer and people receiving palliative care

Methylnaltrexone compared to placebo for opioid‐induced bowel dysfunction in cancer and people receiving palliative care

Patient or population: people with cancer and people receiving palliative care with opioid‐induced bowel dysfunction

Setting: palliative care

Intervention: methylnaltrexone

Comparison: placebo

Outcomes

Anticipated absolute effects* (95% CI)

Relative effect
(95% CI)

No of participants
(studies)

Quality of the evidence
(GRADE)

Comments

Risk with placebo

Risk with

methylnaltrexone

Laxation response within 24 hours of dosea

195 per 1000

568 per 1000
(431 to 695)

RR 2.77 (1.91 to 4.04)

287
(2 studies)

⊕⊕⊕⊝

Moderateb

Laxation response between day 1 and day 14 (specifically within 4 hours after 4 or more of the 7 doses)a

52 per 1000

517 per 1000
(330 to 699)

RR 9.98 (4.96 to 20.09)

305
(2 studies)

⊕⊕⊕⊝

Moderate

b,c

Effect on analgesia: opioid withdrawald

Study 1: day 1: MD 0.00 (‐0.46 to 0.46); day 14: MD 0.10 (‐0.63 to 0.83)

Study 2: median change to day 2 = 0 in both trials arms

236

(2 studies)

⊕⊕⊕⊝

Moderateb

Effect on analgesia: pain intensitye

Study 1: at 4 hours (methylnaltrexone 0.15 mg/kg: MD ‐0.76 (‐1.47 to 0.05); methylnaltrexone 0.3 mg/kg: MD ‐0.25 (‐0.91 to 0.41)

Study 2: at day 1 and 14 (day 1: MD 0.20 (‐0.62 to 1.02); day 14: MD ‐0.70 (‐1.52 to 0.12)

287

(2 studies)

⊕⊕⊝⊝

Lowb,f

Another study, Bull 2015, found similar pain intensity experienced in trial arms, full data not provided.

Serious adverse events

238 per 1000

142 per 1000
(88 to 219)

RR 0.59 (0.38 to 0.93)

364
(2 studies)

⊕⊕⊕⊝

Moderateb

Adverse events

700 per 1000

815 per 1000
(745 to 869)

RR 1.17

(CI 0.94 to 1.45)

518
(3 studies)

⊕⊕⊝⊝

Lowb,g

Heterogeneity was substantial (74%). It was explained in sensitivity analysis by omitting the trial at a high risk of bias because of small sizes. The effect estimate was reduced. The direction of effect not changed.

*The risk in the intervention group (and its 95% confidence interval) is based on the assumed risk in the comparison group and the relative effect of the intervention (and its 95% CI).

CI: confidence interval; MD: mean difference; RR: risk ratio.

GRADE Working Group grades of evidence
High quality: we are very confident that the true effect lies close to that of the estimate of the effect.
Moderate quality: we are moderately confident in the effect estimate: the true effect is likely to be close to the estimate of the effect, but there is a possibility that it is substantially different.
Low quality: our confidence in the effect estimate is limited: the true effect may be substantially different from the estimate of the effect.
Very low quality: we have very little confidence in the effect estimate: the true effect is likely to be substantially different from the estimate of effect.

aMeasured by self‐report or clinician report.
bDowngraded once for study limitations because of unclear risk of reporting bias.
cWe did not downgrade for imprecision due to wide confidence intervals because the effect size was large.

dMeasured using the modified Himmelsbach Opioid Withdrawal Scale.
eMeasured by participant‐rated scale 0‐10.
fDowngraded once for inconsistency because of differing estimates of effect.
gDowngraded once for inconsistency because statistical heterogeneity was high across trials.

Figuras y tablas -
Summary of findings 5. Methylnaltrexone compared to placebo for opioid‐induced bowel dysfunction in cancer and people receiving palliative care
Summary of findings 6. Lower‐dose methylnaltrexone compared to higher‐dose methylnaltrexone for opioid‐induced bowel dysfunction in cancer and people receiving palliative care

Lower dose methylnaltrexone compared to higher dose for opioid‐induced bowel dysfunction in cancer and people receiving palliative care

Patient or population: people with cancer and people receiving palliative care with opioid‐induced bowel dysfunction

Setting: palliative care

Intervention 1: lower‐dose methylnaltrexone (study 1: 3 doses, 1 week, 1 mg; study 2: 1 dose, 0.15 mg/kg)

Intervention 2: higher‐dose methylnaltrexone (study 1: 3 doses, 1 week, 5‐12.5 mg; study 2: 1 dose, 0.30 mg/kg)

Outcomes

Illustrative comparative risks* (95% CI)

Relative effect
(95% CI)

No of participants
(studies)

Quality of the evidence
(GRADE)

Comments

Assumed risk

Corresponding risk

Higher dose

Lower dose

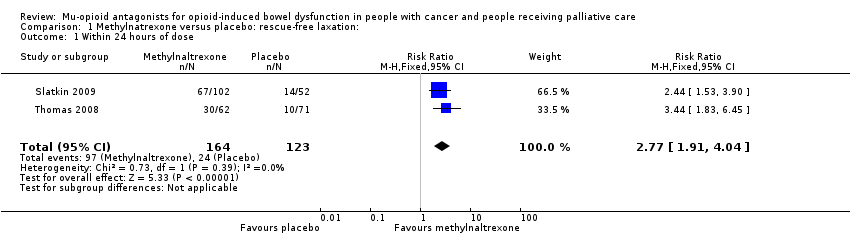
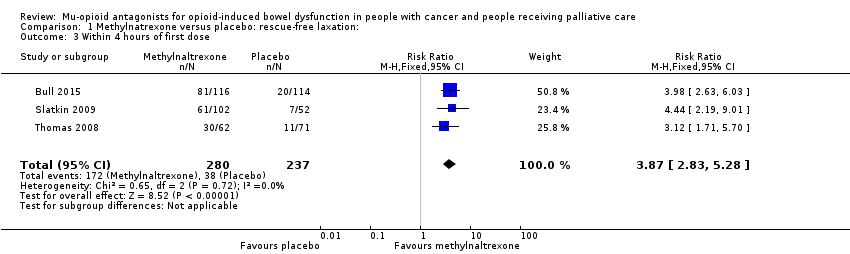
Laxation response within 24 hours of first dosea

Study 1: 609 per 1000

Study 2: 639 per 1000

Study 1: 499 per 1000 (250 to 100)

Study 2: 681 per 1000 (515 to 904)

Study 1: RR 0.82 (0.41 to 1.66)

Study 2: RR 1.07 (0.81 to 1.42)

135 (2 studies)

Study 1: n = 33

Study 2: n = 102

⊕⊕⊝⊝

Lowb

Unable to combine study data as methylnaltrexone low and higher doses differed per trial

Laxation responsea

At 3 days: 706 per 1000

At 3 days: 332 per 1000
(127 to 882)

At 3 days: RR 0.47 (0.18 to 1.25)

33 participants (1 study)

⊕⊕⊝⊝

Lowb

Unable to combine study data as methylnaltrexone low and higher doses differed per trial

At 5 days: 688 per 1000

At 5 days: 144 per 1000
(21 to 901)

At 3 days: RR 0.21 (0.03 to 1.31)

Effect on analgesia: opioid withdrawalc

MD ‐0.04 (‐0.73 to 0.65)

102 participants

(1 study)

⊕⊕⊝⊝

Lowb

Another study,Portenoy 2008, also found outcome to be similar between trial arms, but did not provide any data

Effect on analgesia: pain intensityd

MD ‐0.51 (‐1.49 to 0.47)

102 participants

(1 study)

⊕⊕⊝⊝

Lowb

Another study, Portenoy 2008, also found outcome to be similar between trial arms, but did not provide any data

Serious adverse event

Not reported

Adverse event

Study 1: 1000 per 1000

Study 2: 800 per 1000

Study 1: 1000 per 1000 (1000 to 1000)

Study 2: 723 per 1000

(580 to 902)

Study 1: RR 1.00 (1.00 to 1.00)

Study 2: RR 0.90 (0.73 to 1.13)

135 (2 studies)

Study 1: n = 33

Study 2: n = 102

⊕⊕⊝⊝

Lowb

Unable to combine study data as methylnaltrexone low and higher doses differed per trial

*The basis for the assumed risk (e.g. the median control group risk across studies) is provided in footnotes. The corresponding risk (and its 95% confidence interval) is based on the assumed risk in the comparison group and the relative effect of the intervention (and its 95% CI).

CI: confidence interval; MD: mean difference; RR: risk ratio.

GRADE Working Group grades of evidence
High quality: we are very confident that the true effect lies close to that of the estimate of the effect.
Moderate quality: we are moderately confident in the effect estimate; the true effect is likely to be close to the estimate of effect, but there is a possibility that it is substantially different.
Low quality: our confidence in the effect estimate is limited; the true effect may be substantially different from the estimate of the effect.
Very low quality: we have very little confidence in the effect estimate; the true effect is likely to be substantially different from the estimate of effect.

aMeasured by clinician or self‐report.

bDowngraded by two levels for study limitations: one for unclear risk of bias (reporting bias) and one for small sample size (high risk of bias).

cMeasured using the modified Himmelsbach Opioid Withdrawal Scale.

dMeasured by participant‐rated scale 0‐10.

Figuras y tablas -
Summary of findings 6. Lower‐dose methylnaltrexone compared to higher‐dose methylnaltrexone for opioid‐induced bowel dysfunction in cancer and people receiving palliative care
Table 1. Adverse events reported 2% of more participants in the trial of naldemedine

Adverse event

Naldemedine (%)

Placebo (%)

Diarrhoea

67 (39)

14 (25)

Decreased WBC count

9 (5)

3 (5)

Abdominal pain

6 (4)

0 (0)

Vomiting

5 (3)

0 (0)

Bone marrow failure

3 (2)

2 (4)

Decreased appetite

6 (4)

1 (2)

Nasopharyngitis

4 (2)

1 (2)

Nausea

4 (2)

4 (7)

Rash

3 (2)

2 (4)

Decreased platelet count

3 (2)

0 (0)

Decreased total protein

7 (4)

1 (2)

Glucose in urine

4 (2)

1 (2)

Abnormal haematology test

2 (1)

0 (0)

Decreased RBC count

4 (2)

0 (0)

Hypertension

2 (1)

0 (0)

Increased blood alkaline phosphatase

4 (2)

1 (2)

Increased blood lactate dehydrogenase

2 (1)

1 (2)

Increased blood pressure

2 (1)

0 (0)

Increased blood urea

4 (2)

1 (2)

Increased WBC count

1 (2)

2 (4)

Protein present in urine

5 (3)

0 (0)

Upper abdominal pain

3 (2)

1 (2)

RBC: red blood cell; WBC: white blood cell.

All comparisons were not statistically significant.

Figuras y tablas -
Table 1. Adverse events reported 2% of more participants in the trial of naldemedine
Table 2. Sensitivity analyses

Methylnaltrexone vs placeboa

AEs

RR 1.07, 95% CI 0.96 to 1.19

AE of abdominal pain

RR 2.15, 95% CI 1.28 to 3.62

AE of nausea

RR 0.87, 95% CI 0.46 to 1.65

AE of vomiting

RR 0.70, 95% CI 0.33 to 1.47

aomitting trial of high risk of bias.

AE: adverse event; CI: confidence intervals; RR: risk ratio.

Figuras y tablas -
Table 2. Sensitivity analyses
Table 3. Types of adverse event: reported in more than one trial of methylnaltrexone (versus placebo)

Adverse event

RR (95% CI)

I²statistic

on heterogeneity

Abdominal pain

2.39 (1.07 to 5.34)

65%

Diarrhoea

1.02 (0.93 to 1.11)

51%

Dizziness

4.09 (0.99 to 16.83)

0%

Falls

1.02 (0.89 to 1.16)

84%

Flatulence

2.09 (1.07 to 4.08)

0%

Nausea

0.97 (0.89 to 1.06)

63%

Peripheral oedema

1.01 (0.50 to 2.03)

0%

Restlessness

0.83 (0.32 to 2.12)

0%

Somnolence

1.00 (0.93 to 1.08)

73%

Vomiting

0.99 (0.92 to 1.08)

67%

CI: confidence interval; RR: risk ratio.

Figuras y tablas -
Table 3. Types of adverse event: reported in more than one trial of methylnaltrexone (versus placebo)
Table 4. Types of adverse events: reported in only one trial of methylnaltrexone

Adverse event

Methylnaltrexone (%)

Placebo (%)

Abdominal distensiona

1 (2)

6 (8)

Abdominal tendernessa

1 (2)

4 (6)

Astheniaa

4 (6)

4 (6)

Anxietyb

5 (4.9)

0 (0)

Arthralgiab

3 (2.9)

1 (1.9)

Back painc

9 (7.8)

3 (2.9)

Confusional statec

7 (6.0)

9 (7.9)

Dehydrationa

2 (3)

4 (6)

Fatigueb

4 (3.9)

1 (1.9)

Hypotensiona

0 (0)

4 (6)

Increased body temperaturea

5 (8)

2 (3)

Lethergya

4 (6)

4 (6)

Malignant‐neoplasm progressiona

7 (11)

9 (13)

Pain exacerbationb

8 (8)

2 (4)

Rhinorrhoeab

6 (5.9)

1 (1)

Sweating increasedb

8 (7.8)

4 (7.7)

Tachycardiaa

1 (1)

4 (6)

aReported in trial by Thomas 2008.

bReported in trial by Slatkin 2009.

cReported in trial by Bull 2015.

Figuras y tablas -
Table 4. Types of adverse events: reported in only one trial of methylnaltrexone
Comparison 1. Methylnatrexone versus placebo: rescue‐free laxation:

Outcome or subgroup title

No. of studies

No. of participants

Statistical method

Effect size

1 Within 24 hours of dose Show forest plot

2

287

Risk Ratio (M‐H, Fixed, 95% CI)

2.77 [1.91, 4.04]

2 Within 4 hours after 4 of the 7 doses Show forest plot

2

305

Risk Ratio (M‐H, Fixed, 95% CI)

9.98 [4.96, 20.09]

3 Within 4 hours of first dose Show forest plot

3

517

Risk Ratio (M‐H, Fixed, 95% CI)

3.87 [2.83, 5.28]

4 Within 4 hours after 1 or 2 doses of the first 4 doses Show forest plot

2

363

Risk Ratio (M‐H, Fixed, 95% CI)

6.89 [4.46, 10.66]

5 Improvement in constipation distress at day 1 Show forest plot

2

287

Risk Ratio (M‐H, Fixed, 95% CI)

1.87 [1.34, 2.59]

6 Participant global impression of improvement in bowel status at 1 week Show forest plot

2

287

Risk Ratio (M‐H, Fixed, 95% CI)

2.32 [1.64, 3.27]

7 Clinician global impression of improvement in bowel status at 1 week Show forest plot

2

287

Risk Ratio (M‐H, Fixed, 95% CI)

2.37 [1.66, 3.38]

Figuras y tablas -
Comparison 1. Methylnatrexone versus placebo: rescue‐free laxation:
Comparison 2. Methylnaltrexone versus placebo: serious adverse event

Outcome or subgroup title

No. of studies

No. of participants

Statistical method

Effect size

1 Serious adverse event Show forest plot

2

364

Risk Ratio (M‐H, Fixed, 95% CI)

0.59 [0.38, 0.93]

Figuras y tablas -
Comparison 2. Methylnaltrexone versus placebo: serious adverse event
Comparison 3. Methylnaltrexone versus placebo: adverse event

Outcome or subgroup title

No. of studies

No. of participants

Statistical method

Effect size

1 Adverse events Show forest plot

3

518

Risk Ratio (M‐H, Random, 95% CI)

1.17 [0.94, 1.45]

2 Dropouts due to adverse event Show forest plot

2

363

Risk Ratio (M‐H, Fixed, 95% CI)

1.22 [0.54, 2.76]

Figuras y tablas -
Comparison 3. Methylnaltrexone versus placebo: adverse event
Comparison 4. Oxycodone/naloxone prolonged‐release tablets versus oxycodone prolonged‐release: adverse event

Outcome or subgroup title

No. of studies

No. of participants

Statistical method

Effect size

1 Adverse events Show forest plot

2

234

Risk Ratio (M‐H, Fixed, 95% CI)

1.08 [0.94, 1.24]

Figuras y tablas -
Comparison 4. Oxycodone/naloxone prolonged‐release tablets versus oxycodone prolonged‐release: adverse event