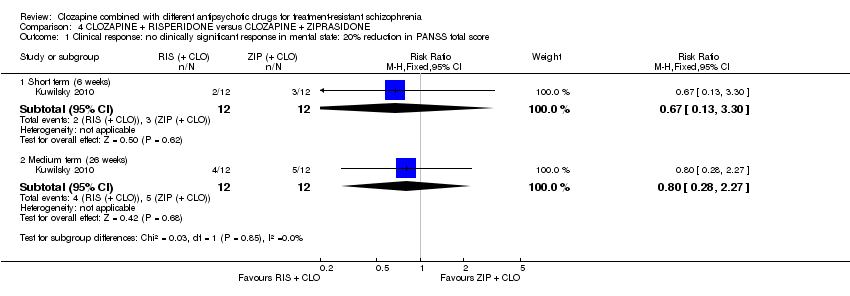
| 1 Clinical response: 1a. no clinically significant response in mental state: PANSS reduction ≥ 50% Show forest plot | 1 | | Risk Ratio (M‐H, Random, 95% CI) | Subtotals only |
|
| 1.1 Medium term (12 weeks) | 1 | 63 | Risk Ratio (M‐H, Random, 95% CI) | 0.54 [0.35, 0.81] |
| 2 Clinical response: 1b. no clinically significant response in mental state: PANSS reduction ≥ 25% Show forest plot | 1 | | Risk Ratio (M‐H, Random, 95% CI) | Subtotals only |
|
| 2.1 Medium term (12 weeks) | 1 | 63 | Risk Ratio (M‐H, Random, 95% CI) | 0.65 [0.38, 1.10] |
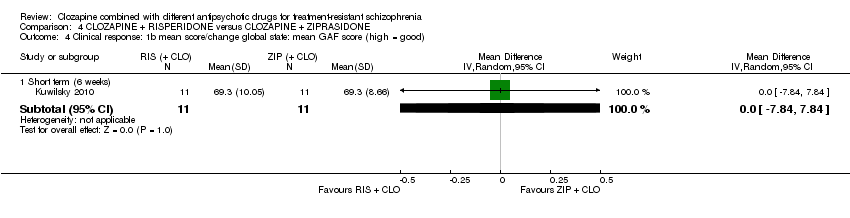
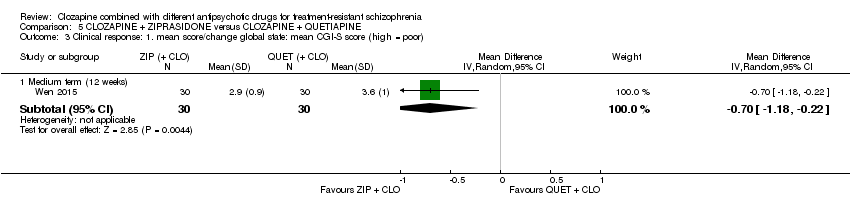
| 3 Clinical response: 1. mean score/change global state: mean CGI‐S score (high = poor) Show forest plot | 1 | | Mean Difference (IV, Random, 95% CI) | Subtotals only |
|
| 3.1 Medium term (12 weeks) | 1 | 60 | Mean Difference (IV, Random, 95% CI) | ‐0.70 [‐1.18, ‐0.22] |
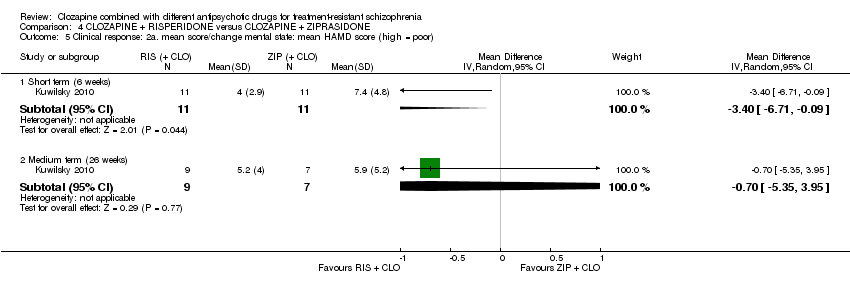
| 4 Clinical response: 2a. mean score/change mental state: mean PANSS total score (high = poor) Show forest plot | 1 | | Mean Difference (IV, Random, 95% CI) | Subtotals only |
|
| 4.1 Medium term (12 weeks) | 1 | 60 | Mean Difference (IV, Random, 95% CI) | ‐12.30 [‐22.43, ‐2.17] |
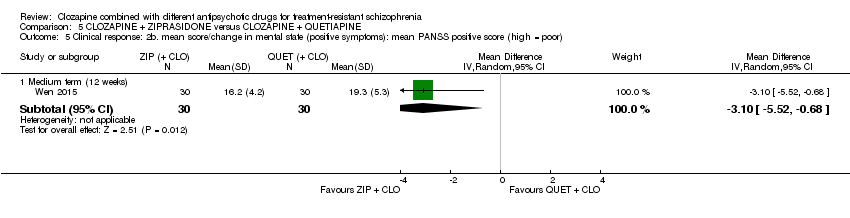
| 5 Clinical response: 2b. mean score/change in mental state (positive symptoms): mean PANSS positive score (high = poor) Show forest plot | 1 | | Mean Difference (IV, Random, 95% CI) | Subtotals only |
|
| 5.1 Medium term (12 weeks) | 1 | 60 | Mean Difference (IV, Random, 95% CI) | ‐3.10 [‐5.52, ‐0.68] |
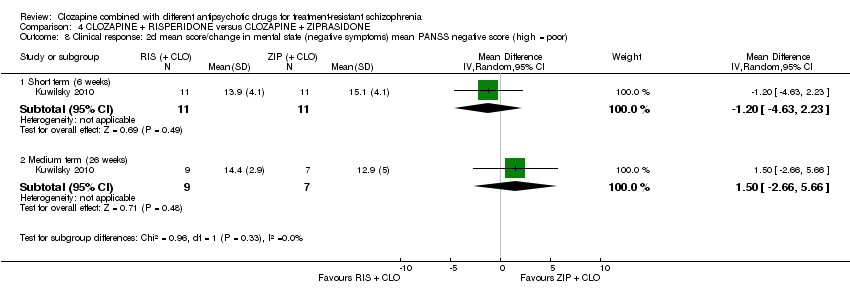
| 6 Clinical response: 2b. mean score/change in mental state (negative symptoms): mean PANSS negative score (high = poor) Show forest plot | 1 | | Mean Difference (IV, Random, 95% CI) | Subtotals only |
|
| 6.1 Medium term (12 weeks) | 1 | 60 | Mean Difference (IV, Random, 95% CI) | 0.80 [‐1.99, 3.59] |
| 7 Adverse effects: specific adverse effects: mean score/change in extrapyramidal adverse effects: reported extrapyramidal adverse effects Show forest plot | 1 | | Risk Ratio (M‐H, Random, 95% CI) | Subtotals only |
|
| 7.1 Medium term (12 weeks) | 1 | 63 | Risk Ratio (M‐H, Random, 95% CI) | 2.06 [0.41, 10.47] |
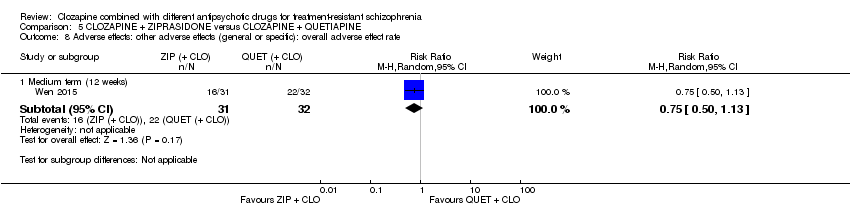
| 8 Adverse effects: other adverse effects (general or specific): overall adverse effect rate Show forest plot | 1 | | Risk Ratio (M‐H, Random, 95% CI) | Subtotals only |
|
| 8.1 Medium term (12 weeks) | 1 | 63 | Risk Ratio (M‐H, Random, 95% CI) | 0.75 [0.50, 1.13] |
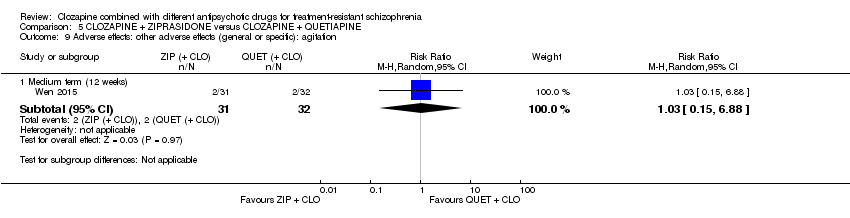
| 9 Adverse effects: other adverse effects (general or specific): agitation Show forest plot | 1 | | Risk Ratio (M‐H, Random, 95% CI) | Subtotals only |
|
| 9.1 Medium term (12 weeks) | 1 | 63 | Risk Ratio (M‐H, Random, 95% CI) | 1.03 [0.15, 6.88] |
| 10 Adverse effects: other adverse effects (general or specific): constipation Show forest plot | 1 | | Risk Ratio (M‐H, Random, 95% CI) | Subtotals only |
|
| 10.1 Medium term (12 weeks) | 1 | 63 | Risk Ratio (M‐H, Random, 95% CI) | 0.15 [0.01, 2.74] |
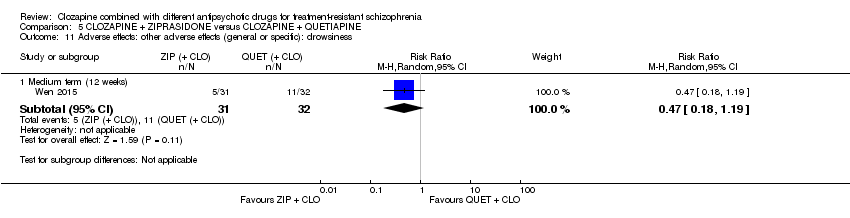
| 11 Adverse effects: other adverse effects (general or specific): drowsiness Show forest plot | 1 | | Risk Ratio (M‐H, Random, 95% CI) | Subtotals only |
|
| 11.1 Medium term (12 weeks) | 1 | 63 | Risk Ratio (M‐H, Random, 95% CI) | 0.47 [0.18, 1.19] |
| 12 Adverse effects: other adverse effects (general or specific): dry mouth Show forest plot | 1 | | Risk Ratio (M‐H, Random, 95% CI) | Subtotals only |
|
| 12.1 Medium term (12 weeks) | 1 | 63 | Risk Ratio (M‐H, Random, 95% CI) | 0.17 [0.02, 1.35] |
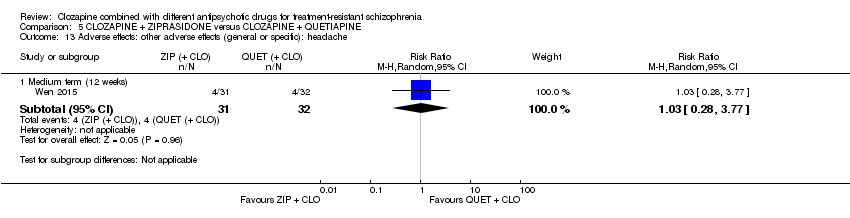
| 13 Adverse effects: other adverse effects (general or specific): headache Show forest plot | 1 | | Risk Ratio (M‐H, Random, 95% CI) | Subtotals only |
|
| 13.1 Medium term (12 weeks) | 1 | 63 | Risk Ratio (M‐H, Random, 95% CI) | 1.03 [0.28, 3.77] |
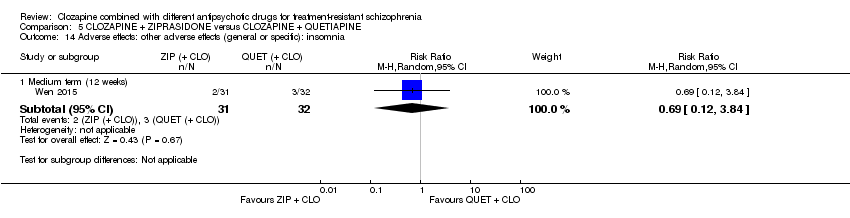
| 14 Adverse effects: other adverse effects (general or specific): insomnia Show forest plot | 1 | | Risk Ratio (M‐H, Random, 95% CI) | Subtotals only |
|
| 14.1 Medium term (12 weeks) | 1 | 63 | Risk Ratio (M‐H, Random, 95% CI) | 0.69 [0.12, 3.84] |
| 15 Adverse effects: other adverse effects (general or specific): orthostatic hypotension Show forest plot | 1 | | Risk Ratio (M‐H, Random, 95% CI) | Subtotals only |
|
| 15.1 Medium term (12 weeks) | 1 | 63 | Risk Ratio (M‐H, Random, 95% CI) | 0.21 [0.01, 4.13] |
| 16 Adverse effects: other adverse effects (general or specific): tachycardia Show forest plot | 1 | | Risk Ratio (M‐H, Random, 95% CI) | Subtotals only |
|
| 16.1 Medium term (12 weeks) | 1 | 63 | Risk Ratio (M‐H, Random, 95% CI) | 0.69 [0.12, 3.84] |
| 17 Adverse effects: other adverse effects (general or specific): vertigo Show forest plot | 1 | | Risk Ratio (M‐H, Random, 95% CI) | Subtotals only |
|
| 17.1 Medium term (12 weeks) | 1 | 63 | Risk Ratio (M‐H, Random, 95% CI) | 0.21 [0.03, 1.67] |
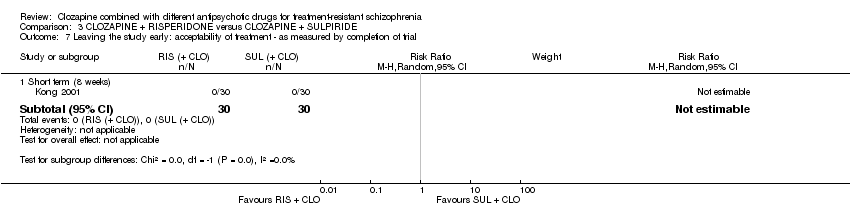
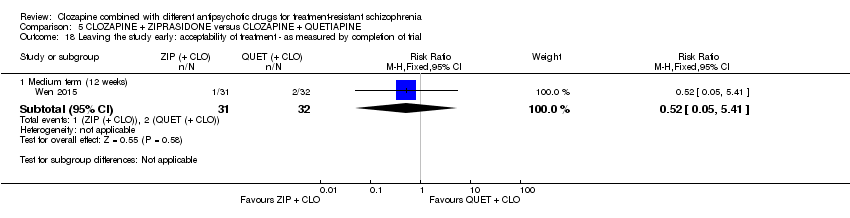
| 18 Leaving the study early: acceptability of treatment ‐ as measured by completion of trial Show forest plot | 1 | | Risk Ratio (M‐H, Fixed, 95% CI) | Subtotals only |
|
| 18.1 Medium term (12 weeks) | 1 | 63 | Risk Ratio (M‐H, Fixed, 95% CI) | 0.52 [0.05, 5.41] |