Clozapina combinada con diferentes fármacos antipsicóticos para la esquizofrenia resistente al tratamiento
Referencias
Referencias de los estudios incluidos en esta revisión
Referencias de los estudios excluidos de esta revisión
Referencias adicionales
Referencias de otras versiones publicadas de esta revisión
Characteristics of studies
Characteristics of included studies [ordered by study ID]
Ir a:
| Methods | Allocation: randomised (using centralised randomisation procedure), allocation concealed. Blinding: open‐label (participants and clinicians not blind to treatment, assessors for rating scales blind). Duration: 52 weeks. Design: multicentre, naturalistic, parallel. Setting: inpatients and outpatients. Country: Italy. | |
| Participants | Diagnosis: schizophrenia (DSM‐IV). N = 106. Age: mean 41.5 years in haloperidol group, 40.3 years in aripiprazole group. Sex: 32% female in haloperidol group, 37% female in aripiprazole group. History: partial response to clozapine after at least 6 months of treatment stable dose, mean disease duration 18 years in haloperidol group, 14 years in aripiprazole group. | |
| Interventions | 1. Clozapine + haloperidol: clozapine mean baseline dose = 413 mg/day (SD 157) and haloperidol mean baseline dose = 2.1 mg/day (SD 1.3). N = 53. 2. Clozapine + aripiprazole: clozapine mean baseline dose = 418 mg/day (SD 141) and aripiprazole mean baseline dose = 8.7 mg/day (SD 3.9). N = 53. | |
| Outcomes | Mental state: change in BPRS score from baseline. Leaving the study early. Adverse effects: change in LUNSERS score from baseline. | |
| Notes | Underpowered: target sample size 216, total recruited 106. | |
| Risk of bias | ||
| Bias | Authors' judgement | Support for judgement |
| Random sequence generation (selection bias) | Low risk | Participants randomised (quote) "using a computer generated random number program." |
| Allocation concealment (selection bias) | Low risk | Quote: "A randomisation procedure by telephone was used to keep treatment allocation concealed." |
| Blinding of participants and personnel (performance bias) | High risk | Quote: "...the patients and clinicians were not blind to pharmacological treatments." |
| Blinding of outcome assessment (detection bias) | Low risk | Quote: "...all outcome assessments based on rating scales were performed by trained assessors masked to the allocated treatment." |
| Incomplete outcome data (attrition bias) | Low risk | All randomised participants who received at least 1 dose of investigation drugs were included in the intention‐to‐treat analysis of the primary outcome (leaving the study early). Only 1 patient was not included in the analysis of the BPRS and LUNSERS continuous outcomes due to missing data. |
| Selective reporting (reporting bias) | Low risk | All outcomes expected and specified in the protocol were reported. |
| Other bias | Low risk | We found no other bias. |
| Methods | Allocation: unclear. Blindness: unclear. Duration: 8 weeks. Design: multicentre, parallel. Setting: inpatients and outpatients. | |
| Participants | Diagnosis: schizophrenia (DSM‐IV). N = 56. Age: mean 37.29 years in amisulpride group, mean "7.30" in quetiapine group, likely misreported as no significant difference between groups. Sex: 55.6% female in amisulpride group, 60.9% female in quetiapine group. History: partial response to clozapine after 12 weeks' treatment at stable dose, demonstrated by BPRS total > 45. | |
| Interventions | 1. Clozapine plus amisulpride: clozapine mean baseline dose 550 mg/day (SD 127.09) and amisulpride mean baseline dose 437.03 mg/day (SD 104.32). N = 27. 2. Clozapine plus quetiapine: clozapine mean baseline dose 536.95 mg/day (SD 125.42) and quetiapine mean baseline dose 595.65 mg/day (SD 125.21). N = 23. | |
| Outcomes | Clinical response: global state (CGI), mental state (BPRS, SAPS, SANS). Leaving the study early. Unable to use: Extrapyramidal adverse effect: UKU, SAS (no mean endpoint scores). | |
| Notes | Baseline characteristics reported after participants left early. 8‐week rating scale scores estimated from graph by two review authors (SB and SD) calculated from t score of difference in means. | |
| Risk of bias | ||
| Bias | Authors' judgement | Support for judgement |
| Random sequence generation (selection bias) | Low risk | Quote: "patients were randomly assigned...". Probably done. |
| Allocation concealment (selection bias) | Unclear risk | Allocation concealment was not mentioned. |
| Blinding of participants and personnel (performance bias) | Unclear risk | No information on blindness of participants given. |
| Blinding of outcome assessment (detection bias) | Low risk | Outcome assessor blinded. Quote: "The first author, who was the rater remained blind throughout the study." |
| Incomplete outcome data (attrition bias) | Unclear risk | 5 participants in the quetiapine group dropped out and 1 participant in the amisulpride group was missed at follow‐up at 2 weeks. These 6 participants were excluded from the analysis and from the reporting of baseline characteristics. There was no significant difference between groups, but this does not confirm the absence of bias, especially because this was a small study (N = 56). Moreover, reasons for incomplete data were not balanced between groups. |
| Selective reporting (reporting bias) | High risk | No protocol available, no SDs given for various scales (BPRS, SAPS, SANS, CGI). |
| Other bias | Unclear risk | We could not rule out the potential for other bias. |
| Methods | Allocation: unclear. Blindness: unclear. Duration: 8 weeks. Design: multicentre. Setting: inpatients. | |
| Participants | Diagnosis: schizophrenia (CCMD‐2‐R)*. N = 60. Age: < 42 years. Sex: 38 male and 22 female. History: partial response to clozapine, but criteria not clearly specified. | |
| Interventions | 1. Clozapine plus risperidone: clozapine mean dose 400 mg/day and risperidone mean dose 4 mg/day to 6 mg/day. SDs not provided. N = 30. 2. Clozapine plus sulpiride: clozapine mean dose 500 mg/day and sulpiride mean dose 800 mg/day to 1200 mg/day. SDs not provided. N = 30. | |
| Outcomes | Clinically significant response: 20% to 50% reduction PANSS total. Clinical response: mental state (PANSS total, PANSS positive, PANSS negative). Adverse effects: weight gain, hypersalivation. Leaving the study early. Unable to use: Adverse effects: TESS score. | |
| Notes | *It is unclear whether patients with schizoaffective disorder were enrolled. | |
| Risk of bias | ||
| Bias | Authors' judgement | Support for judgement |
| Random sequence generation (selection bias) | Unclear risk | Insufficient information. |
| Allocation concealment (selection bias) | Unclear risk | Insufficient information. Allocation done by hospital number so possibly not concealed. |
| Blinding of participants and personnel (performance bias) | Unclear risk | Insufficient information. |
| Blinding of outcome assessment (detection bias) | Unclear risk | Insufficient information. |
| Incomplete outcome data (attrition bias) | Low risk | No one left early. |
| Selective reporting (reporting bias) | Unclear risk | No protocol available. |
| Other bias | Unclear risk | We could not rule out the potential for other bias. |
| Methods | Allocation: randomised (by random number generator). Blindness: open label. Duration: 52 weeks. Design: multicentre, naturalistic, parallel. Setting: inpatients and outpatients. Country: Germany. | |
| Participants | Diagnosis: schizophrenia or schizoaffective disorder (DSM‐IV). N = 24. Age: mean 31.8 years in risperidone group, 37.25 years in ziprasidone group. Sex: 41.7% female in risperidone group, 41.7% female in ziprasidone group. History: partial response to clozapine after at least 3 months with stable dose as demonstrated by PANSS total score > 65. | |
| Interventions | 1. Clozapine plus risperidone: clozapine mean dose 437.5 mg/day (SD 140.4) and risperidone mean dose 3.82 mg/day (SD 1.8). N = 12. 2. Clozapine plus ziprasidone: clozapine mean dose 370.8 mg/day (SD 150.0) and ziprasidone mean dose 134 mg/day (SD 34.4). N = 12. | |
| Outcomes | Clinically significant response: 20% reduction PANSS. Clinical response global state (CGI subscales, GAF), mental state (PANSS total, PANSS positive, PANSS negative, PANS global psychopathology, SANS, HAMD). Leaving the study early. Adverse effects: EPS, CGI adverse effects. Unable to use: Global state: CGI and GAF (26 and 52 weeks) (no SDs reported). Adverse effects: HAS (data from figure not extractable). | |
| Notes | Dichotomous outcomes available from text. Baseline rating scores provided in table with SDs. 6‐week, 26‐week, and 52‐week scores and SDs estimated from graphs by 1 review author (SB). Baseline and 6‐week CGI and GAF score provided in table with SDs. No SDs for 26‐week or 52‐week scores. | |
| Risk of bias | ||
| Bias | Authors' judgement | Support for judgement |
| Random sequence generation (selection bias) | Low risk | Quote: "...the patients were randomized...using a random number generator." |
| Allocation concealment (selection bias) | Unclear risk | Allocation concealment not mentioned. |
| Blinding of participants and personnel (performance bias) | High risk | Quote: "open label"; "antipsychotics were applied in an open manner." |
| Blinding of outcome assessment (detection bias) | High risk | No mention of blinded assessors. |
| Incomplete outcome data (attrition bias) | High risk | > 50% of participants had dropped out by 52 weeks and there was no intention‐to‐treat analysis. |
| Selective reporting (reporting bias) | High risk | The study protocol was available but not all of the study's prespecified (primary and secondary) outcomes that were of interest in the review were reported in the prespecified way. There were no SDs reported for some outcomes. |
| Other bias | Unclear risk | We could not rule out the potential for other bias. |
| Methods | Allocation: randomised (no detailed information). Blindness: single blind. Duration: 12 weeks. Design: multicentre, parallel. Setting: inpatients and outpatients. Country: China. | |
| Participants | Diagnosis: schizophrenia (DSM‐IV). N = 63. Age: mean age 37.1 years. Sex: 43% female. History: treatment with clozapine for > 12 weeks at a dose > 400 mg with no improvement observed, PANSS score ≥ 80 and CGI‐S ≥ 4. | |
| Interventions | 1. Clozapine plus ziprasidone: clozapine mean baseline dose = 479 mg/day (SD 56.5), ziprasidone was titrated from 80 mg/day up to 120 mg/day to 160 mg/day, 1 week after ziprasidone was added, the dose of clozapine was reduced accordingly. N = 31. 2. Clozapine plus quetiapine: clozapine mean baseline dose = 481.3 mg/day (SD 51.7), quetiapine was titrated from 200 mg/day up to 400 mg/day to 750 mg/day, 1 week after quetiapine was added, the dose of clozapine was reduced accordingly. N = 32. | |
| Outcomes | Clinically significant response: > 50% reduction PANSS. Clinical response: global state (CGI‐S), mental state (PANSS total, PANSS positive, PANSS negative). Adverse effects: rate, agitation, constipation, drowsiness, dry mouth, extrapyramidal adverse effects, headache, insomnia, orthostatic hypotension, tachycardia, vertigo. Leaving the study early. | |
| Notes | Chinese language. | |
| Risk of bias | ||
| Bias | Authors' judgement | Support for judgement |
| Random sequence generation (selection bias) | Unclear risk | Randomisation was performed, no detailed information provided. |
| Allocation concealment (selection bias) | Unclear risk | No data. |
| Blinding of participants and personnel (performance bias) | Unclear risk | Described as single blind. |
| Blinding of outcome assessment (detection bias) | Low risk | The participants were evaluated by 3 doctors who did not have knowledge about the treatment allocation. |
| Incomplete outcome data (attrition bias) | Low risk | 3 participants who dropped out were excluded from the analyses of global and mental state outcomes, but included in the analyses of adverse events. Since the attrition rate was < 5%, and reasons were balanced between groups, the study was rated as low risk. |
| Selective reporting (reporting bias) | Unclear risk | No protocol available. |
| Other bias | Unclear risk | We could not rule out the potential for other bias. |
General
n: number of participants
SD: standard deviation
Diagnostic tools
CCDM‐2‐R: Chinese Classification of Mental disorders
DSM‐IV: Diagnostic and Statistical Manual of mental disorders, fourth edition
Global effects scales
CGI: Clinical Global Impression
CGI‐S: Clinical Global Impression ‐ Severity
GAF: Global assessment of functioning
Mental state scales
BPRS: Brief Psychiatric Rating Scale
HAMD: Hamilton Depression Scale
PANSS: Positive and Negative Syndrome Scale
SANS: Scale for the Assessment of Negative Symptoms
SAPS: Scale for the Assessment of Positive Symptoms
Adverse effect scales
EPS: Extrapyramidal Symptoms Scale
HAS: Hillside Akathisia Scale
LUNSERS: Liverpool University Neuroleptic Side Effect Rating Scale
SAS: Simpson‐Angus Extrapyramidal Symptoms Rating Scale
TESS: Treatment Emergent Symptom Scale
UKU: Udvalg for Kliniske Undersgelser Side Effect Rating Scale
Characteristics of excluded studies [ordered by study ID]
Ir a:
| Study | Reason for exclusion |
| Allocation: randomised. Participants: people with schizophrenia and manic psychoses. Intervention: no combination treatment ‐ levomepromazine vs clozapine. | |
| Allocation: randomised, double‐blind. Participants: people with treatment‐resistant schizophrenia. Intervention: no active comparison with combination treatment ‐ risperidone + clozapine vs placebo + clozapine. | |
| Allocation: non‐randomised (handbook written for the CUTLASS (Cost Utility of the Latest Antipsychotic Drugs in Schizophrenia Study) trial). | |
| Allocation: randomised, double‐blind. Participants: people with treatment‐resistant schizophrenia partially responsive or unresponsive to clozapine. Intervention: no active comparison with combination treatment ‐ amisulpride + clozapine vs clozapine + placebo. | |
| Allocation: randomised. Participants: people with schizophrenia but not defined as treatment resistant. | |
| Allocation: randomised. Participants: people with treatment‐resistant schizophrenia enrolled in 2 separate trials. Intervention: no combination treatment ‐ oral first‐generation antipsychotic drug vs non‐clozapine second‐generation antipsychotic drug or non‐clozapine second‐generation antipsychotic drug vs clozapine. | |
| Allocation: randomised. Participants: people with treatment‐resistant schizophrenia. Intervention: no combination treatment ‐ trimipramine vs perazine. | |
| Allocation: randomised. Participants: people with treatment‐resistant schizophrenia. Intervention: no combination treatment ‐ clozapine vs olanzapine vs risperidone vs haloperidol. | |
| Allocation: randomised. Participants: people with treatment‐resistant schizophrenia. Intervention: no combination treatment ‐ lamotrigine vs placebo. | |
| Allocation: randomised. Participants: people with treatment‐resistant schizophrenia. Intervention: no combination treatment ‐ risperidone vs clozapine. | |
| Allocation: randomised. Participants: people with treatment‐resistant schizophrenia. Intervention: no active comparison with combination treatment ‐ clozapine + aripiprazole vs clozapine + placebo. | |
| Allocation: non‐randomised (population‐based study). | |
| Allocation: randomised. Participants: people with treatment‐resistant schizophrenia. Intervention: no comparison with other clozapine combination treatment ‐ clozapine + ziprasidone vs ziprasidone + risperidone. | |
| Allocation: randomised. Participants: people with treatment‐resistant schizophrenia. Intervention: no combination treatment ‐ risperidone vs clozapine. | |
| Allocation: randomised. Participants: people with first‐episode of schizophrenia, not treatment‐resistant. | |
| Allocation: randomised. Participants: people with treatment‐resistant schizophrenia. Intervention: no active comparison to combination treatment ‐ antipsychotic + oxytocin vs antipsychotic + placebo (cross‐over design). | |
| Allocation: randomised. Participants: people with schizophrenia and suboptimal efficacy/safety on clozapine. Intervention: no comparison with combination treatment ‐ clozapine + aripiprazole vs clozapine. | |
| Allocation: randomised. Participants: people with schizophrenia and suboptimal efficacy/safety on clozapine. Intervention: no comparison with combination treatment ‐ clozapine + aripiprazole vs clozapine. | |
| Allocation: randomised. Participants: people with treatment‐resistant schizophrenia. Intervention: placebo controlled trial ‐ clozapine + risperidone vs clozapine + placebo. | |
| Allocation: randomised. Participants: people with treatment‐resistant schizophrenia. Intervention: no clozapine combination treatment ‐ haloperidol vs haloperidol + biperiden vs thioridazine vs clozapine. | |
| Allocation: randomised. Participants: people with treatment‐resistant schizophrenia. Intervention: no randomisation to combination treatments ‐ clozapine vs olanzapine with uncontrolled use of concomitant psychotropic medications in both groups. | |
| Allocation: randomised. Participants: people with schizophrenia receiving clozapine, not defined as treatment‐resistant. | |
| Allocation: randomised. Participants: people with treatment‐resistant schizophrenia. Intervention: placebo controlled trial ‐ CX516 + clozapine vs placebo. | |
| Allocation: randomised. Participants: people with treatment‐resistant schizophrenia. Intervention: no active comparison with combination treatment ‐ clozapine + pimozide vs clozapine + placebo. | |
| Allocation: randomised. Participants: people with treatment‐resistant schizophrenia. Intervention: no comparison with clozapine combination treatment ‐ amisulpride + quetiapine vs clozapine. | |
| Allocation: randomised. Participants: people with treatment‐resistant schizophrenia. Intervention: no active comparison with combination treatment ‐ clozapine + topiramate vs clozapine + placebo. | |
| Allocation: randomised. Participants: people with treatment‐resistant schizophrenia. Intervention: no active comparison with combination treatment ‐ clozapine + rosiglitazone vs clozapine + placebo. | |
| Allocation: randomised. Participants: people with treatment‐resistant schizophrenia. Intervention: no active comparison with combination treatment ‐ clozapine + risperidone vs clozapine + placebo. | |
| Allocation: randomised. Participants: people with treatment‐resistant schizophrenia. Intervention: no active comparison with combination treatment ‐ clozapine + risperidone vs clozapine + placebo. | |
| Allocation: randomised. Participants: people with treatment‐resistant schizophrenia. Intervention: no combination treatment ‐ non‐responders to haloperidol assigned to clozapine vs chlorpromazine. | |
| Allocation: randomised. Participants: people with treatment‐resistant schizophrenia. Intervention: no combination treatment ‐ chlorpromazine vs clozapine. | |
| Allocation: randomised. Participants: people with treatment‐resistant schizophrenia. Intervention: no active comparison with combination treatment ‐ clozapine + risperidone vs clozapine + placebo. | |
| Allocation: non‐randomised (quasi‐experimental). | |
| Allocation: randomised. Participants: people with schizophrenia but not defined as treatment resistant. | |
| Allocation: randomised. Participants: people with treatment‐resistant schizophrenia. Intervention: no combination treatment ‐ loxapine vs clozapine. | |
| Allocation: randomised. Participants: people with treatment‐resistant schizophrenia. Intervention: no comparison with combination treatment ‐ clozapine + fluphenazine decanoate vs clozapine. | |
| Allocation: randomised, double‐blind. Participants: people with treatment‐resistant schizophrenia. Intervention: no comparison with combination treatment ‐ aripiprazole + clozapine vs clozapine. | |
| Allocation: randomised. Participants: people with treatment‐resistant schizophrenia. Intervention: no combination treatment ‐ haloperidol vs clozapine. | |
| Allocation: randomised. Participants: people with treatment‐resistant schizophrenia. Intervention: no combination treatment ‐ risperidone vs clozapine. | |
| Allocation: randomised. Participants: people with treatment‐resistant schizophrenia. Intervention: no comparison with active combination treatment ‐ clozapine + aripiprazole vs clozapine + placebo. | |
| Allocation: randomised. Participants: people with treatment‐resistant schizophrenia. Intervention: no combination treatment ‐ clozapine 100 mg vs clozapine 300 mg vs clozapine 600 mg. | |
| Allocation: randomised. Participants: people with treatment‐resistant schizophrenia. Intervention: no combination treatment ‐ N‐desmethylclozapine vs placebo. | |
| Allocation: randomised, double‐blind. Participants: people with treatment‐resistant schizophrenia. Intervention: no combination treatment ‐ ziprasidone vs clozapine. | |
| Allocation: randomised. Participants: people with treatment‐resistant schizophrenia. Intervention: no drug combination treatment ‐ antipsychotic vs antipsychotic + psychosocial intervention. | |
| Allocation: randomised, double‐blind. Participants: people with treatment‐resistant schizophrenia partially responsive or unresponsive to clozapine. Intervention: no comparison with drug combination treatment ‐ haloperidol + clozapine vs electroconvulsive therapy + clozapine. | |
| Allocation: randomised. Participants: people with acute exacerbation of schizophrenia. | |
| Allocation: randomised. Participants: people with schizophrenia but not defined as treatment‐resistant. | |
| Allocation: randomised. Participants: people with treatment‐resistant schizophrenia. Intervention: no active comparison with combination treatment ‐ clozapine + glycine vs clozapine + placebo. | |
| Allocation: randomised. Participants: people with treatment‐resistant schizophrenia. Intervention: no combination treatment ‐ chlorpromazine vs clozapine. | |
| Allocation: non‐randomised (review). | |
| Allocation: randomised. Participants: people with treatment‐resistant schizophrenia. Intervention: no active comparison with combination treatment ‐ clozapine + tetrabenazine vs clozapine + placebo. | |
| Allocation: randomised. Participants: people with treatment‐resistant schizophrenia. Intervention: no combination treatment ‐ aripiprazole vs another antipsychotic medication. | |
| Allocation: randomised. Participants: people with treatment‐resistant schizophrenia. Intervention: no combination treatment ‐ aripiprazole vs another antipsychotic medication. | |
| Allocation: randomised. Participants: people with schizophrenia and depression. | |
| Allocation: randomised. Participants: people with schizophrenia but not defined as treatment‐resistant. | |
| Allocation: randomised. Participants: people with schizophrenia but not defined as treatment‐resistant. | |
| Allocation: randomised. Participants: people with treatment‐resistant schizophrenia. Intervention: no active comparison with combination treatment ‐ clozapine + sulpiride vs clozapine + placebo. | |
| Allocation: randomised. Participants: people with schizophrenia but not defined as treatment‐resistant. | |
| Allocation: randomised. Participants: people with schizophrenia but not defined as treatment‐resistant. | |
| Allocation: randomised. Participants: people with schizophrenia but not defined as treatment‐resistant. | |
| Allocation: randomised. Participants: people with treatment‐resistant schizophrenia. Intervention: no combination treatment ‐ clozapine vs olanzapine vs risperidone vs haloperidol. | |
| Allocation: randomised. Participants: people with treatment‐resistant schizophrenia. Intervention: no combination treatment ‐ olanzapine vs clozapine. | |
| Allocation: randomised. Participants: people with treatment‐resistant schizophrenia. Intervention: no combination treatment ‐ risperidone vs clozapine. | |
| Allocation: non‐randomised (review). | |
| Allocation: randomised. Participants: people with treatment‐resistant schizophrenia. Intervention: no comparison with combination treatment ‐ clozapine + risperidone vs clozapine. | |
| Allocation: randomised. Participants: people with schizophrenia but not defined as treatment‐resistant. | |
| Allocation: randomised. Participants: people with treatment‐resistant schizophrenia. Intervention: no active comparison with combination treatment ‐ clozapine + risperidone vs clozapine + placebo. | |
| Allocation: randomised. Participants: people with schizophrenia but not defined as treatment‐resistant. | |
| Allocation: randomised. Participants: people with negative symptoms of schizophrenia. Intervention: no combination treatment ‐ clozapine + paroxetine vs clozapine. | |
| Allocation: randomised. Participants: people with treatment‐resistant schizophrenia. Intervention: no active comparison with combination treatment ‐ clozapine + paroxetine vs clozapine + placebo. | |
| Allocation: randomised. Participants: people with no use of antipsychotic medication 2 weeks prior to hospitalisation ‐ not taking clozapine. | |
| Allocation: randomised. Participants: people with treatment‐resistant schizophrenia. Intervention: no combination treatment ‐ quetiapine vs clozapine. | |
| Allocation: randomised. Participants: people with schizophrenia but not defined as treatment‐resistant. | |
| Allocation: randomised. Participants: people with treatment‐resistant schizophrenia. Intervention: no active comparison with combination treatment ‐ clozapine + pipotiazine palmitate vs clozapine + placebo. |
Data and analyses
| Outcome or subgroup title | No. of studies | No. of participants | Statistical method | Effect size |
| 1 Clinical response: mean score/change in mental state: mean change in BPRS score from baseline (high = good) Show forest plot | 1 | Mean Difference (IV, Random, 95% CI) | Subtotals only | |
| Analysis 1.1  Comparison 1 CLOZAPINE + ARIPIPRAZOLE versus CLOZAPINE + HALOPERIDOL, Outcome 1 Clinical response: mean score/change in mental state: mean change in BPRS score from baseline (high = good). | ||||
| 1.1 Medium term (12 weeks) | 1 | 105 | Mean Difference (IV, Random, 95% CI) | ‐1.40 [‐5.59, 2.79] |
| 1.2 Medium term (24 weeks) | 1 | 105 | Mean Difference (IV, Random, 95% CI) | ‐0.70 [‐4.81, 3.41] |
| 1.3 Long term (52 weeks) | 1 | 105 | Mean Difference (IV, Random, 95% CI) | 0.90 [‐4.38, 6.18] |
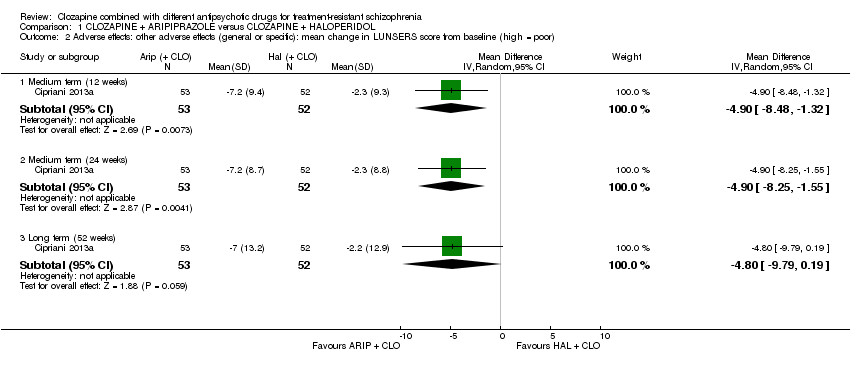
| 2 Adverse effects: other adverse effects (general or specific): mean change in LUNSERS score from baseline (high = poor) Show forest plot | 1 | Mean Difference (IV, Random, 95% CI) | Subtotals only | |
| Analysis 1.2  Comparison 1 CLOZAPINE + ARIPIPRAZOLE versus CLOZAPINE + HALOPERIDOL, Outcome 2 Adverse effects: other adverse effects (general or specific): mean change in LUNSERS score from baseline (high = poor). | ||||
| 2.1 Medium term (12 weeks) | 1 | 105 | Mean Difference (IV, Random, 95% CI) | ‐4.9 [‐8.48, ‐1.32] |
| 2.2 Medium term (24 weeks) | 1 | 105 | Mean Difference (IV, Random, 95% CI) | ‐4.9 [‐8.25, ‐1.55] |
| 2.3 Long term (52 weeks) | 1 | 105 | Mean Difference (IV, Random, 95% CI) | ‐4.8 [‐9.79, 0.19] |
| 3 Leaving the study early: acceptability of treatment ‐ as measured by completion of trial Show forest plot | 1 | Risk Ratio (M‐H, Random, 95% CI) | Subtotals only | |
| Analysis 1.3 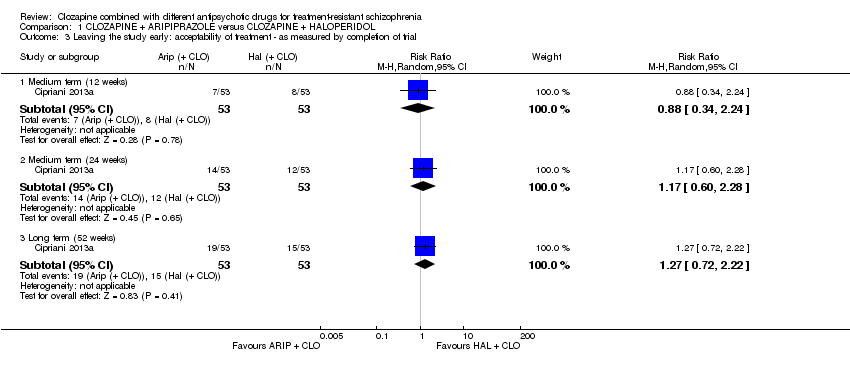 Comparison 1 CLOZAPINE + ARIPIPRAZOLE versus CLOZAPINE + HALOPERIDOL, Outcome 3 Leaving the study early: acceptability of treatment ‐ as measured by completion of trial. | ||||
| 3.1 Medium term (12 weeks) | 1 | 106 | Risk Ratio (M‐H, Random, 95% CI) | 0.88 [0.34, 2.24] |
| 3.2 Medium term (24 weeks) | 1 | 106 | Risk Ratio (M‐H, Random, 95% CI) | 1.17 [0.60, 2.28] |
| 3.3 Long term (52 weeks) | 1 | 106 | Risk Ratio (M‐H, Random, 95% CI) | 1.27 [0.72, 2.22] |
| Outcome or subgroup title | No. of studies | No. of participants | Statistical method | Effect size |
| 1 Clinical response: 1 mean score/change in global state: mean CGI score (high = poor) Show forest plot | 1 | Mean Difference (IV, Random, 95% CI) | Subtotals only | |
| Analysis 2.1  Comparison 2 CLOZAPINE + AMISULPRIDE versus CLOZAPINE + QUETIAPINE, Outcome 1 Clinical response: 1 mean score/change in global state: mean CGI score (high = poor). | ||||
| 1.1 Short term (8 weeks) | 1 | 50 | Mean Difference (IV, Random, 95% CI) | ‐0.90 [‐1.38, ‐0.42] |
| 2 Clinical response: 2a mean score/change in mental state: mean BPRS score (high = poor) Show forest plot | 1 | Mean Difference (IV, Random, 95% CI) | Subtotals only | |
| Analysis 2.2 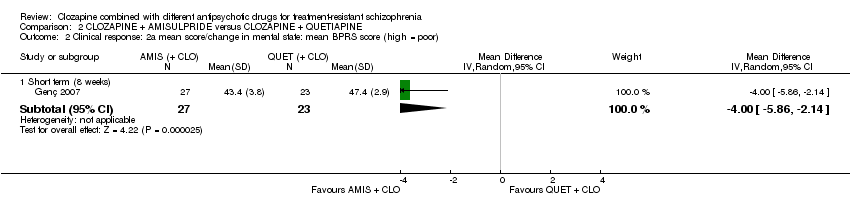 Comparison 2 CLOZAPINE + AMISULPRIDE versus CLOZAPINE + QUETIAPINE, Outcome 2 Clinical response: 2a mean score/change in mental state: mean BPRS score (high = poor). | ||||
| 2.1 Short term (8 weeks) | 1 | 50 | Mean Difference (IV, Random, 95% CI) | ‐4.0 [‐5.86, ‐2.14] |
| 3 Clinical response: 2b mean score/change in mental state: mean SAPS score (high = poor) Show forest plot | 1 | Mean Difference (IV, Random, 95% CI) | Subtotals only | |
| Analysis 2.3 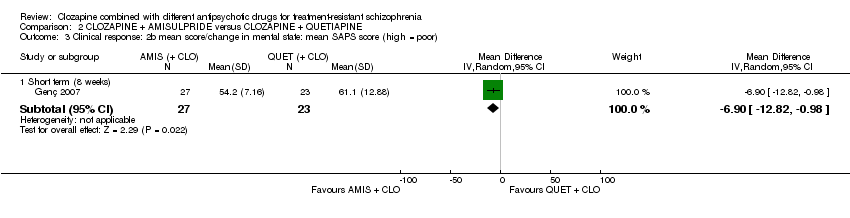 Comparison 2 CLOZAPINE + AMISULPRIDE versus CLOZAPINE + QUETIAPINE, Outcome 3 Clinical response: 2b mean score/change in mental state: mean SAPS score (high = poor). | ||||
| 3.1 Short term (8 weeks) | 1 | 50 | Mean Difference (IV, Random, 95% CI) | ‐6.90 [‐12.82, ‐0.98] |
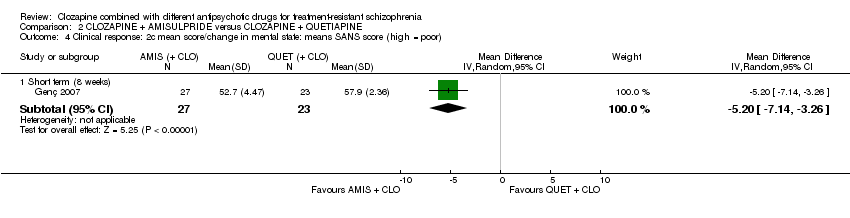
| 4 Clinical response: 2c mean score/change in mental state: means SANS score (high = poor) Show forest plot | 1 | Mean Difference (IV, Random, 95% CI) | Subtotals only | |
| Analysis 2.4  Comparison 2 CLOZAPINE + AMISULPRIDE versus CLOZAPINE + QUETIAPINE, Outcome 4 Clinical response: 2c mean score/change in mental state: means SANS score (high = poor). | ||||
| 4.1 Short term (8 weeks) | 1 | 50 | Mean Difference (IV, Random, 95% CI) | ‐5.20 [‐7.14, ‐3.26] |
| 5 Leaving the study early: acceptability of treatment ‐ as measured by completion of trial Show forest plot | 1 | 56 | Risk Ratio (M‐H, Fixed, 95% CI) | 0.2 [0.02, 1.60] |
| Analysis 2.5 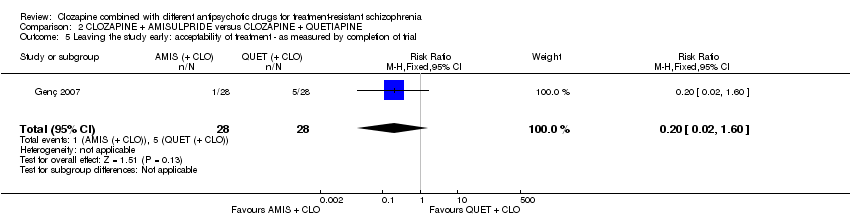 Comparison 2 CLOZAPINE + AMISULPRIDE versus CLOZAPINE + QUETIAPINE, Outcome 5 Leaving the study early: acceptability of treatment ‐ as measured by completion of trial. | ||||
| Outcome or subgroup title | No. of studies | No. of participants | Statistical method | Effect size |
| 1 Clinical response: no clinically significant response in mental state: 20% to 50% reduction in PANSS total score Show forest plot | 1 | Risk Ratio (M‐H, Random, 95% CI) | Subtotals only | |
| Analysis 3.1  Comparison 3 CLOZAPINE + RISPERIDONE versus CLOZAPINE + SULPIRIDE, Outcome 1 Clinical response: no clinically significant response in mental state: 20% to 50% reduction in PANSS total score. | ||||
| 1.1 Short term (8 weeks) | 1 | 60 | Risk Ratio (M‐H, Random, 95% CI) | 0.82 [0.40, 1.68] |
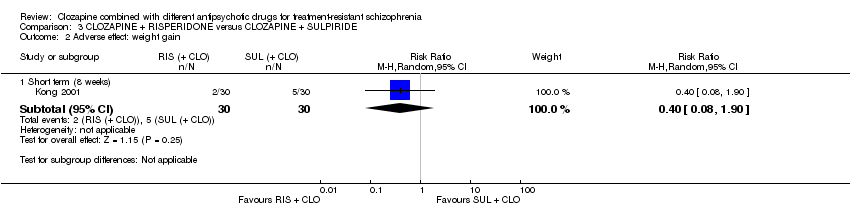
| 2 Adverse effect: weight gain Show forest plot | 1 | Risk Ratio (M‐H, Random, 95% CI) | Subtotals only | |
| Analysis 3.2  Comparison 3 CLOZAPINE + RISPERIDONE versus CLOZAPINE + SULPIRIDE, Outcome 2 Adverse effect: weight gain. | ||||
| 2.1 Short term (8 weeks) | 1 | 60 | Risk Ratio (M‐H, Random, 95% CI) | 0.4 [0.08, 1.90] |
| 3 Clinical response: 2a mean score/change in mental state: mean PANSS total score at endpoint (high = poor) Show forest plot | 1 | Mean Difference (IV, Random, 95% CI) | Subtotals only | |
| Analysis 3.3 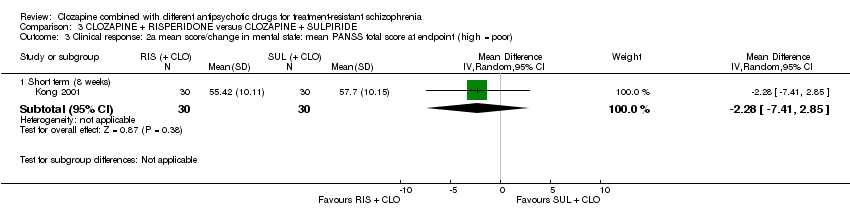 Comparison 3 CLOZAPINE + RISPERIDONE versus CLOZAPINE + SULPIRIDE, Outcome 3 Clinical response: 2a mean score/change in mental state: mean PANSS total score at endpoint (high = poor). | ||||
| 3.1 Short term (8 weeks) | 1 | 60 | Mean Difference (IV, Random, 95% CI) | ‐2.28 [‐7.41, 2.85] |
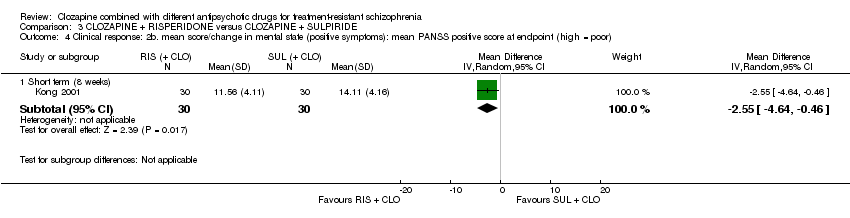
| 4 Clinical response: 2b. mean score/change in mental state (positive symptoms): mean PANSS positive score at endpoint (high = poor) Show forest plot | 1 | Mean Difference (IV, Random, 95% CI) | Subtotals only | |
| Analysis 3.4  Comparison 3 CLOZAPINE + RISPERIDONE versus CLOZAPINE + SULPIRIDE, Outcome 4 Clinical response: 2b. mean score/change in mental state (positive symptoms): mean PANSS positive score at endpoint (high = poor). | ||||
| 4.1 Short term (8 weeks) | 1 | 60 | Mean Difference (IV, Random, 95% CI) | ‐2.55 [‐4.64, ‐0.46] |
| 5 Clinical response: 2c. mean score/change in mental state (negative symptoms): mean PANSS negative score at endpoint (high = poor) Show forest plot | 1 | Mean Difference (IV, Random, 95% CI) | Subtotals only | |
| Analysis 3.5  Comparison 3 CLOZAPINE + RISPERIDONE versus CLOZAPINE + SULPIRIDE, Outcome 5 Clinical response: 2c. mean score/change in mental state (negative symptoms): mean PANSS negative score at endpoint (high = poor). | ||||
| 5.1 Short term (8 weeks) | 1 | 60 | Mean Difference (IV, Random, 95% CI) | ‐0.54 [‐3.19, 2.11] |
| 6 Adverse effects: specific adverse effects: hypersalivation Show forest plot | 1 | Risk Ratio (M‐H, Random, 95% CI) | Subtotals only | |
| Analysis 3.6 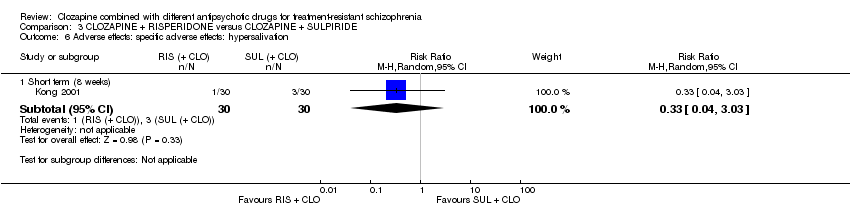 Comparison 3 CLOZAPINE + RISPERIDONE versus CLOZAPINE + SULPIRIDE, Outcome 6 Adverse effects: specific adverse effects: hypersalivation. | ||||
| 6.1 Short term (8 weeks) | 1 | 60 | Risk Ratio (M‐H, Random, 95% CI) | 0.33 [0.04, 3.03] |
| 7 Leaving the study early: acceptability of treatment ‐ as measured by completion of trial Show forest plot | 1 | Risk Ratio (M‐H, Random, 95% CI) | Subtotals only | |
| Analysis 3.7  Comparison 3 CLOZAPINE + RISPERIDONE versus CLOZAPINE + SULPIRIDE, Outcome 7 Leaving the study early: acceptability of treatment ‐ as measured by completion of trial. | ||||
| 7.1 Short term (8 weeks) | 1 | 60 | Risk Ratio (M‐H, Random, 95% CI) | 0.0 [0.0, 0.0] |
| Outcome or subgroup title | No. of studies | No. of participants | Statistical method | Effect size |
| 1 Clinical response: no clinically significant response in mental state: 20% reduction in PANSS total score Show forest plot | 1 | Risk Ratio (M‐H, Fixed, 95% CI) | Subtotals only | |
| Analysis 4.1 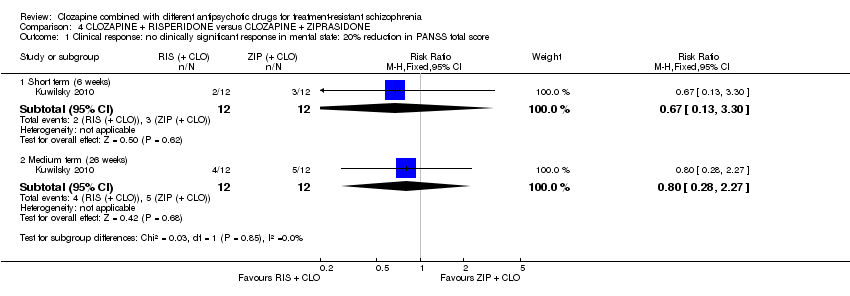 Comparison 4 CLOZAPINE + RISPERIDONE versus CLOZAPINE + ZIPRASIDONE, Outcome 1 Clinical response: no clinically significant response in mental state: 20% reduction in PANSS total score. | ||||
| 1.1 Short term (6 weeks) | 1 | 24 | Risk Ratio (M‐H, Fixed, 95% CI) | 0.67 [0.13, 3.30] |
| 1.2 Medium term (26 weeks) | 1 | 24 | Risk Ratio (M‐H, Fixed, 95% CI) | 0.8 [0.28, 2.27] |
| 2 Clinical response: no clinically significant response in mental state (positive symptoms) 20% reduction in PANSS positive subscore Show forest plot | 1 | Risk Ratio (M‐H, Random, 95% CI) | Subtotals only | |
| Analysis 4.2 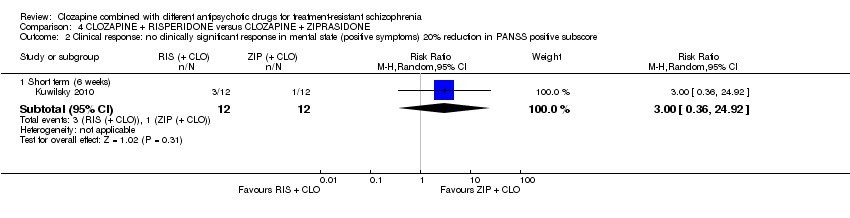 Comparison 4 CLOZAPINE + RISPERIDONE versus CLOZAPINE + ZIPRASIDONE, Outcome 2 Clinical response: no clinically significant response in mental state (positive symptoms) 20% reduction in PANSS positive subscore. | ||||
| 2.1 Short term (6 weeks) | 1 | 24 | Risk Ratio (M‐H, Random, 95% CI) | 3.0 [0.36, 24.92] |
| 3 Clinical response: 1a mean score/change global state: mean CGI subscale score (high = poor) Show forest plot | 1 | Mean Difference (IV, Random, 95% CI) | Subtotals only | |
| Analysis 4.3 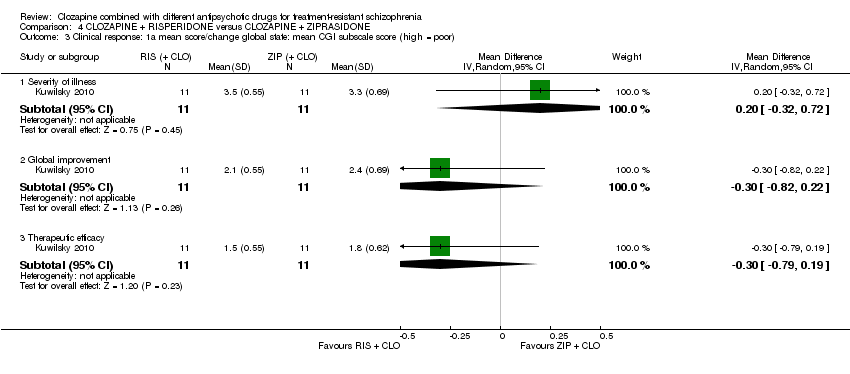 Comparison 4 CLOZAPINE + RISPERIDONE versus CLOZAPINE + ZIPRASIDONE, Outcome 3 Clinical response: 1a mean score/change global state: mean CGI subscale score (high = poor). | ||||
| 3.1 Severity of illness | 1 | 22 | Mean Difference (IV, Random, 95% CI) | 0.20 [‐0.32, 0.72] |
| 3.2 Global improvement | 1 | 22 | Mean Difference (IV, Random, 95% CI) | ‐0.30 [‐0.82, 0.22] |
| 3.3 Therapeutic efficacy | 1 | 22 | Mean Difference (IV, Random, 95% CI) | ‐0.30 [‐0.79, 0.19] |
| 4 Clinical response: 1b mean score/change global state: mean GAF score (high = good) Show forest plot | 1 | Mean Difference (IV, Random, 95% CI) | Subtotals only | |
| Analysis 4.4  Comparison 4 CLOZAPINE + RISPERIDONE versus CLOZAPINE + ZIPRASIDONE, Outcome 4 Clinical response: 1b mean score/change global state: mean GAF score (high = good). | ||||
| 4.1 Short term (6 weeks) | 1 | 22 | Mean Difference (IV, Random, 95% CI) | 0.0 [‐7.84, 7.84] |
| 5 Clinical response: 2a. mean score/change mental state: mean HAMD score (high = poor) Show forest plot | 1 | Mean Difference (IV, Random, 95% CI) | Subtotals only | |
| Analysis 4.5  Comparison 4 CLOZAPINE + RISPERIDONE versus CLOZAPINE + ZIPRASIDONE, Outcome 5 Clinical response: 2a. mean score/change mental state: mean HAMD score (high = poor). | ||||
| 5.1 Short term (6 weeks) | 1 | 22 | Mean Difference (IV, Random, 95% CI) | ‐3.40 [‐6.71, ‐0.09] |
| 5.2 Medium term (26 weeks) | 1 | 16 | Mean Difference (IV, Random, 95% CI) | ‐0.70 [‐5.35, 3.95] |
| 6 Clinical response: 2b mean score/change mental state: mean PANSS total score (high = poor) Show forest plot | 1 | Mean Difference (IV, Random, 95% CI) | Subtotals only | |
| Analysis 4.6  Comparison 4 CLOZAPINE + RISPERIDONE versus CLOZAPINE + ZIPRASIDONE, Outcome 6 Clinical response: 2b mean score/change mental state: mean PANSS total score (high = poor). | ||||
| 6.1 Short term (6 weeks) | 1 | 22 | Mean Difference (IV, Random, 95% CI) | ‐3.10 [‐11.38, 5.18] |
| 6.2 Medium term (26 weeks) | 1 | 16 | Mean Difference (IV, Random, 95% CI) | 1.0 [‐7.91, 9.91] |
| 7 Clinical response: 2c mean score/change in mental state (positive symptoms) mean PANSS positive score (high = poor) Show forest plot | 1 | Mean Difference (IV, Random, 95% CI) | Subtotals only | |
| Analysis 4.7 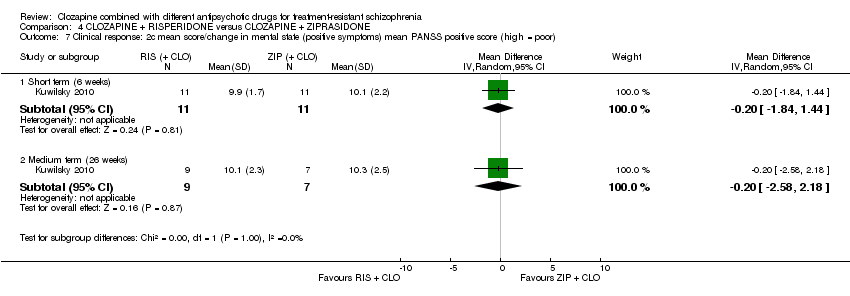 Comparison 4 CLOZAPINE + RISPERIDONE versus CLOZAPINE + ZIPRASIDONE, Outcome 7 Clinical response: 2c mean score/change in mental state (positive symptoms) mean PANSS positive score (high = poor). | ||||
| 7.1 Short term (6 weeks) | 1 | 22 | Mean Difference (IV, Random, 95% CI) | ‐0.20 [‐1.84, 1.44] |
| 7.2 Medium term (26 weeks) | 1 | 16 | Mean Difference (IV, Random, 95% CI) | ‐0.20 [‐2.58, 2.18] |
| 8 Clinical response: 2d mean score/change in mental state (negative symptoms) mean PANSS negative score (high = poor) Show forest plot | 1 | Mean Difference (IV, Random, 95% CI) | Subtotals only | |
| Analysis 4.8 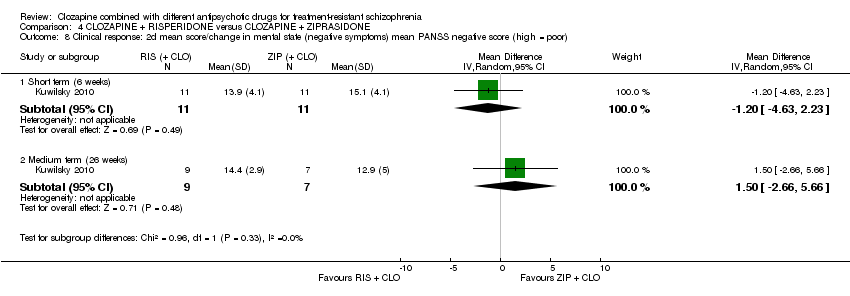 Comparison 4 CLOZAPINE + RISPERIDONE versus CLOZAPINE + ZIPRASIDONE, Outcome 8 Clinical response: 2d mean score/change in mental state (negative symptoms) mean PANSS negative score (high = poor). | ||||
| 8.1 Short term (6 weeks) | 1 | 22 | Mean Difference (IV, Random, 95% CI) | ‐1.20 [‐4.63, 2.23] |
| 8.2 Medium term (26 weeks) | 1 | 16 | Mean Difference (IV, Random, 95% CI) | 1.5 [‐2.66, 5.66] |
| 9 Clinical response: 2e mean score/change in mental state (negative symptoms) mean SANS score (high = poor) Show forest plot | 1 | Mean Difference (IV, Random, 95% CI) | Subtotals only | |
| Analysis 4.9  Comparison 4 CLOZAPINE + RISPERIDONE versus CLOZAPINE + ZIPRASIDONE, Outcome 9 Clinical response: 2e mean score/change in mental state (negative symptoms) mean SANS score (high = poor). | ||||
| 9.1 Short term (6 weeks) | 1 | 22 | Mean Difference (IV, Random, 95% CI) | ‐4.0 [‐17.55, 9.55] |
| 9.2 Medium term (26 weeks) | 1 | 16 | Mean Difference (IV, Random, 95% CI) | 1.80 [‐14.31, 17.91] |
| 10 Clinical response: 2f mean score/change in global state: mean PANSS global psychopathology score (high = poor) Show forest plot | 1 | Mean Difference (IV, Random, 95% CI) | Subtotals only | |
| Analysis 4.10  Comparison 4 CLOZAPINE + RISPERIDONE versus CLOZAPINE + ZIPRASIDONE, Outcome 10 Clinical response: 2f mean score/change in global state: mean PANSS global psychopathology score (high = poor). | ||||
| 10.1 Short term (6 weeks) | 1 | 22 | Mean Difference (IV, Random, 95% CI) | ‐1.60 [‐6.60, 3.40] |
| 10.2 Medium term (26 weeks) | 1 | 16 | Mean Difference (IV, Random, 95% CI) | 0.0 [‐5.83, 5.83] |
| 11 Adverse effects: specific adverse effects: mean score/change in extrapyramidal adverse effects: mean EPS score (high = poor) Show forest plot | 1 | Mean Difference (IV, Random, 95% CI) | Subtotals only | |
| Analysis 4.11 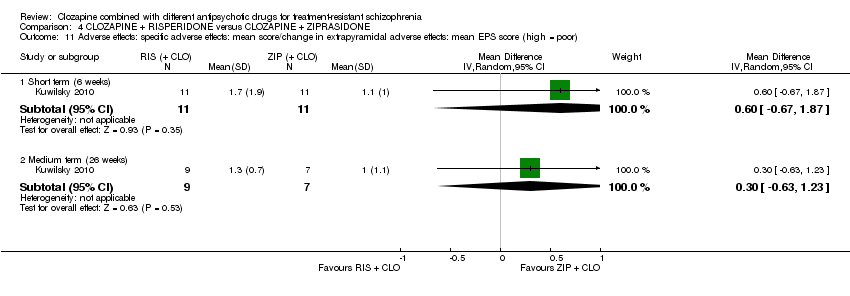 Comparison 4 CLOZAPINE + RISPERIDONE versus CLOZAPINE + ZIPRASIDONE, Outcome 11 Adverse effects: specific adverse effects: mean score/change in extrapyramidal adverse effects: mean EPS score (high = poor). | ||||
| 11.1 Short term (6 weeks) | 1 | 22 | Mean Difference (IV, Random, 95% CI) | 0.60 [‐0.67, 1.87] |
| 11.2 Medium term (26 weeks) | 1 | 16 | Mean Difference (IV, Random, 95% CI) | 0.30 [‐0.63, 1.23] |
| 12 Adverse effects: other adverse effects (general or specific): mean CGI adverse effect scores (high = poor) Show forest plot | 1 | Mean Difference (IV, Random, 95% CI) | Subtotals only | |
| Analysis 4.12  Comparison 4 CLOZAPINE + RISPERIDONE versus CLOZAPINE + ZIPRASIDONE, Outcome 12 Adverse effects: other adverse effects (general or specific): mean CGI adverse effect scores (high = poor). | ||||
| 12.1 Short term (6 weeks) | 1 | 22 | Mean Difference (IV, Random, 95% CI) | ‐0.10 [‐0.53, 0.33] |
| 13 Leaving the study early: acceptability of treatment ‐ as measured by completion of trial Show forest plot | 1 | Risk Ratio (M‐H, Random, 95% CI) | Subtotals only | |
| Analysis 4.13 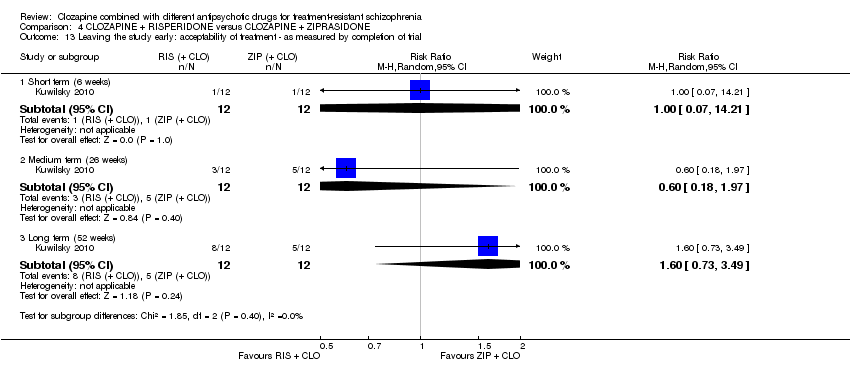 Comparison 4 CLOZAPINE + RISPERIDONE versus CLOZAPINE + ZIPRASIDONE, Outcome 13 Leaving the study early: acceptability of treatment ‐ as measured by completion of trial. | ||||
| 13.1 Short term (6 weeks) | 1 | 24 | Risk Ratio (M‐H, Random, 95% CI) | 1.0 [0.07, 14.21] |
| 13.2 Medium term (26 weeks) | 1 | 24 | Risk Ratio (M‐H, Random, 95% CI) | 0.6 [0.18, 1.97] |
| 13.3 Long term (52 weeks) | 1 | 24 | Risk Ratio (M‐H, Random, 95% CI) | 1.6 [0.73, 3.49] |
| Outcome or subgroup title | No. of studies | No. of participants | Statistical method | Effect size |
| 1 Clinical response: 1a. no clinically significant response in mental state: PANSS reduction ≥ 50% Show forest plot | 1 | Risk Ratio (M‐H, Random, 95% CI) | Subtotals only | |
| Analysis 5.1 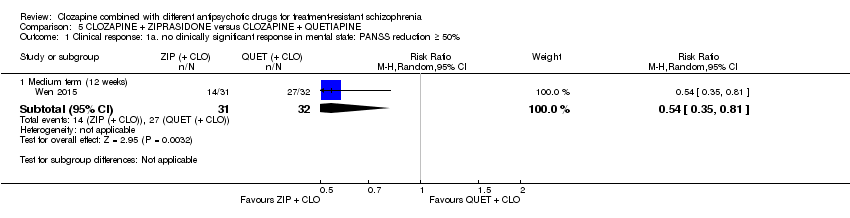 Comparison 5 CLOZAPINE + ZIPRASIDONE versus CLOZAPINE + QUETIAPINE, Outcome 1 Clinical response: 1a. no clinically significant response in mental state: PANSS reduction ≥ 50%. | ||||
| 1.1 Medium term (12 weeks) | 1 | 63 | Risk Ratio (M‐H, Random, 95% CI) | 0.54 [0.35, 0.81] |
| 2 Clinical response: 1b. no clinically significant response in mental state: PANSS reduction ≥ 25% Show forest plot | 1 | Risk Ratio (M‐H, Random, 95% CI) | Subtotals only | |
| Analysis 5.2 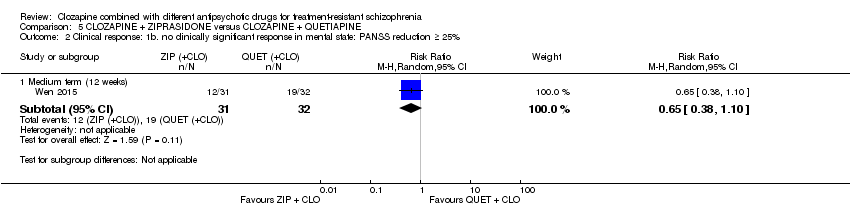 Comparison 5 CLOZAPINE + ZIPRASIDONE versus CLOZAPINE + QUETIAPINE, Outcome 2 Clinical response: 1b. no clinically significant response in mental state: PANSS reduction ≥ 25%. | ||||
| 2.1 Medium term (12 weeks) | 1 | 63 | Risk Ratio (M‐H, Random, 95% CI) | 0.65 [0.38, 1.10] |
| 3 Clinical response: 1. mean score/change global state: mean CGI‐S score (high = poor) Show forest plot | 1 | Mean Difference (IV, Random, 95% CI) | Subtotals only | |
| Analysis 5.3  Comparison 5 CLOZAPINE + ZIPRASIDONE versus CLOZAPINE + QUETIAPINE, Outcome 3 Clinical response: 1. mean score/change global state: mean CGI‐S score (high = poor). | ||||
| 3.1 Medium term (12 weeks) | 1 | 60 | Mean Difference (IV, Random, 95% CI) | ‐0.70 [‐1.18, ‐0.22] |
| 4 Clinical response: 2a. mean score/change mental state: mean PANSS total score (high = poor) Show forest plot | 1 | Mean Difference (IV, Random, 95% CI) | Subtotals only | |
| Analysis 5.4  Comparison 5 CLOZAPINE + ZIPRASIDONE versus CLOZAPINE + QUETIAPINE, Outcome 4 Clinical response: 2a. mean score/change mental state: mean PANSS total score (high = poor). | ||||
| 4.1 Medium term (12 weeks) | 1 | 60 | Mean Difference (IV, Random, 95% CI) | ‐12.30 [‐22.43, ‐2.17] |
| 5 Clinical response: 2b. mean score/change in mental state (positive symptoms): mean PANSS positive score (high = poor) Show forest plot | 1 | Mean Difference (IV, Random, 95% CI) | Subtotals only | |
| Analysis 5.5  Comparison 5 CLOZAPINE + ZIPRASIDONE versus CLOZAPINE + QUETIAPINE, Outcome 5 Clinical response: 2b. mean score/change in mental state (positive symptoms): mean PANSS positive score (high = poor). | ||||
| 5.1 Medium term (12 weeks) | 1 | 60 | Mean Difference (IV, Random, 95% CI) | ‐3.10 [‐5.52, ‐0.68] |
| 6 Clinical response: 2b. mean score/change in mental state (negative symptoms): mean PANSS negative score (high = poor) Show forest plot | 1 | Mean Difference (IV, Random, 95% CI) | Subtotals only | |
| Analysis 5.6 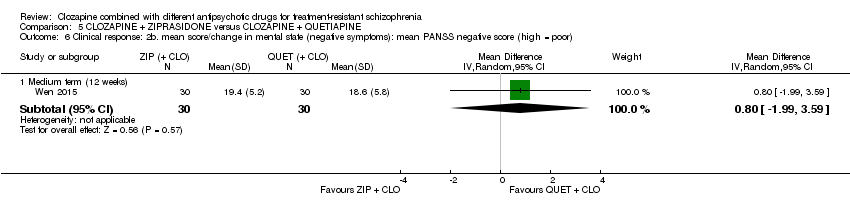 Comparison 5 CLOZAPINE + ZIPRASIDONE versus CLOZAPINE + QUETIAPINE, Outcome 6 Clinical response: 2b. mean score/change in mental state (negative symptoms): mean PANSS negative score (high = poor). | ||||
| 6.1 Medium term (12 weeks) | 1 | 60 | Mean Difference (IV, Random, 95% CI) | 0.80 [‐1.99, 3.59] |
| 7 Adverse effects: specific adverse effects: mean score/change in extrapyramidal adverse effects: reported extrapyramidal adverse effects Show forest plot | 1 | Risk Ratio (M‐H, Random, 95% CI) | Subtotals only | |
| Analysis 5.7  Comparison 5 CLOZAPINE + ZIPRASIDONE versus CLOZAPINE + QUETIAPINE, Outcome 7 Adverse effects: specific adverse effects: mean score/change in extrapyramidal adverse effects: reported extrapyramidal adverse effects. | ||||
| 7.1 Medium term (12 weeks) | 1 | 63 | Risk Ratio (M‐H, Random, 95% CI) | 2.06 [0.41, 10.47] |
| 8 Adverse effects: other adverse effects (general or specific): overall adverse effect rate Show forest plot | 1 | Risk Ratio (M‐H, Random, 95% CI) | Subtotals only | |
| Analysis 5.8 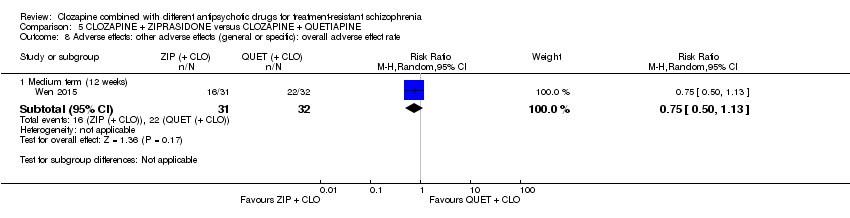 Comparison 5 CLOZAPINE + ZIPRASIDONE versus CLOZAPINE + QUETIAPINE, Outcome 8 Adverse effects: other adverse effects (general or specific): overall adverse effect rate. | ||||
| 8.1 Medium term (12 weeks) | 1 | 63 | Risk Ratio (M‐H, Random, 95% CI) | 0.75 [0.50, 1.13] |
| 9 Adverse effects: other adverse effects (general or specific): agitation Show forest plot | 1 | Risk Ratio (M‐H, Random, 95% CI) | Subtotals only | |
| Analysis 5.9  Comparison 5 CLOZAPINE + ZIPRASIDONE versus CLOZAPINE + QUETIAPINE, Outcome 9 Adverse effects: other adverse effects (general or specific): agitation. | ||||
| 9.1 Medium term (12 weeks) | 1 | 63 | Risk Ratio (M‐H, Random, 95% CI) | 1.03 [0.15, 6.88] |
| 10 Adverse effects: other adverse effects (general or specific): constipation Show forest plot | 1 | Risk Ratio (M‐H, Random, 95% CI) | Subtotals only | |
| Analysis 5.10  Comparison 5 CLOZAPINE + ZIPRASIDONE versus CLOZAPINE + QUETIAPINE, Outcome 10 Adverse effects: other adverse effects (general or specific): constipation. | ||||
| 10.1 Medium term (12 weeks) | 1 | 63 | Risk Ratio (M‐H, Random, 95% CI) | 0.15 [0.01, 2.74] |
| 11 Adverse effects: other adverse effects (general or specific): drowsiness Show forest plot | 1 | Risk Ratio (M‐H, Random, 95% CI) | Subtotals only | |
| Analysis 5.11  Comparison 5 CLOZAPINE + ZIPRASIDONE versus CLOZAPINE + QUETIAPINE, Outcome 11 Adverse effects: other adverse effects (general or specific): drowsiness. | ||||
| 11.1 Medium term (12 weeks) | 1 | 63 | Risk Ratio (M‐H, Random, 95% CI) | 0.47 [0.18, 1.19] |
| 12 Adverse effects: other adverse effects (general or specific): dry mouth Show forest plot | 1 | Risk Ratio (M‐H, Random, 95% CI) | Subtotals only | |
| Analysis 5.12 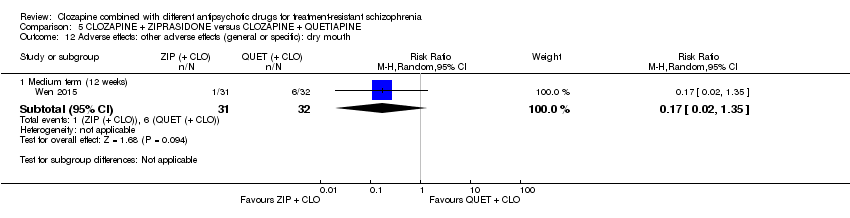 Comparison 5 CLOZAPINE + ZIPRASIDONE versus CLOZAPINE + QUETIAPINE, Outcome 12 Adverse effects: other adverse effects (general or specific): dry mouth. | ||||
| 12.1 Medium term (12 weeks) | 1 | 63 | Risk Ratio (M‐H, Random, 95% CI) | 0.17 [0.02, 1.35] |
| 13 Adverse effects: other adverse effects (general or specific): headache Show forest plot | 1 | Risk Ratio (M‐H, Random, 95% CI) | Subtotals only | |
| Analysis 5.13  Comparison 5 CLOZAPINE + ZIPRASIDONE versus CLOZAPINE + QUETIAPINE, Outcome 13 Adverse effects: other adverse effects (general or specific): headache. | ||||
| 13.1 Medium term (12 weeks) | 1 | 63 | Risk Ratio (M‐H, Random, 95% CI) | 1.03 [0.28, 3.77] |
| 14 Adverse effects: other adverse effects (general or specific): insomnia Show forest plot | 1 | Risk Ratio (M‐H, Random, 95% CI) | Subtotals only | |
| Analysis 5.14  Comparison 5 CLOZAPINE + ZIPRASIDONE versus CLOZAPINE + QUETIAPINE, Outcome 14 Adverse effects: other adverse effects (general or specific): insomnia. | ||||
| 14.1 Medium term (12 weeks) | 1 | 63 | Risk Ratio (M‐H, Random, 95% CI) | 0.69 [0.12, 3.84] |
| 15 Adverse effects: other adverse effects (general or specific): orthostatic hypotension Show forest plot | 1 | Risk Ratio (M‐H, Random, 95% CI) | Subtotals only | |
| Analysis 5.15 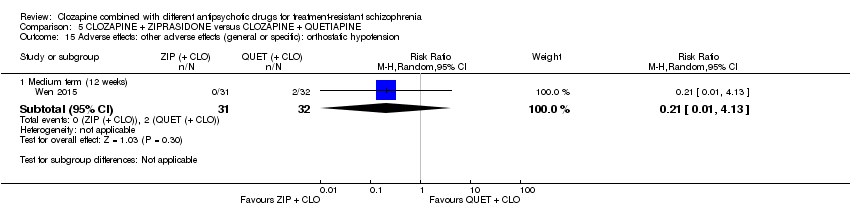 Comparison 5 CLOZAPINE + ZIPRASIDONE versus CLOZAPINE + QUETIAPINE, Outcome 15 Adverse effects: other adverse effects (general or specific): orthostatic hypotension. | ||||
| 15.1 Medium term (12 weeks) | 1 | 63 | Risk Ratio (M‐H, Random, 95% CI) | 0.21 [0.01, 4.13] |
| 16 Adverse effects: other adverse effects (general or specific): tachycardia Show forest plot | 1 | Risk Ratio (M‐H, Random, 95% CI) | Subtotals only | |
| Analysis 5.16  Comparison 5 CLOZAPINE + ZIPRASIDONE versus CLOZAPINE + QUETIAPINE, Outcome 16 Adverse effects: other adverse effects (general or specific): tachycardia. | ||||
| 16.1 Medium term (12 weeks) | 1 | 63 | Risk Ratio (M‐H, Random, 95% CI) | 0.69 [0.12, 3.84] |
| 17 Adverse effects: other adverse effects (general or specific): vertigo Show forest plot | 1 | Risk Ratio (M‐H, Random, 95% CI) | Subtotals only | |
| Analysis 5.17  Comparison 5 CLOZAPINE + ZIPRASIDONE versus CLOZAPINE + QUETIAPINE, Outcome 17 Adverse effects: other adverse effects (general or specific): vertigo. | ||||
| 17.1 Medium term (12 weeks) | 1 | 63 | Risk Ratio (M‐H, Random, 95% CI) | 0.21 [0.03, 1.67] |
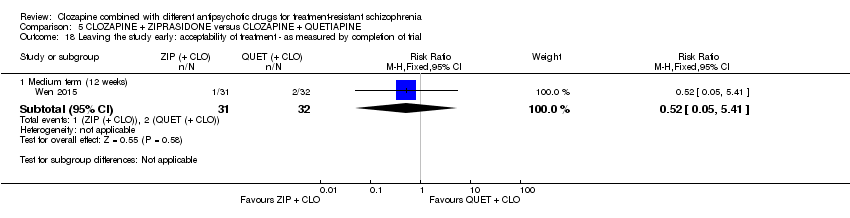
| 18 Leaving the study early: acceptability of treatment ‐ as measured by completion of trial Show forest plot | 1 | Risk Ratio (M‐H, Fixed, 95% CI) | Subtotals only | |
| Analysis 5.18  Comparison 5 CLOZAPINE + ZIPRASIDONE versus CLOZAPINE + QUETIAPINE, Outcome 18 Leaving the study early: acceptability of treatment ‐ as measured by completion of trial. | ||||
| 18.1 Medium term (12 weeks) | 1 | 63 | Risk Ratio (M‐H, Fixed, 95% CI) | 0.52 [0.05, 5.41] |
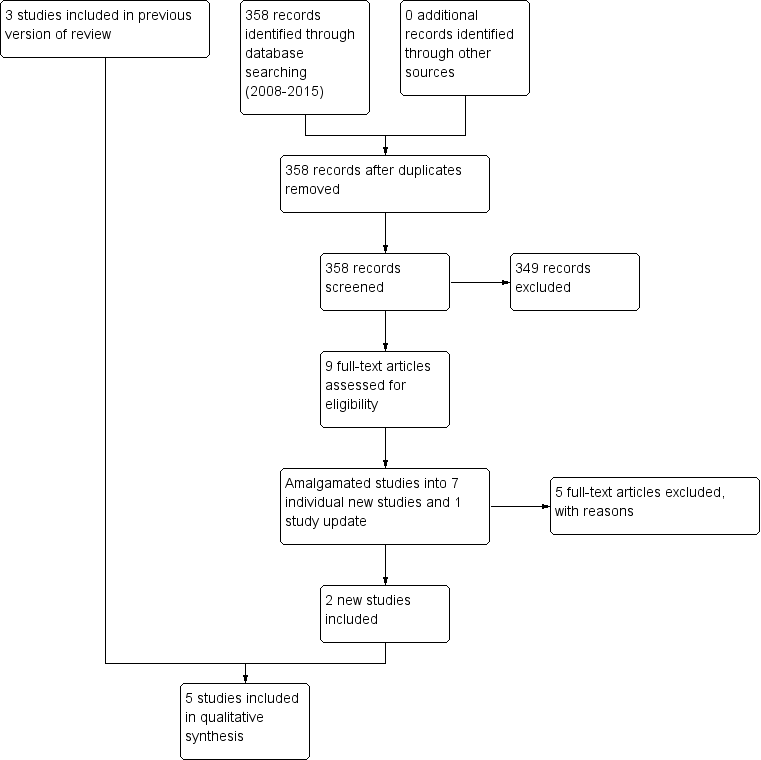
Study flow diagram (2015 update).

Methodological quality graph: review authors' judgements about each methodological quality item presented as percentages across all included studies.

Methodological quality summary: review authors' judgements about each methodological quality item for each included study.

Comparison 1 CLOZAPINE + ARIPIPRAZOLE versus CLOZAPINE + HALOPERIDOL, Outcome 1 Clinical response: mean score/change in mental state: mean change in BPRS score from baseline (high = good).
Comparison 1 CLOZAPINE + ARIPIPRAZOLE versus CLOZAPINE + HALOPERIDOL, Outcome 2 Adverse effects: other adverse effects (general or specific): mean change in LUNSERS score from baseline (high = poor).

Comparison 1 CLOZAPINE + ARIPIPRAZOLE versus CLOZAPINE + HALOPERIDOL, Outcome 3 Leaving the study early: acceptability of treatment ‐ as measured by completion of trial.

Comparison 2 CLOZAPINE + AMISULPRIDE versus CLOZAPINE + QUETIAPINE, Outcome 1 Clinical response: 1 mean score/change in global state: mean CGI score (high = poor).

Comparison 2 CLOZAPINE + AMISULPRIDE versus CLOZAPINE + QUETIAPINE, Outcome 2 Clinical response: 2a mean score/change in mental state: mean BPRS score (high = poor).

Comparison 2 CLOZAPINE + AMISULPRIDE versus CLOZAPINE + QUETIAPINE, Outcome 3 Clinical response: 2b mean score/change in mental state: mean SAPS score (high = poor).
Comparison 2 CLOZAPINE + AMISULPRIDE versus CLOZAPINE + QUETIAPINE, Outcome 4 Clinical response: 2c mean score/change in mental state: means SANS score (high = poor).

Comparison 2 CLOZAPINE + AMISULPRIDE versus CLOZAPINE + QUETIAPINE, Outcome 5 Leaving the study early: acceptability of treatment ‐ as measured by completion of trial.

Comparison 3 CLOZAPINE + RISPERIDONE versus CLOZAPINE + SULPIRIDE, Outcome 1 Clinical response: no clinically significant response in mental state: 20% to 50% reduction in PANSS total score.
Comparison 3 CLOZAPINE + RISPERIDONE versus CLOZAPINE + SULPIRIDE, Outcome 2 Adverse effect: weight gain.

Comparison 3 CLOZAPINE + RISPERIDONE versus CLOZAPINE + SULPIRIDE, Outcome 3 Clinical response: 2a mean score/change in mental state: mean PANSS total score at endpoint (high = poor).
Comparison 3 CLOZAPINE + RISPERIDONE versus CLOZAPINE + SULPIRIDE, Outcome 4 Clinical response: 2b. mean score/change in mental state (positive symptoms): mean PANSS positive score at endpoint (high = poor).
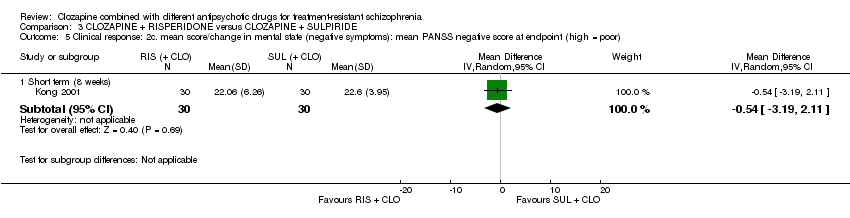
Comparison 3 CLOZAPINE + RISPERIDONE versus CLOZAPINE + SULPIRIDE, Outcome 5 Clinical response: 2c. mean score/change in mental state (negative symptoms): mean PANSS negative score at endpoint (high = poor).

Comparison 3 CLOZAPINE + RISPERIDONE versus CLOZAPINE + SULPIRIDE, Outcome 6 Adverse effects: specific adverse effects: hypersalivation.
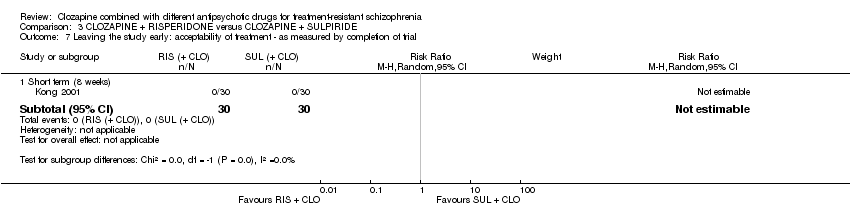
Comparison 3 CLOZAPINE + RISPERIDONE versus CLOZAPINE + SULPIRIDE, Outcome 7 Leaving the study early: acceptability of treatment ‐ as measured by completion of trial.

Comparison 4 CLOZAPINE + RISPERIDONE versus CLOZAPINE + ZIPRASIDONE, Outcome 1 Clinical response: no clinically significant response in mental state: 20% reduction in PANSS total score.

Comparison 4 CLOZAPINE + RISPERIDONE versus CLOZAPINE + ZIPRASIDONE, Outcome 2 Clinical response: no clinically significant response in mental state (positive symptoms) 20% reduction in PANSS positive subscore.

Comparison 4 CLOZAPINE + RISPERIDONE versus CLOZAPINE + ZIPRASIDONE, Outcome 3 Clinical response: 1a mean score/change global state: mean CGI subscale score (high = poor).
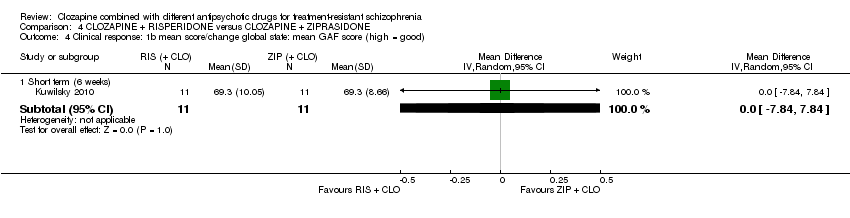
Comparison 4 CLOZAPINE + RISPERIDONE versus CLOZAPINE + ZIPRASIDONE, Outcome 4 Clinical response: 1b mean score/change global state: mean GAF score (high = good).
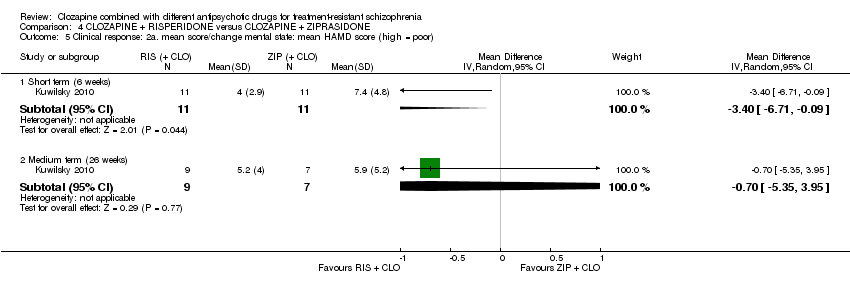
Comparison 4 CLOZAPINE + RISPERIDONE versus CLOZAPINE + ZIPRASIDONE, Outcome 5 Clinical response: 2a. mean score/change mental state: mean HAMD score (high = poor).

Comparison 4 CLOZAPINE + RISPERIDONE versus CLOZAPINE + ZIPRASIDONE, Outcome 6 Clinical response: 2b mean score/change mental state: mean PANSS total score (high = poor).

Comparison 4 CLOZAPINE + RISPERIDONE versus CLOZAPINE + ZIPRASIDONE, Outcome 7 Clinical response: 2c mean score/change in mental state (positive symptoms) mean PANSS positive score (high = poor).

Comparison 4 CLOZAPINE + RISPERIDONE versus CLOZAPINE + ZIPRASIDONE, Outcome 8 Clinical response: 2d mean score/change in mental state (negative symptoms) mean PANSS negative score (high = poor).
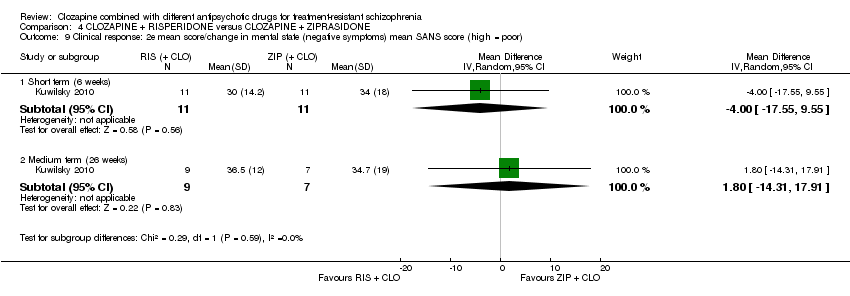
Comparison 4 CLOZAPINE + RISPERIDONE versus CLOZAPINE + ZIPRASIDONE, Outcome 9 Clinical response: 2e mean score/change in mental state (negative symptoms) mean SANS score (high = poor).
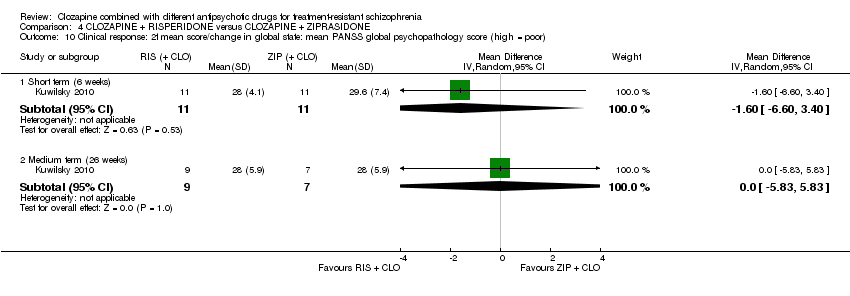
Comparison 4 CLOZAPINE + RISPERIDONE versus CLOZAPINE + ZIPRASIDONE, Outcome 10 Clinical response: 2f mean score/change in global state: mean PANSS global psychopathology score (high = poor).

Comparison 4 CLOZAPINE + RISPERIDONE versus CLOZAPINE + ZIPRASIDONE, Outcome 11 Adverse effects: specific adverse effects: mean score/change in extrapyramidal adverse effects: mean EPS score (high = poor).

Comparison 4 CLOZAPINE + RISPERIDONE versus CLOZAPINE + ZIPRASIDONE, Outcome 12 Adverse effects: other adverse effects (general or specific): mean CGI adverse effect scores (high = poor).

Comparison 4 CLOZAPINE + RISPERIDONE versus CLOZAPINE + ZIPRASIDONE, Outcome 13 Leaving the study early: acceptability of treatment ‐ as measured by completion of trial.

Comparison 5 CLOZAPINE + ZIPRASIDONE versus CLOZAPINE + QUETIAPINE, Outcome 1 Clinical response: 1a. no clinically significant response in mental state: PANSS reduction ≥ 50%.

Comparison 5 CLOZAPINE + ZIPRASIDONE versus CLOZAPINE + QUETIAPINE, Outcome 2 Clinical response: 1b. no clinically significant response in mental state: PANSS reduction ≥ 25%.
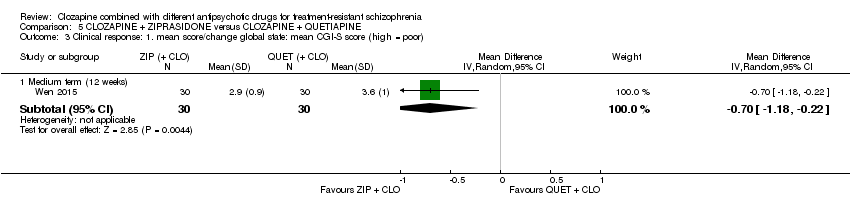
Comparison 5 CLOZAPINE + ZIPRASIDONE versus CLOZAPINE + QUETIAPINE, Outcome 3 Clinical response: 1. mean score/change global state: mean CGI‐S score (high = poor).

Comparison 5 CLOZAPINE + ZIPRASIDONE versus CLOZAPINE + QUETIAPINE, Outcome 4 Clinical response: 2a. mean score/change mental state: mean PANSS total score (high = poor).
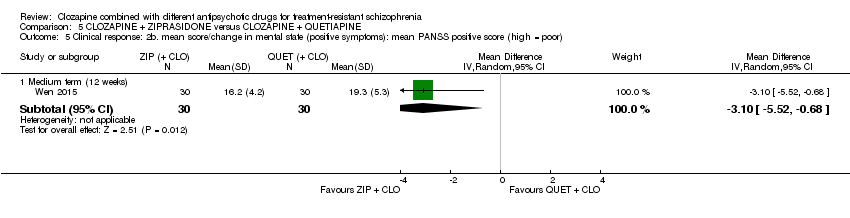
Comparison 5 CLOZAPINE + ZIPRASIDONE versus CLOZAPINE + QUETIAPINE, Outcome 5 Clinical response: 2b. mean score/change in mental state (positive symptoms): mean PANSS positive score (high = poor).

Comparison 5 CLOZAPINE + ZIPRASIDONE versus CLOZAPINE + QUETIAPINE, Outcome 6 Clinical response: 2b. mean score/change in mental state (negative symptoms): mean PANSS negative score (high = poor).

Comparison 5 CLOZAPINE + ZIPRASIDONE versus CLOZAPINE + QUETIAPINE, Outcome 7 Adverse effects: specific adverse effects: mean score/change in extrapyramidal adverse effects: reported extrapyramidal adverse effects.

Comparison 5 CLOZAPINE + ZIPRASIDONE versus CLOZAPINE + QUETIAPINE, Outcome 8 Adverse effects: other adverse effects (general or specific): overall adverse effect rate.
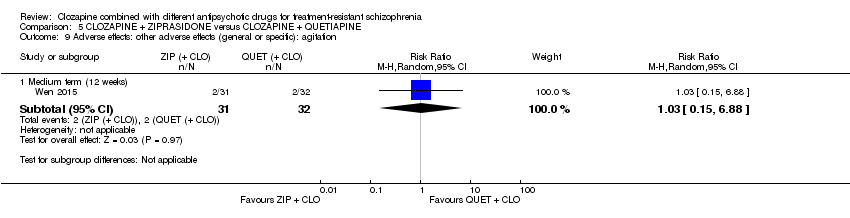
Comparison 5 CLOZAPINE + ZIPRASIDONE versus CLOZAPINE + QUETIAPINE, Outcome 9 Adverse effects: other adverse effects (general or specific): agitation.

Comparison 5 CLOZAPINE + ZIPRASIDONE versus CLOZAPINE + QUETIAPINE, Outcome 10 Adverse effects: other adverse effects (general or specific): constipation.
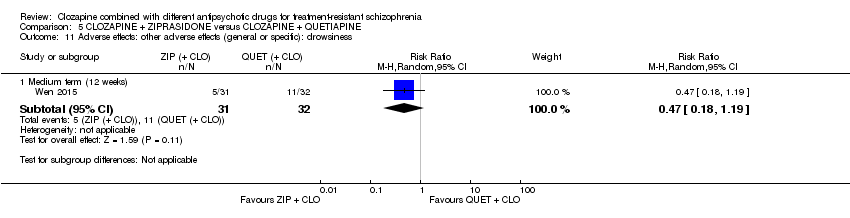
Comparison 5 CLOZAPINE + ZIPRASIDONE versus CLOZAPINE + QUETIAPINE, Outcome 11 Adverse effects: other adverse effects (general or specific): drowsiness.

Comparison 5 CLOZAPINE + ZIPRASIDONE versus CLOZAPINE + QUETIAPINE, Outcome 12 Adverse effects: other adverse effects (general or specific): dry mouth.
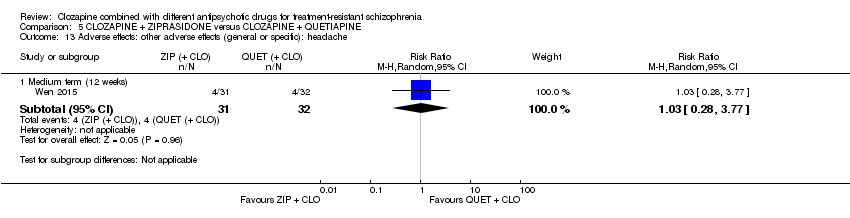
Comparison 5 CLOZAPINE + ZIPRASIDONE versus CLOZAPINE + QUETIAPINE, Outcome 13 Adverse effects: other adverse effects (general or specific): headache.
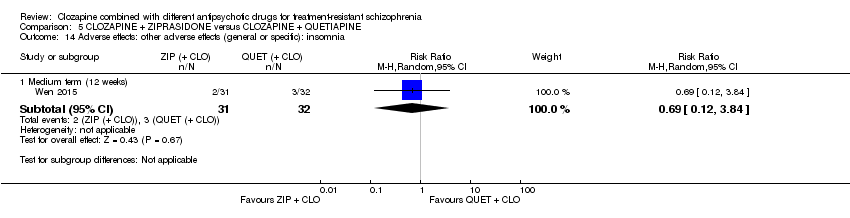
Comparison 5 CLOZAPINE + ZIPRASIDONE versus CLOZAPINE + QUETIAPINE, Outcome 14 Adverse effects: other adverse effects (general or specific): insomnia.

Comparison 5 CLOZAPINE + ZIPRASIDONE versus CLOZAPINE + QUETIAPINE, Outcome 15 Adverse effects: other adverse effects (general or specific): orthostatic hypotension.

Comparison 5 CLOZAPINE + ZIPRASIDONE versus CLOZAPINE + QUETIAPINE, Outcome 16 Adverse effects: other adverse effects (general or specific): tachycardia.

Comparison 5 CLOZAPINE + ZIPRASIDONE versus CLOZAPINE + QUETIAPINE, Outcome 17 Adverse effects: other adverse effects (general or specific): vertigo.
Comparison 5 CLOZAPINE + ZIPRASIDONE versus CLOZAPINE + QUETIAPINE, Outcome 18 Leaving the study early: acceptability of treatment ‐ as measured by completion of trial.
| Methods | Allocation: proper randomisation (e.g. by computer‐generated number sequence) and adequate allocation concealment (e.g. by central randomisation by a third party). Blinding: ideally double blind, but pragmatically blinding the participant and the outcome assessor is adequate. Setting: inpatients and outpatients. Duration: short‐term primary outcome (at 12 weeks), and then medium‐ to long‐term follow‐up (up to 52 week). |
| Participants | Diagnosis: treatment‐resistant schizophrenia, defined by persistent positive symptoms despite at least 6 months of treatment with clozapine ≥ 400 mg/day. N = 200. Sex: men and women. Age: > 18 years. |
| Interventions | 1. Clozapine plus risperidone (or paliperidone). 2. Clozapine plus aripiprazole (or amisulpride). |
| Outcomes | Measure of clinical response to include both dichotomous measures of global (e.g. CGI score) and mental state (e.g. BPRS score). Adverse effects to include weight gain, extrapyramidal symptoms, haematological problems, and hypersalivation. Acceptability assessed by leaving the study early. Service utilisation (e.g. hospital admission). Quality of life/satisfaction measure. |
| Notes | The study should be funded by an independent funding body, such as the National Institute for Health Research or Wellcome Trust. |
| BPRS: Brief Psychiatric Rating Scale; CGI: Clinical Global Impression; n: number of participants. | |
| Clozapine + aripi prazole versus clozapine + haloperidol for treatment‐resistant schizophrenia | ||||||
| Patient or population: people with treatment‐resistant schizophrenia Setting: inpatients and outpatients Intervention: aripiprazole (+ CLO) Comparison: haloperidol (+ CLO) | ||||||
| Outcomes | Anticipated absolute effects* (95% CI) | Relative effect | No of participants | Quality of the evidence | Comments | |
| Risk with haloperidol (+ CLO) | Risk with aripiprazole (+ CLO) | |||||
| Clinical response: no clinically significant response in mental state | See comment | See comment | Not estimable | ‐ | ‐ | No data reported. |
| Adverse effects: weight gain | See comment | See comment | Not estimable | ‐ | ‐ | No data reported. |
| Clinical response: mean score/change in global state | See comment | See comment | ‐ | ‐ | ‐ | No data reported. |
| Clinical response: mean score/change in mental state: change in BPRS score from baseline (high = good), Long term (12 months) | The mean score/change in mental state (change in BPRS from baseline) ‐ long term (12 months) was 0 | The mean score/change in mental state ‐ defined by change in BPRS from baseline ‐ long term (12 months) in the intervention group was 0.9 more (4.38 fewer to 6.18 more) | ‐ | 105 | ⊕⊕⊝⊝ | ‐ |
| Leaving the study early: acceptability of treatment ‐ as measured by completion of trial Long term (12 months) | Study population | RR 1.27 | 106 | ⊕⊝⊝⊝ | ‐ | |
| 283 per 1000 | 359 per 1000 | |||||
| Moderate | ||||||
| 283 per 1000 | 359 per 1000 | |||||
| Service utilisation outcomes: hospital admission or days in hospital | See comment | See comment | Not estimable | ‐ | ‐ | No data reported. |
| Quality of life/satisfaction with care for either recipients of care or carers: significant change in quality of life/satisfaction | See comment | See comment | Not estimable | ‐ | ‐ | No data reported. |
| *The risk in the intervention group (and its 95% confidence interval) is based on the assumed risk in the comparison group and the relative effect of the intervention (and its 95% CI). BPRS: Brief Psychiatric Rating Scale; CI: confidence interval; CLO: clozapine; RCT: randomised controlled trial; RR: risk ratio. | ||||||
| GRADE Working Group grades of evidence | ||||||
| 1 Risk of bias: downgraded by 1 level because high risk for performance bias (open label), but low risk for other biases (selection, detection, attrition, reporting). 2 Inconsistency and publication bias: not applicable (no meta‐analysis). 3 Indirectness: not downgraded because good applicability in terms of participants and interventions and rating scale measures participant‐important outcome (mental state). 4 Imprecision: downgraded by 1 level because underpowered to detect difference. Not downgraded by 2 levels because CI around mean difference did not include appreciable benefit and appreciable harm (total score on BPRS = 126). 5 Indirectness: downgraded by 1 level because leaving the study early a surrogate measure of acceptability of treatment. 6 Imprecision: downgraded by 2 level because underpowered to detect difference and CI around relative effect included appreciable benefit and harm (from less likely to leave study early to over two times more likely to leave study early). | ||||||
| Clozapine + amisulpride versus clozapine + quetiapine for treatment‐resistant schizophrenia | ||||||
| Patient or population: people with treatment‐resistant schizophrenia Setting: inpatients and outpatients Intervention: amisulpride (+ CLO) Comparison: quetiapine (+ CLO) | ||||||
| Outcomes | Anticipated absolute effects* (95% CI) | Relative effect | No of participants | Quality of the evidence | Comments | |
| Risk with quetiapine (+ CLO) | Risk with amisulpride (+ CLO) | |||||
| Clinical response: no clinically significant response in mental state | See comment | See comment | Not estimable | (1 RCT) | ‐ | No data reported. |
| Adverse effects: weight gain | See comment | See comment | Not estimable | (1 RCT) | ‐ | No data reported. |
| Clinical response: mean score/change in global state: mean CGI score (high = poor) Short term (8 weeks) | The mean score/change in global state (CGI) ‐ short term (8 weeks) was 0 | The mean score/change in global state (CGI) ‐ short term (8 weeks) in the intervention group was 0.9 fewer (1.38 fewer to 0.42 fewer) | ‐ | 50 | ⊕⊝⊝⊝ | ‐ |
| Clinical response: mean score/change in mental state: mean BPRS score (high = poor) Short term (8 weeks) | The mean score/change in mental state (BPRS) ‐ short term (8 weeks) was 0 | The mean score/change in mental state (BPRS) ‐ short term (8 weeks) in the intervention group was 4 fewer (5.86 fewer to 2.14 fewer) | ‐ | 50 | ⊕⊕⊝⊝ | ‐ |
| Leaving the study early: acceptability of treatment ‐ as measured by completion of trial | Study population | RR 0.20 | 56 | ⊕⊝⊝⊝ | ‐ | |
| 179 per 1000 | 36 per 1000 | |||||
| Moderate | ||||||
| 179 per 1000 | 36 per 1000 | |||||
| Service utilisation outcomes: hospital admission or days in hospital | See comment | See comment | Not estimable | (1 RCT) | ‐ | No data reported. |
| Quality of life/satisfaction with care for either recipients of care or carers: significant change in quality of life/satisfaction | See comment | See comment | Not estimable | (1 RCT) | ‐ | No data reported. |
| *The risk in the intervention group (and its 95% confidence interval) is based on the assumed risk in the comparison group and the relative effect of the intervention (and its 95% CI). BPRS: Brief Psychiatric Rating Scale; CGI: Clinical Global Impression; CI: confidence interval; CLO: clozapine; RCT: randomised controlled trial; RR: risk ratio. | ||||||
| GRADE Working Group grades of evidence | ||||||
| 1 Risk of bias: downgraded by 2 levels because high risk of reporting bias and unclear (so potentially high) risk of other biases (selection, performance, attrition). 2 Inconsistency and publication bias: not applicable (no meta‐analysis). 3 Indirectness: not downgraded because good applicability in terms of participants and interventions and rating score measures a participant‐important outcome (global state). 4 Imprecision: downgraded by 1 level because underpowered to detect difference. Not downgraded by 2 levels because CI around mean difference did not include appreciable benefit and appreciable harm (total score on CGI = 7). 5 Indirectness: not downgraded because good applicability in terms of participants and interventions and rating score measures a participant‐important outcome (mental state). 6 Imprecision: not downgraded because powered to detect difference and narrow CI. 7 Indirectness: downgraded by 1 level because leaving study early surrogate measure of participant‐important outcome (acceptability of treatment). | ||||||
| Clozapine + risperidone versus clozapine + sulpiride for treatment‐resistant schizophrenia | ||||||
| Patient or population: people with treatment‐resistant schizophrenia Setting: inpatients Intervention: risperidone (+ CLO) Comparison: sulpiride (+ CLO) | ||||||
| Outcomes | Anticipated absolute effects* (95% CI) | Relative effect | No of participants | Quality of the evidence | Comments | |
| Risk with Sulpiride (+ CLO) | Risk with Risperidone (+ CLO) | |||||
| Clinical response: no clinically significant response in mental state: 20% to 50% reduction in PANSS total score | Study population | RR 0.82 | 60 | ⊕⊝⊝⊝ | ‐ | |
| 367 per 1000 | 301 per 1000 | |||||
| Moderate | ||||||
| 367 per 1000 | 301 per 1000 | |||||
| Adverse effects: weight gain | Study population | RR 0.40 | 60 | ⊕⊝⊝⊝ | ‐ | |
| 167 per 1000 | 67 per 1000 | |||||
| Moderate | ||||||
| 167 per 1000 | 67 per 1000 | |||||
| Clinical response: mean score/change in global state | See comment | See comment | ‐ | (1 RCT) | ‐ | No data reported. |
| Clinical response: mean score/change in mental state: mean PANSS total score (high = poor) | The mean score/change in mental state (PANSS total) was 0 | The mean score/change in mental state (PANSS total) in the intervention group was 2.28 undefined fewer (7.41 fewer to 2.85 more) | ‐ | 60 | ⊕⊝⊝⊝ | ‐ |
| Leaving the study early: acceptability of treatment ‐ as measured by completion of trial | Study population | Not estimable | 60 | ⊕⊝⊝⊝ | ‐ | |
| 0 per 1000 | 0 per 1000 | |||||
| Service utilisation outcomes: hospital admission or days in hospital | See comment | See comment | Not estimable | ‐ | ‐ | No data reported. |
| Quality of life/satisfaction with care for either recipients of care or carers: significant change in quality of life/satisfaction | See comment | See comment | Not estimable | ‐ | ‐ | No data reported. |
| *The risk in the intervention group (and its 95% confidence interval) is based on the assumed risk in the comparison group and the relative effect of the intervention (and its 95% CI). CI: confidence interval; CLO: clozapine; PANSS: Positive and Negative Syndrome Scale; RCT: randomised controlled trial; RR: risk ratio. | ||||||
| GRADE Working Group grades of evidence | ||||||
| 1 Risk of bias: downgraded by 2 levels because unclear (so potentially high) risk of biases (selection, performance, detection, reporting). 2 Inconsistency and publication bias: not applicable (no meta‐analysis). 3 Indirectness: downgraded by 1 level because unclear population applicability (inclusion criteria not clearly specified). Not downgraded by 2 levels because rating scale measures participant‐important outcome (mental state). 4 Imprecision: downgraded by 2 levels because underpowered to detect difference and CI around relative effect includes appreciable benefit and harm. 5 Indirectness: downgraded by 1 level because unclear population applicability (inclusion criteria not clearly specified). Not downgraded by 2 levels because weight gain a direct measure of a participant‐important outcome. 6 Indirectness: downgraded by 1 level because unclear population applicability (inclusion criteria not clearly specified). Not downgraded by 2 levels because rating scale measures participant‐important outcome (mental state). 7 Imprecision: downgraded by 1 level because underpowered to detect difference. Not downgraded by 2 levels because CI around mean difference did not include appreciable benefit and appreciable harm (total score on PANSS = 120). 8 Indirectness: downgraded by 2 levels because unclear population applicability (inclusion criteria not clearly specified) and leaving the study early a surrogate measure of acceptability of treatment. 9 Imprecision: downgraded by 1 level because underpowered to detect difference. Not downgraded by 2 levels because no CI. | ||||||
| Clozapine + risperidone versus clozapine + ziprasidone for treatment‐resistant schizophrenia | ||||||
| Patient or population: people with treatment‐resistant schizophrenia Setting: inpatients and outpatients Intervention: risperidone (+ CLO) Comparison: ziprasidone (+ CLO) | ||||||
| Outcomes | Anticipated absolute effects* (95% CI) | Relative effect | No of participants | Quality of the evidence | Comments | |
| Risk with ziprasidone (+ CLO) | Risk with risperidone (+ CLO) | |||||
| Clinical response: no clinically significant response in mental state: 20% reduction in PANSS total score | Study population | RR 0.80 | 24 | ⊕⊝⊝⊝ | ‐ | |
| 417 per 1000 | 333 per 1000 | |||||
| Moderate | ||||||
| 417 per 1000 | 333 per 1000 | |||||
| Adverse effects: weight gain | See comment | See comment | Not estimable | ‐ | ‐ | No SDs reported. |
| Clinical response: mean score/change in global state: mean CGI‐II Global improvement score (high = poor) Short term (6 weeks) | The mean score/change in global state (CGI‐II Global improvement) ‐ short term (6 weeks) was 0 | The mean score/change in global state (CGI‐II global improvement) ‐ short term (6 weeks) in the intervention group was 0.3 fewer (0.82 fewer to 0.22 more) | ‐ | 22 | ⊕⊝⊝⊝ | ‐ |
| Clinical response: mean score/change in mental state: mean PANSS total score (high = poor) Medium term (26 weeks) | The mean score/change in mental state (PANSS total) ‐ medium term (26 weeks) was 0 | The mean score/change in mental state (PANSS total) ‐ medium term (26 weeks) in the intervention group was 1 more (7.91 fewer to 9.91 more) | ‐ | 16 | ⊕⊝⊝⊝ | ‐ |
| Leaving the study early: acceptability of treatment ‐ as measured by completion of trial Long term (52 weeks) | Study population | RR 1.60 | 24 | ⊕⊝⊝⊝ | ‐ | |
| 417 per 1000 | 667 per 1000 | |||||
| Moderate | ||||||
| 417 per 1000 | 667 per 1000 | |||||
| Service utilisation outcomes: hospital admission or days in hospital | See comment | See comment | Not estimable | ‐ | ‐ | No data reported. |
| Quality of life/satisfaction with care for either recipients of care or carers: significant change in quality of life/satisfaction | See comment | See comment | Not estimable | ‐ | ‐ | No data reported. |
| *The risk in the intervention group (and its 95% confidence interval) is based on the assumed risk in the comparison group and the relative effect of the intervention (and its 95% CI). CI: confidence interval; CLO: clozapine; PANSS: Positive and Negative Syndrome Scale; RCT: randomised controlled trial; RR: risk ratio. | ||||||
| GRADE Working Group grades of evidence | ||||||
| 1 Risk of bias: downgraded by 2 levels because high risk of performance bias, detection bias, attrition bias, and reporting bias. 2 Inconsistency and publication bias: not applicable (no meta‐analysis). 3 Indirectness: not downgraded because good applicability in terms of participants and interventions and rating score measures a participant‐important outcome (mental state). 4 Imprecision: downgraded by 2 levels because underpowered to detect difference and CI around relative effect includes appreciable benefit and harm (from less likely to over two times more likely to have no clinical response in mental state defined by PANSS 20% reduction). 5 Indirectness: not downgraded because good applicability (participants and interventions), and rating score measures a participant‐important outcome (global state). 6 Imprecision: downgraded by 1 level because underpowered to detect difference. Not downgraded by 2 levels because CI around mean difference does not include appreciable benefit and appreciable harm (total score on CGI = 7). 7 Imprecision: downgraded by 1 level because underpowered to detect difference. Not downgraded by 2 levels because CI around mean difference does not include appreciable benefit and appreciable harm (total score on PANSS = 120). 8 Indirectness: downgraded by 1 level because leaving the study early a surrogate for participant‐important outcome (acceptability of treatment). 9 Indirectness: downgraded by 2 levels because underpowered to detect difference and CI around relative effect includes appreciable benefit and harm (from less likely to over three times more likely to leave the study early). | ||||||
| Clozapine + ziprasidone versus clozapine + quetiapine for treatment‐resistant schizophrenia | ||||||
| Patient or population: people with treatment‐resistant schizophrenia Setting: inpatients and outpatients Intervention: ziprasidone (+ CLO) Comparison: quetiapine (+ CLO) | ||||||
| Outcomes | Anticipated absolute effects* (95% CI) | Relative effect | No of participants | Quality of the evidence | Comments | |
| Risk with quetiapine (+ CLO) | Risk with ziprasidone (+ CLO) | |||||
| Clinical response: no clinically significant response in mental state: ≥ 50% reduction in PANSS total score Medium term (12 weeks) | Study population | RR 0.54 | 63 | ⊕⊕⊝⊝ | ‐ | |
| 844 per 1000 | 456 per 1000 | |||||
| Moderate | ||||||
| 844 per 1000 | 456 per 1000 | |||||
| Adverse effects: weight gain | See comment | See comment | Not estimable | ‐ | ‐ | No data reported. |
| Clinical response: mean score/change in global state: mean CGI‐S score (high = poor) Medium term (12 weeks) | The mean score/change in global state (CGI‐S) ‐ medium term (12 weeks) was 0 | The mean score/change in global state (CGI‐S) ‐ medium term (12 weeks) in the intervention group was 0.7 fewer (1.18 fewer to 0.22 fewer) | ‐ | 60 | ⊕⊕⊝⊝ | ‐ |
| Clinical response: mean score/change in mental state: mean PANSS total score (high = poor) Medium term (12 weeks) | The mean score/change in mental state (PANSS total) ‐ medium term (12 weeks) was 0 | The mean score/change in mental state (PANSS total) ‐ medium term (12 weeks) in the intervention group was 12.3 fewer (22.43 fewer to 2.17 fewer) | ‐ | 60 | ⊕⊕⊝⊝ | ‐ |
| Leaving the study early: acceptability of treatment ‐ as measured by completion of trial | Study population | RR 0.52 | 63 | ⊕⊝⊝⊝ | ‐ | |
| 63 per 1000 | 33 per 1000 | |||||
| Moderate | ||||||
| 63 per 1000 | 33 per 1000 | |||||
| Service utilisation outcomes: hospital admission or days in hospital | See comment | See comment | Not estimable | ‐ | ‐ | No data reported. |
| Quality of life/satisfaction with care for either recipients of care or carers: significant change in quality of life/satisfaction | See comment | See comment | Not estimable | ‐ | ‐ | No data reported. |
| *The risk in the intervention group (and its 95% confidence interval) is based on the assumed risk in the comparison group and the relative effect of the intervention (and its 95% CI). CGI ‐S: Clinical Global Impression – Severity; CI: confidence interval; CLO: clozapine; PANSS: Positive and Negative Syndrome Scale; RCT: randomised controlled trial; RR: risk ratio; SD: standard deviation. | ||||||
| GRADE Working Group grades of evidence | ||||||
| 1 Risk of bias: downgraded by 2 levels because unclear (so potentially high) risk of biases (selection, performance, reporting). 2 Inconsistency and publication bias: not applicable (no meta‐analysis). 3 Indirectness: not downgraded because good applicability in terms of participants and interventions and rating scale measures a participant‐important outcome (mental state). 4 Imprecision: not downgraded because powered to detect difference and narrow CI. 5 Indirectness: not downgraded because good applicability (participants and interventions) and rating scale measures a participant‐important outcome (global state). 6 Indirectness: downgraded by 1 level because leaving the study early surrogate measure for participant‐important outcome (acceptability of treatment). 7 Imprecision: downgraded by 2 levels because underpowered to detect difference and CI around relative effect includes appreciable benefit and harm (from less likely to leave study early to five times more likely to leave study early). | ||||||
| Outcome or subgroup title | No. of studies | No. of participants | Statistical method | Effect size |
| 1 Clinical response: mean score/change in mental state: mean change in BPRS score from baseline (high = good) Show forest plot | 1 | Mean Difference (IV, Random, 95% CI) | Subtotals only | |
| 1.1 Medium term (12 weeks) | 1 | 105 | Mean Difference (IV, Random, 95% CI) | ‐1.40 [‐5.59, 2.79] |
| 1.2 Medium term (24 weeks) | 1 | 105 | Mean Difference (IV, Random, 95% CI) | ‐0.70 [‐4.81, 3.41] |
| 1.3 Long term (52 weeks) | 1 | 105 | Mean Difference (IV, Random, 95% CI) | 0.90 [‐4.38, 6.18] |
| 2 Adverse effects: other adverse effects (general or specific): mean change in LUNSERS score from baseline (high = poor) Show forest plot | 1 | Mean Difference (IV, Random, 95% CI) | Subtotals only | |
| 2.1 Medium term (12 weeks) | 1 | 105 | Mean Difference (IV, Random, 95% CI) | ‐4.9 [‐8.48, ‐1.32] |
| 2.2 Medium term (24 weeks) | 1 | 105 | Mean Difference (IV, Random, 95% CI) | ‐4.9 [‐8.25, ‐1.55] |
| 2.3 Long term (52 weeks) | 1 | 105 | Mean Difference (IV, Random, 95% CI) | ‐4.8 [‐9.79, 0.19] |
| 3 Leaving the study early: acceptability of treatment ‐ as measured by completion of trial Show forest plot | 1 | Risk Ratio (M‐H, Random, 95% CI) | Subtotals only | |
| 3.1 Medium term (12 weeks) | 1 | 106 | Risk Ratio (M‐H, Random, 95% CI) | 0.88 [0.34, 2.24] |
| 3.2 Medium term (24 weeks) | 1 | 106 | Risk Ratio (M‐H, Random, 95% CI) | 1.17 [0.60, 2.28] |
| 3.3 Long term (52 weeks) | 1 | 106 | Risk Ratio (M‐H, Random, 95% CI) | 1.27 [0.72, 2.22] |
| Outcome or subgroup title | No. of studies | No. of participants | Statistical method | Effect size |
| 1 Clinical response: 1 mean score/change in global state: mean CGI score (high = poor) Show forest plot | 1 | Mean Difference (IV, Random, 95% CI) | Subtotals only | |
| 1.1 Short term (8 weeks) | 1 | 50 | Mean Difference (IV, Random, 95% CI) | ‐0.90 [‐1.38, ‐0.42] |
| 2 Clinical response: 2a mean score/change in mental state: mean BPRS score (high = poor) Show forest plot | 1 | Mean Difference (IV, Random, 95% CI) | Subtotals only | |
| 2.1 Short term (8 weeks) | 1 | 50 | Mean Difference (IV, Random, 95% CI) | ‐4.0 [‐5.86, ‐2.14] |
| 3 Clinical response: 2b mean score/change in mental state: mean SAPS score (high = poor) Show forest plot | 1 | Mean Difference (IV, Random, 95% CI) | Subtotals only | |
| 3.1 Short term (8 weeks) | 1 | 50 | Mean Difference (IV, Random, 95% CI) | ‐6.90 [‐12.82, ‐0.98] |
| 4 Clinical response: 2c mean score/change in mental state: means SANS score (high = poor) Show forest plot | 1 | Mean Difference (IV, Random, 95% CI) | Subtotals only | |
| 4.1 Short term (8 weeks) | 1 | 50 | Mean Difference (IV, Random, 95% CI) | ‐5.20 [‐7.14, ‐3.26] |
| 5 Leaving the study early: acceptability of treatment ‐ as measured by completion of trial Show forest plot | 1 | 56 | Risk Ratio (M‐H, Fixed, 95% CI) | 0.2 [0.02, 1.60] |
| Outcome or subgroup title | No. of studies | No. of participants | Statistical method | Effect size |
| 1 Clinical response: no clinically significant response in mental state: 20% to 50% reduction in PANSS total score Show forest plot | 1 | Risk Ratio (M‐H, Random, 95% CI) | Subtotals only | |
| 1.1 Short term (8 weeks) | 1 | 60 | Risk Ratio (M‐H, Random, 95% CI) | 0.82 [0.40, 1.68] |
| 2 Adverse effect: weight gain Show forest plot | 1 | Risk Ratio (M‐H, Random, 95% CI) | Subtotals only | |
| 2.1 Short term (8 weeks) | 1 | 60 | Risk Ratio (M‐H, Random, 95% CI) | 0.4 [0.08, 1.90] |
| 3 Clinical response: 2a mean score/change in mental state: mean PANSS total score at endpoint (high = poor) Show forest plot | 1 | Mean Difference (IV, Random, 95% CI) | Subtotals only | |
| 3.1 Short term (8 weeks) | 1 | 60 | Mean Difference (IV, Random, 95% CI) | ‐2.28 [‐7.41, 2.85] |
| 4 Clinical response: 2b. mean score/change in mental state (positive symptoms): mean PANSS positive score at endpoint (high = poor) Show forest plot | 1 | Mean Difference (IV, Random, 95% CI) | Subtotals only | |
| 4.1 Short term (8 weeks) | 1 | 60 | Mean Difference (IV, Random, 95% CI) | ‐2.55 [‐4.64, ‐0.46] |
| 5 Clinical response: 2c. mean score/change in mental state (negative symptoms): mean PANSS negative score at endpoint (high = poor) Show forest plot | 1 | Mean Difference (IV, Random, 95% CI) | Subtotals only | |
| 5.1 Short term (8 weeks) | 1 | 60 | Mean Difference (IV, Random, 95% CI) | ‐0.54 [‐3.19, 2.11] |
| 6 Adverse effects: specific adverse effects: hypersalivation Show forest plot | 1 | Risk Ratio (M‐H, Random, 95% CI) | Subtotals only | |
| 6.1 Short term (8 weeks) | 1 | 60 | Risk Ratio (M‐H, Random, 95% CI) | 0.33 [0.04, 3.03] |
| 7 Leaving the study early: acceptability of treatment ‐ as measured by completion of trial Show forest plot | 1 | Risk Ratio (M‐H, Random, 95% CI) | Subtotals only | |
| 7.1 Short term (8 weeks) | 1 | 60 | Risk Ratio (M‐H, Random, 95% CI) | 0.0 [0.0, 0.0] |
| Outcome or subgroup title | No. of studies | No. of participants | Statistical method | Effect size |
| 1 Clinical response: no clinically significant response in mental state: 20% reduction in PANSS total score Show forest plot | 1 | Risk Ratio (M‐H, Fixed, 95% CI) | Subtotals only | |
| 1.1 Short term (6 weeks) | 1 | 24 | Risk Ratio (M‐H, Fixed, 95% CI) | 0.67 [0.13, 3.30] |
| 1.2 Medium term (26 weeks) | 1 | 24 | Risk Ratio (M‐H, Fixed, 95% CI) | 0.8 [0.28, 2.27] |
| 2 Clinical response: no clinically significant response in mental state (positive symptoms) 20% reduction in PANSS positive subscore Show forest plot | 1 | Risk Ratio (M‐H, Random, 95% CI) | Subtotals only | |
| 2.1 Short term (6 weeks) | 1 | 24 | Risk Ratio (M‐H, Random, 95% CI) | 3.0 [0.36, 24.92] |
| 3 Clinical response: 1a mean score/change global state: mean CGI subscale score (high = poor) Show forest plot | 1 | Mean Difference (IV, Random, 95% CI) | Subtotals only | |
| 3.1 Severity of illness | 1 | 22 | Mean Difference (IV, Random, 95% CI) | 0.20 [‐0.32, 0.72] |
| 3.2 Global improvement | 1 | 22 | Mean Difference (IV, Random, 95% CI) | ‐0.30 [‐0.82, 0.22] |
| 3.3 Therapeutic efficacy | 1 | 22 | Mean Difference (IV, Random, 95% CI) | ‐0.30 [‐0.79, 0.19] |
| 4 Clinical response: 1b mean score/change global state: mean GAF score (high = good) Show forest plot | 1 | Mean Difference (IV, Random, 95% CI) | Subtotals only | |
| 4.1 Short term (6 weeks) | 1 | 22 | Mean Difference (IV, Random, 95% CI) | 0.0 [‐7.84, 7.84] |
| 5 Clinical response: 2a. mean score/change mental state: mean HAMD score (high = poor) Show forest plot | 1 | Mean Difference (IV, Random, 95% CI) | Subtotals only | |
| 5.1 Short term (6 weeks) | 1 | 22 | Mean Difference (IV, Random, 95% CI) | ‐3.40 [‐6.71, ‐0.09] |
| 5.2 Medium term (26 weeks) | 1 | 16 | Mean Difference (IV, Random, 95% CI) | ‐0.70 [‐5.35, 3.95] |
| 6 Clinical response: 2b mean score/change mental state: mean PANSS total score (high = poor) Show forest plot | 1 | Mean Difference (IV, Random, 95% CI) | Subtotals only | |
| 6.1 Short term (6 weeks) | 1 | 22 | Mean Difference (IV, Random, 95% CI) | ‐3.10 [‐11.38, 5.18] |
| 6.2 Medium term (26 weeks) | 1 | 16 | Mean Difference (IV, Random, 95% CI) | 1.0 [‐7.91, 9.91] |
| 7 Clinical response: 2c mean score/change in mental state (positive symptoms) mean PANSS positive score (high = poor) Show forest plot | 1 | Mean Difference (IV, Random, 95% CI) | Subtotals only | |
| 7.1 Short term (6 weeks) | 1 | 22 | Mean Difference (IV, Random, 95% CI) | ‐0.20 [‐1.84, 1.44] |
| 7.2 Medium term (26 weeks) | 1 | 16 | Mean Difference (IV, Random, 95% CI) | ‐0.20 [‐2.58, 2.18] |
| 8 Clinical response: 2d mean score/change in mental state (negative symptoms) mean PANSS negative score (high = poor) Show forest plot | 1 | Mean Difference (IV, Random, 95% CI) | Subtotals only | |
| 8.1 Short term (6 weeks) | 1 | 22 | Mean Difference (IV, Random, 95% CI) | ‐1.20 [‐4.63, 2.23] |
| 8.2 Medium term (26 weeks) | 1 | 16 | Mean Difference (IV, Random, 95% CI) | 1.5 [‐2.66, 5.66] |
| 9 Clinical response: 2e mean score/change in mental state (negative symptoms) mean SANS score (high = poor) Show forest plot | 1 | Mean Difference (IV, Random, 95% CI) | Subtotals only | |
| 9.1 Short term (6 weeks) | 1 | 22 | Mean Difference (IV, Random, 95% CI) | ‐4.0 [‐17.55, 9.55] |
| 9.2 Medium term (26 weeks) | 1 | 16 | Mean Difference (IV, Random, 95% CI) | 1.80 [‐14.31, 17.91] |
| 10 Clinical response: 2f mean score/change in global state: mean PANSS global psychopathology score (high = poor) Show forest plot | 1 | Mean Difference (IV, Random, 95% CI) | Subtotals only | |
| 10.1 Short term (6 weeks) | 1 | 22 | Mean Difference (IV, Random, 95% CI) | ‐1.60 [‐6.60, 3.40] |
| 10.2 Medium term (26 weeks) | 1 | 16 | Mean Difference (IV, Random, 95% CI) | 0.0 [‐5.83, 5.83] |
| 11 Adverse effects: specific adverse effects: mean score/change in extrapyramidal adverse effects: mean EPS score (high = poor) Show forest plot | 1 | Mean Difference (IV, Random, 95% CI) | Subtotals only | |
| 11.1 Short term (6 weeks) | 1 | 22 | Mean Difference (IV, Random, 95% CI) | 0.60 [‐0.67, 1.87] |
| 11.2 Medium term (26 weeks) | 1 | 16 | Mean Difference (IV, Random, 95% CI) | 0.30 [‐0.63, 1.23] |
| 12 Adverse effects: other adverse effects (general or specific): mean CGI adverse effect scores (high = poor) Show forest plot | 1 | Mean Difference (IV, Random, 95% CI) | Subtotals only | |
| 12.1 Short term (6 weeks) | 1 | 22 | Mean Difference (IV, Random, 95% CI) | ‐0.10 [‐0.53, 0.33] |
| 13 Leaving the study early: acceptability of treatment ‐ as measured by completion of trial Show forest plot | 1 | Risk Ratio (M‐H, Random, 95% CI) | Subtotals only | |
| 13.1 Short term (6 weeks) | 1 | 24 | Risk Ratio (M‐H, Random, 95% CI) | 1.0 [0.07, 14.21] |
| 13.2 Medium term (26 weeks) | 1 | 24 | Risk Ratio (M‐H, Random, 95% CI) | 0.6 [0.18, 1.97] |
| 13.3 Long term (52 weeks) | 1 | 24 | Risk Ratio (M‐H, Random, 95% CI) | 1.6 [0.73, 3.49] |
| Outcome or subgroup title | No. of studies | No. of participants | Statistical method | Effect size |
| 1 Clinical response: 1a. no clinically significant response in mental state: PANSS reduction ≥ 50% Show forest plot | 1 | Risk Ratio (M‐H, Random, 95% CI) | Subtotals only | |
| 1.1 Medium term (12 weeks) | 1 | 63 | Risk Ratio (M‐H, Random, 95% CI) | 0.54 [0.35, 0.81] |
| 2 Clinical response: 1b. no clinically significant response in mental state: PANSS reduction ≥ 25% Show forest plot | 1 | Risk Ratio (M‐H, Random, 95% CI) | Subtotals only | |
| 2.1 Medium term (12 weeks) | 1 | 63 | Risk Ratio (M‐H, Random, 95% CI) | 0.65 [0.38, 1.10] |
| 3 Clinical response: 1. mean score/change global state: mean CGI‐S score (high = poor) Show forest plot | 1 | Mean Difference (IV, Random, 95% CI) | Subtotals only | |
| 3.1 Medium term (12 weeks) | 1 | 60 | Mean Difference (IV, Random, 95% CI) | ‐0.70 [‐1.18, ‐0.22] |
| 4 Clinical response: 2a. mean score/change mental state: mean PANSS total score (high = poor) Show forest plot | 1 | Mean Difference (IV, Random, 95% CI) | Subtotals only | |
| 4.1 Medium term (12 weeks) | 1 | 60 | Mean Difference (IV, Random, 95% CI) | ‐12.30 [‐22.43, ‐2.17] |
| 5 Clinical response: 2b. mean score/change in mental state (positive symptoms): mean PANSS positive score (high = poor) Show forest plot | 1 | Mean Difference (IV, Random, 95% CI) | Subtotals only | |
| 5.1 Medium term (12 weeks) | 1 | 60 | Mean Difference (IV, Random, 95% CI) | ‐3.10 [‐5.52, ‐0.68] |
| 6 Clinical response: 2b. mean score/change in mental state (negative symptoms): mean PANSS negative score (high = poor) Show forest plot | 1 | Mean Difference (IV, Random, 95% CI) | Subtotals only | |
| 6.1 Medium term (12 weeks) | 1 | 60 | Mean Difference (IV, Random, 95% CI) | 0.80 [‐1.99, 3.59] |
| 7 Adverse effects: specific adverse effects: mean score/change in extrapyramidal adverse effects: reported extrapyramidal adverse effects Show forest plot | 1 | Risk Ratio (M‐H, Random, 95% CI) | Subtotals only | |
| 7.1 Medium term (12 weeks) | 1 | 63 | Risk Ratio (M‐H, Random, 95% CI) | 2.06 [0.41, 10.47] |
| 8 Adverse effects: other adverse effects (general or specific): overall adverse effect rate Show forest plot | 1 | Risk Ratio (M‐H, Random, 95% CI) | Subtotals only | |
| 8.1 Medium term (12 weeks) | 1 | 63 | Risk Ratio (M‐H, Random, 95% CI) | 0.75 [0.50, 1.13] |
| 9 Adverse effects: other adverse effects (general or specific): agitation Show forest plot | 1 | Risk Ratio (M‐H, Random, 95% CI) | Subtotals only | |
| 9.1 Medium term (12 weeks) | 1 | 63 | Risk Ratio (M‐H, Random, 95% CI) | 1.03 [0.15, 6.88] |
| 10 Adverse effects: other adverse effects (general or specific): constipation Show forest plot | 1 | Risk Ratio (M‐H, Random, 95% CI) | Subtotals only | |
| 10.1 Medium term (12 weeks) | 1 | 63 | Risk Ratio (M‐H, Random, 95% CI) | 0.15 [0.01, 2.74] |
| 11 Adverse effects: other adverse effects (general or specific): drowsiness Show forest plot | 1 | Risk Ratio (M‐H, Random, 95% CI) | Subtotals only | |
| 11.1 Medium term (12 weeks) | 1 | 63 | Risk Ratio (M‐H, Random, 95% CI) | 0.47 [0.18, 1.19] |
| 12 Adverse effects: other adverse effects (general or specific): dry mouth Show forest plot | 1 | Risk Ratio (M‐H, Random, 95% CI) | Subtotals only | |
| 12.1 Medium term (12 weeks) | 1 | 63 | Risk Ratio (M‐H, Random, 95% CI) | 0.17 [0.02, 1.35] |
| 13 Adverse effects: other adverse effects (general or specific): headache Show forest plot | 1 | Risk Ratio (M‐H, Random, 95% CI) | Subtotals only | |
| 13.1 Medium term (12 weeks) | 1 | 63 | Risk Ratio (M‐H, Random, 95% CI) | 1.03 [0.28, 3.77] |
| 14 Adverse effects: other adverse effects (general or specific): insomnia Show forest plot | 1 | Risk Ratio (M‐H, Random, 95% CI) | Subtotals only | |
| 14.1 Medium term (12 weeks) | 1 | 63 | Risk Ratio (M‐H, Random, 95% CI) | 0.69 [0.12, 3.84] |
| 15 Adverse effects: other adverse effects (general or specific): orthostatic hypotension Show forest plot | 1 | Risk Ratio (M‐H, Random, 95% CI) | Subtotals only | |
| 15.1 Medium term (12 weeks) | 1 | 63 | Risk Ratio (M‐H, Random, 95% CI) | 0.21 [0.01, 4.13] |
| 16 Adverse effects: other adverse effects (general or specific): tachycardia Show forest plot | 1 | Risk Ratio (M‐H, Random, 95% CI) | Subtotals only | |
| 16.1 Medium term (12 weeks) | 1 | 63 | Risk Ratio (M‐H, Random, 95% CI) | 0.69 [0.12, 3.84] |
| 17 Adverse effects: other adverse effects (general or specific): vertigo Show forest plot | 1 | Risk Ratio (M‐H, Random, 95% CI) | Subtotals only | |
| 17.1 Medium term (12 weeks) | 1 | 63 | Risk Ratio (M‐H, Random, 95% CI) | 0.21 [0.03, 1.67] |
| 18 Leaving the study early: acceptability of treatment ‐ as measured by completion of trial Show forest plot | 1 | Risk Ratio (M‐H, Fixed, 95% CI) | Subtotals only | |
| 18.1 Medium term (12 weeks) | 1 | 63 | Risk Ratio (M‐H, Fixed, 95% CI) | 0.52 [0.05, 5.41] |