Clozapina combinada con diferentes fármacos antipsicóticos para la esquizofrenia resistente al tratamiento
Información
- DOI:
- https://doi.org/10.1002/14651858.CD006324.pub3Copiar DOI

- Base de datos:
-
- Cochrane Database of Systematic Reviews
- Versión publicada:
-
- 23 marzo 2017see what's new
- Tipo:
-
- Intervention
- Etapa:
-
- Review
- Grupo Editorial Cochrane:
-
Grupo Cochrane de Esquizofrenia
- Copyright:
-
- Copyright © 2017 The Cochrane Collaboration. Published by John Wiley & Sons, Ltd.
Cifras del artículo
Altmetric:
Citado por:
Autores
Contributions of authors
SB*: screened search results, retrieved papers against eligibility criteria, appraised quality of papers, extracted data from papers, wrote to authors of papers for additional information, entered data into Review Manager 5, analysed data, interpreted data, and drafted the review.
UO*: collected data, designed search strategies, screened search results, screened and retrieved papers against eligibility criteria, appraised quality of papers, wrote to authors of papers for additional information, entered data into Review Manager 5, analysed data, interpreted data, and revised the manuscript.
MC: screened search results, retrieved papers against eligibility criteria, appraised quality of papers, extracted data from papers, interpreted data, and revised the manuscript.
AC: co‐ordinated the update of the review, helped in designing search strategies and collecting supplemental data, analysed data, interpreted review findings and provided a methodological and clinical perspective, and wrote the review.
* Equal contribution as authors for the 2015 search update.
Sources of support
Internal sources
-
Department of Medicine and Public Health, Section of Psychiatry and Clinical Psychology, University of Verona, Italy.
-
Department of Applied Health and Behavioral Sciences, Section of Psychiatry, University of Pavia, Italy.
External sources
-
No sources of support supplied
Declarations of interest
SB: none known.
UO: none known.
MC: none known.
AC: none known. AC was the main author of one of the studies included in this review (Cipriani 2013a), but he was not involved in the data extraction process for this trial.
Acknowledgements
We would like to thank the editorial base of the Cochrane Schizophrenia Group for their help. We thank Jun Xia and Juan Juan Ren for extracting data from the Chinese literature, Marianna Boso and Corrado Barbui (University of Verona) for their help in carrying out the original review, and Clive Adams and Stefan Leucht for their invaluable editorial support and encouragement. Andrea Cipriani is supported by the NIHR Oxford Cognitive Health Clinical Research Facility and was expert witness for a patent issue about quetiapine extended release.
Version history
| Published | Title | Stage | Authors | Version |
| 2017 Mar 23 | Clozapine combined with different antipsychotic drugs for treatment‐resistant schizophrenia | Review | Sarah Barber, Uwaila Olotu, Martina Corsi, Andrea Cipriani | |
| 2009 Jul 08 | Clozapine combined with different antipsychotic drugs for treatment resistant schizophrenia | Review | Andrea Cipriani, Marianna Boso, Corrado Barbui | |
| 2007 Jan 24 | Clozapine combined with different antipsychotic drugs for treatment resistant schizophrenia | Protocol | Marianna Boso, Andrea Cipriani, Corrado Barbui | |
Differences between protocol and review
The structure of the review has changed since initial publication ‐ in line with methodology changes for all Cochrane Reviews ‐ for example, inclusion of 'Summary of findings' tables. We have re‐ordered and re‐worded our outcomes but not changed the type of outcomes originally listed as outcomes of interest.
Keywords
MeSH
Medical Subject Headings (MeSH) Keywords
- Amisulpride;
- Antipsychotic Agents [adverse effects, *therapeutic use];
- Aripiprazole [adverse effects, therapeutic use];
- Clozapine [adverse effects, *therapeutic use];
- Dibenzothiazepines [therapeutic use];
- Drug Resistance;
- Drug Therapy, Combination;
- Haloperidol [adverse effects, therapeutic use];
- Piperazines [therapeutic use];
- Quetiapine Fumarate;
- Randomized Controlled Trials as Topic;
- Risperidone [therapeutic use];
- Schizophrenia [*drug therapy];
- Sulpiride [adverse effects, analogs & derivatives, therapeutic use];
- Thiazoles [therapeutic use];
- Weight Gain;
Medical Subject Headings Check Words
Adult; Female; Humans; Male;
PICO
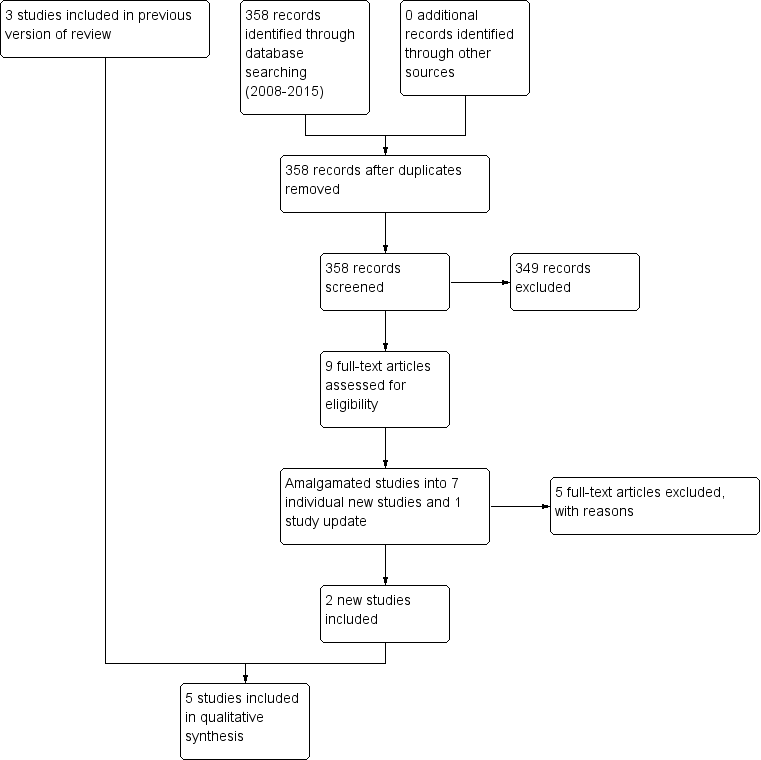
Study flow diagram (2015 update).

Methodological quality graph: review authors' judgements about each methodological quality item presented as percentages across all included studies.

Methodological quality summary: review authors' judgements about each methodological quality item for each included study.

Comparison 1 CLOZAPINE + ARIPIPRAZOLE versus CLOZAPINE + HALOPERIDOL, Outcome 1 Clinical response: mean score/change in mental state: mean change in BPRS score from baseline (high = good).
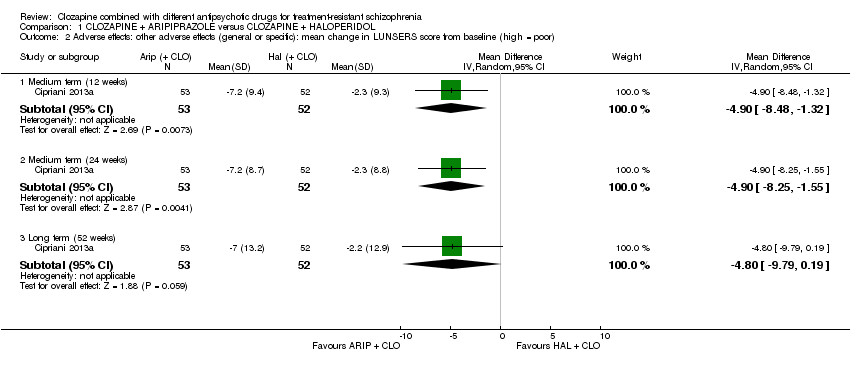
Comparison 1 CLOZAPINE + ARIPIPRAZOLE versus CLOZAPINE + HALOPERIDOL, Outcome 2 Adverse effects: other adverse effects (general or specific): mean change in LUNSERS score from baseline (high = poor).

Comparison 1 CLOZAPINE + ARIPIPRAZOLE versus CLOZAPINE + HALOPERIDOL, Outcome 3 Leaving the study early: acceptability of treatment ‐ as measured by completion of trial.

Comparison 2 CLOZAPINE + AMISULPRIDE versus CLOZAPINE + QUETIAPINE, Outcome 1 Clinical response: 1 mean score/change in global state: mean CGI score (high = poor).
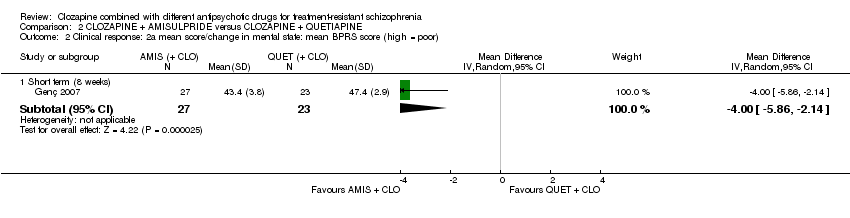
Comparison 2 CLOZAPINE + AMISULPRIDE versus CLOZAPINE + QUETIAPINE, Outcome 2 Clinical response: 2a mean score/change in mental state: mean BPRS score (high = poor).
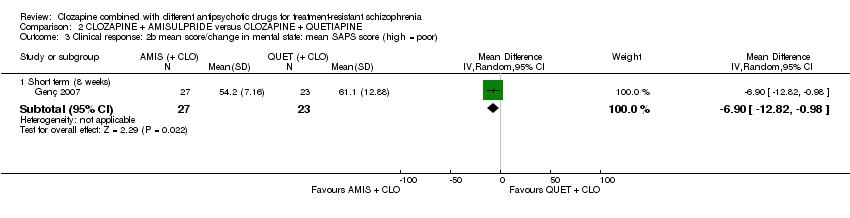
Comparison 2 CLOZAPINE + AMISULPRIDE versus CLOZAPINE + QUETIAPINE, Outcome 3 Clinical response: 2b mean score/change in mental state: mean SAPS score (high = poor).
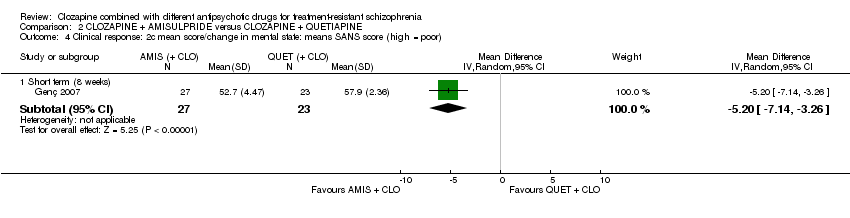
Comparison 2 CLOZAPINE + AMISULPRIDE versus CLOZAPINE + QUETIAPINE, Outcome 4 Clinical response: 2c mean score/change in mental state: means SANS score (high = poor).

Comparison 2 CLOZAPINE + AMISULPRIDE versus CLOZAPINE + QUETIAPINE, Outcome 5 Leaving the study early: acceptability of treatment ‐ as measured by completion of trial.

Comparison 3 CLOZAPINE + RISPERIDONE versus CLOZAPINE + SULPIRIDE, Outcome 1 Clinical response: no clinically significant response in mental state: 20% to 50% reduction in PANSS total score.
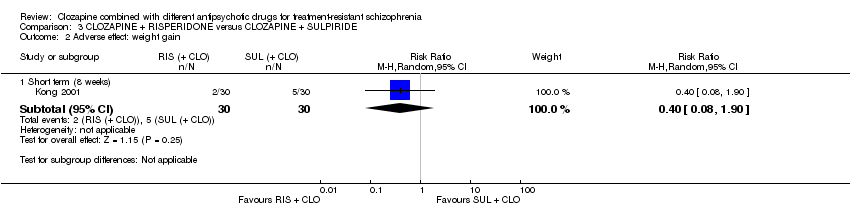
Comparison 3 CLOZAPINE + RISPERIDONE versus CLOZAPINE + SULPIRIDE, Outcome 2 Adverse effect: weight gain.

Comparison 3 CLOZAPINE + RISPERIDONE versus CLOZAPINE + SULPIRIDE, Outcome 3 Clinical response: 2a mean score/change in mental state: mean PANSS total score at endpoint (high = poor).
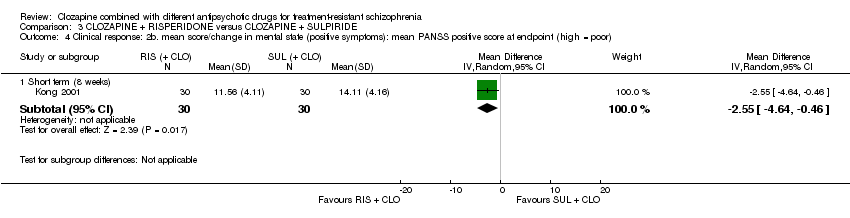
Comparison 3 CLOZAPINE + RISPERIDONE versus CLOZAPINE + SULPIRIDE, Outcome 4 Clinical response: 2b. mean score/change in mental state (positive symptoms): mean PANSS positive score at endpoint (high = poor).
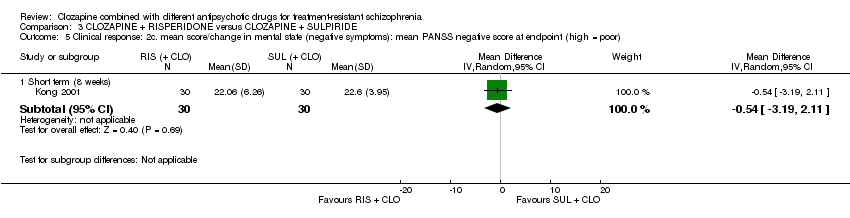
Comparison 3 CLOZAPINE + RISPERIDONE versus CLOZAPINE + SULPIRIDE, Outcome 5 Clinical response: 2c. mean score/change in mental state (negative symptoms): mean PANSS negative score at endpoint (high = poor).

Comparison 3 CLOZAPINE + RISPERIDONE versus CLOZAPINE + SULPIRIDE, Outcome 6 Adverse effects: specific adverse effects: hypersalivation.
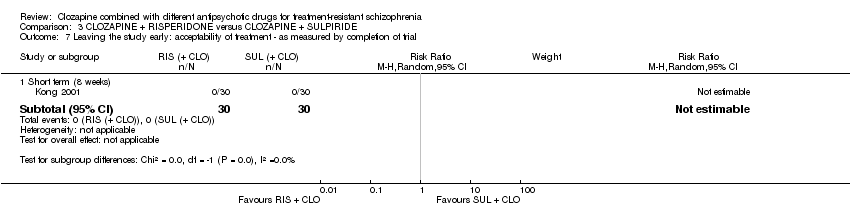
Comparison 3 CLOZAPINE + RISPERIDONE versus CLOZAPINE + SULPIRIDE, Outcome 7 Leaving the study early: acceptability of treatment ‐ as measured by completion of trial.
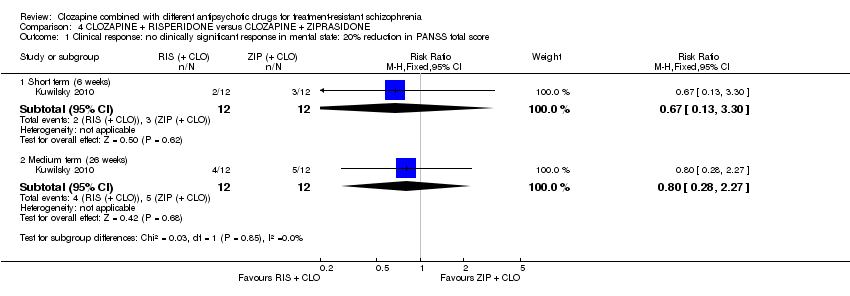
Comparison 4 CLOZAPINE + RISPERIDONE versus CLOZAPINE + ZIPRASIDONE, Outcome 1 Clinical response: no clinically significant response in mental state: 20% reduction in PANSS total score.

Comparison 4 CLOZAPINE + RISPERIDONE versus CLOZAPINE + ZIPRASIDONE, Outcome 2 Clinical response: no clinically significant response in mental state (positive symptoms) 20% reduction in PANSS positive subscore.

Comparison 4 CLOZAPINE + RISPERIDONE versus CLOZAPINE + ZIPRASIDONE, Outcome 3 Clinical response: 1a mean score/change global state: mean CGI subscale score (high = poor).
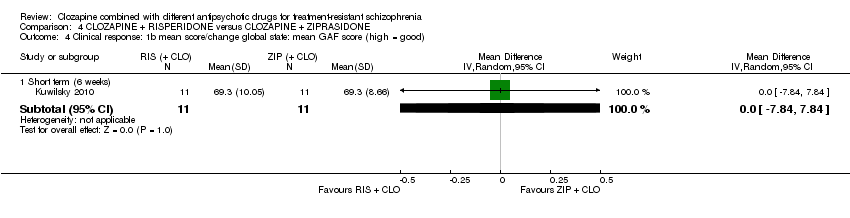
Comparison 4 CLOZAPINE + RISPERIDONE versus CLOZAPINE + ZIPRASIDONE, Outcome 4 Clinical response: 1b mean score/change global state: mean GAF score (high = good).
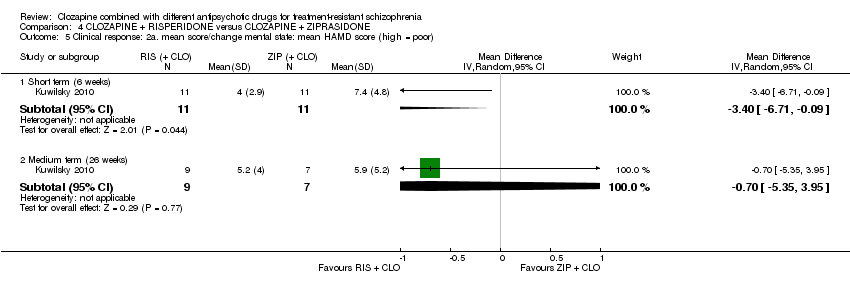
Comparison 4 CLOZAPINE + RISPERIDONE versus CLOZAPINE + ZIPRASIDONE, Outcome 5 Clinical response: 2a. mean score/change mental state: mean HAMD score (high = poor).

Comparison 4 CLOZAPINE + RISPERIDONE versus CLOZAPINE + ZIPRASIDONE, Outcome 6 Clinical response: 2b mean score/change mental state: mean PANSS total score (high = poor).

Comparison 4 CLOZAPINE + RISPERIDONE versus CLOZAPINE + ZIPRASIDONE, Outcome 7 Clinical response: 2c mean score/change in mental state (positive symptoms) mean PANSS positive score (high = poor).
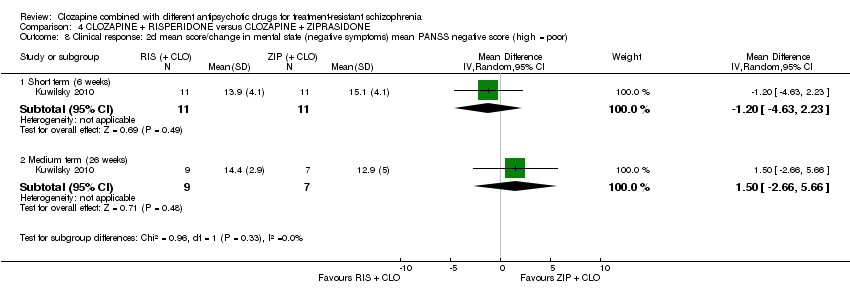
Comparison 4 CLOZAPINE + RISPERIDONE versus CLOZAPINE + ZIPRASIDONE, Outcome 8 Clinical response: 2d mean score/change in mental state (negative symptoms) mean PANSS negative score (high = poor).
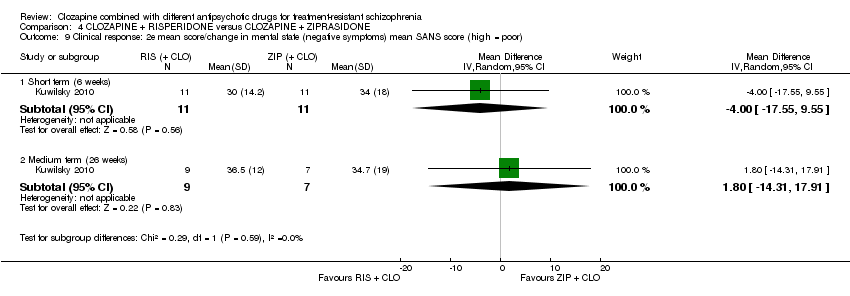
Comparison 4 CLOZAPINE + RISPERIDONE versus CLOZAPINE + ZIPRASIDONE, Outcome 9 Clinical response: 2e mean score/change in mental state (negative symptoms) mean SANS score (high = poor).
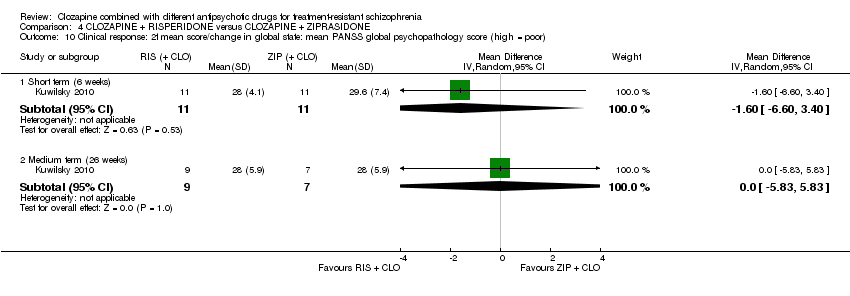
Comparison 4 CLOZAPINE + RISPERIDONE versus CLOZAPINE + ZIPRASIDONE, Outcome 10 Clinical response: 2f mean score/change in global state: mean PANSS global psychopathology score (high = poor).

Comparison 4 CLOZAPINE + RISPERIDONE versus CLOZAPINE + ZIPRASIDONE, Outcome 11 Adverse effects: specific adverse effects: mean score/change in extrapyramidal adverse effects: mean EPS score (high = poor).

Comparison 4 CLOZAPINE + RISPERIDONE versus CLOZAPINE + ZIPRASIDONE, Outcome 12 Adverse effects: other adverse effects (general or specific): mean CGI adverse effect scores (high = poor).

Comparison 4 CLOZAPINE + RISPERIDONE versus CLOZAPINE + ZIPRASIDONE, Outcome 13 Leaving the study early: acceptability of treatment ‐ as measured by completion of trial.

Comparison 5 CLOZAPINE + ZIPRASIDONE versus CLOZAPINE + QUETIAPINE, Outcome 1 Clinical response: 1a. no clinically significant response in mental state: PANSS reduction ≥ 50%.

Comparison 5 CLOZAPINE + ZIPRASIDONE versus CLOZAPINE + QUETIAPINE, Outcome 2 Clinical response: 1b. no clinically significant response in mental state: PANSS reduction ≥ 25%.
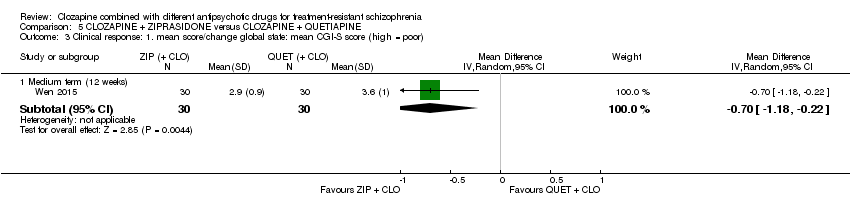
Comparison 5 CLOZAPINE + ZIPRASIDONE versus CLOZAPINE + QUETIAPINE, Outcome 3 Clinical response: 1. mean score/change global state: mean CGI‐S score (high = poor).

Comparison 5 CLOZAPINE + ZIPRASIDONE versus CLOZAPINE + QUETIAPINE, Outcome 4 Clinical response: 2a. mean score/change mental state: mean PANSS total score (high = poor).
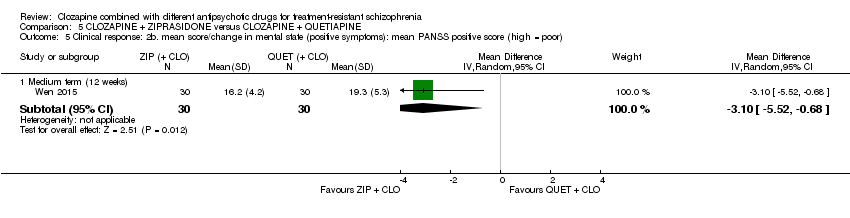
Comparison 5 CLOZAPINE + ZIPRASIDONE versus CLOZAPINE + QUETIAPINE, Outcome 5 Clinical response: 2b. mean score/change in mental state (positive symptoms): mean PANSS positive score (high = poor).

Comparison 5 CLOZAPINE + ZIPRASIDONE versus CLOZAPINE + QUETIAPINE, Outcome 6 Clinical response: 2b. mean score/change in mental state (negative symptoms): mean PANSS negative score (high = poor).

Comparison 5 CLOZAPINE + ZIPRASIDONE versus CLOZAPINE + QUETIAPINE, Outcome 7 Adverse effects: specific adverse effects: mean score/change in extrapyramidal adverse effects: reported extrapyramidal adverse effects.
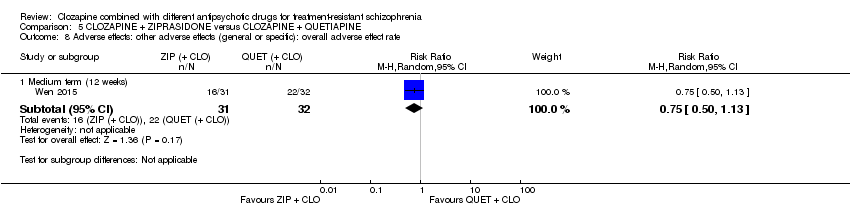
Comparison 5 CLOZAPINE + ZIPRASIDONE versus CLOZAPINE + QUETIAPINE, Outcome 8 Adverse effects: other adverse effects (general or specific): overall adverse effect rate.
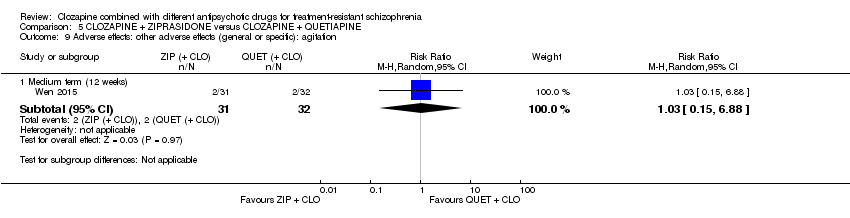
Comparison 5 CLOZAPINE + ZIPRASIDONE versus CLOZAPINE + QUETIAPINE, Outcome 9 Adverse effects: other adverse effects (general or specific): agitation.

Comparison 5 CLOZAPINE + ZIPRASIDONE versus CLOZAPINE + QUETIAPINE, Outcome 10 Adverse effects: other adverse effects (general or specific): constipation.
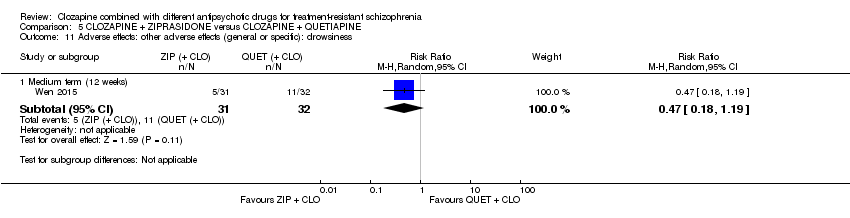
Comparison 5 CLOZAPINE + ZIPRASIDONE versus CLOZAPINE + QUETIAPINE, Outcome 11 Adverse effects: other adverse effects (general or specific): drowsiness.

Comparison 5 CLOZAPINE + ZIPRASIDONE versus CLOZAPINE + QUETIAPINE, Outcome 12 Adverse effects: other adverse effects (general or specific): dry mouth.
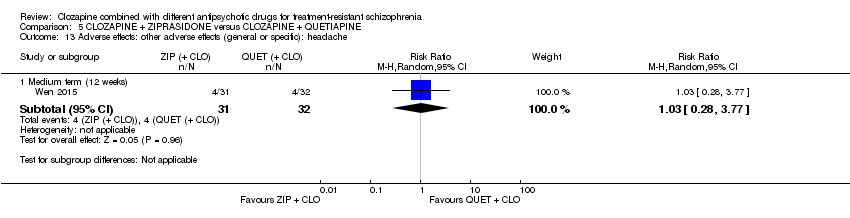
Comparison 5 CLOZAPINE + ZIPRASIDONE versus CLOZAPINE + QUETIAPINE, Outcome 13 Adverse effects: other adverse effects (general or specific): headache.
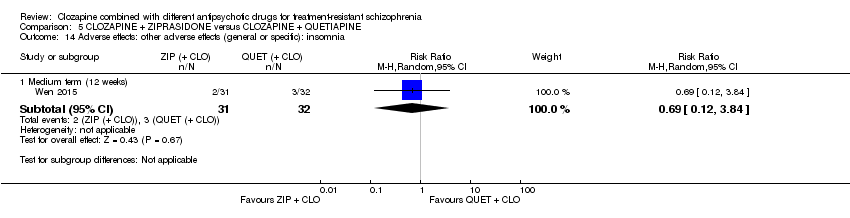
Comparison 5 CLOZAPINE + ZIPRASIDONE versus CLOZAPINE + QUETIAPINE, Outcome 14 Adverse effects: other adverse effects (general or specific): insomnia.

Comparison 5 CLOZAPINE + ZIPRASIDONE versus CLOZAPINE + QUETIAPINE, Outcome 15 Adverse effects: other adverse effects (general or specific): orthostatic hypotension.

Comparison 5 CLOZAPINE + ZIPRASIDONE versus CLOZAPINE + QUETIAPINE, Outcome 16 Adverse effects: other adverse effects (general or specific): tachycardia.

Comparison 5 CLOZAPINE + ZIPRASIDONE versus CLOZAPINE + QUETIAPINE, Outcome 17 Adverse effects: other adverse effects (general or specific): vertigo.
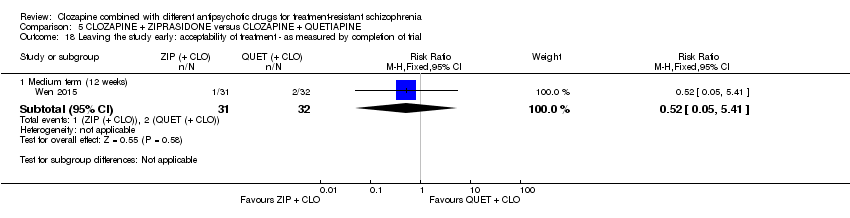
Comparison 5 CLOZAPINE + ZIPRASIDONE versus CLOZAPINE + QUETIAPINE, Outcome 18 Leaving the study early: acceptability of treatment ‐ as measured by completion of trial.
| Methods | Allocation: proper randomisation (e.g. by computer‐generated number sequence) and adequate allocation concealment (e.g. by central randomisation by a third party). Blinding: ideally double blind, but pragmatically blinding the participant and the outcome assessor is adequate. Setting: inpatients and outpatients. Duration: short‐term primary outcome (at 12 weeks), and then medium‐ to long‐term follow‐up (up to 52 week). |
| Participants | Diagnosis: treatment‐resistant schizophrenia, defined by persistent positive symptoms despite at least 6 months of treatment with clozapine ≥ 400 mg/day. N = 200. Sex: men and women. Age: > 18 years. |
| Interventions | 1. Clozapine plus risperidone (or paliperidone). 2. Clozapine plus aripiprazole (or amisulpride). |
| Outcomes | Measure of clinical response to include both dichotomous measures of global (e.g. CGI score) and mental state (e.g. BPRS score). Adverse effects to include weight gain, extrapyramidal symptoms, haematological problems, and hypersalivation. Acceptability assessed by leaving the study early. Service utilisation (e.g. hospital admission). Quality of life/satisfaction measure. |
| Notes | The study should be funded by an independent funding body, such as the National Institute for Health Research or Wellcome Trust. |
| BPRS: Brief Psychiatric Rating Scale; CGI: Clinical Global Impression; n: number of participants. | |
| Clozapine + aripi prazole versus clozapine + haloperidol for treatment‐resistant schizophrenia | ||||||
| Patient or population: people with treatment‐resistant schizophrenia Setting: inpatients and outpatients Intervention: aripiprazole (+ CLO) Comparison: haloperidol (+ CLO) | ||||||
| Outcomes | Anticipated absolute effects* (95% CI) | Relative effect | No of participants | Quality of the evidence | Comments | |
| Risk with haloperidol (+ CLO) | Risk with aripiprazole (+ CLO) | |||||
| Clinical response: no clinically significant response in mental state | See comment | See comment | Not estimable | ‐ | ‐ | No data reported. |
| Adverse effects: weight gain | See comment | See comment | Not estimable | ‐ | ‐ | No data reported. |
| Clinical response: mean score/change in global state | See comment | See comment | ‐ | ‐ | ‐ | No data reported. |
| Clinical response: mean score/change in mental state: change in BPRS score from baseline (high = good), Long term (12 months) | The mean score/change in mental state (change in BPRS from baseline) ‐ long term (12 months) was 0 | The mean score/change in mental state ‐ defined by change in BPRS from baseline ‐ long term (12 months) in the intervention group was 0.9 more (4.38 fewer to 6.18 more) | ‐ | 105 | ⊕⊕⊝⊝ | ‐ |
| Leaving the study early: acceptability of treatment ‐ as measured by completion of trial Long term (12 months) | Study population | RR 1.27 | 106 | ⊕⊝⊝⊝ | ‐ | |
| 283 per 1000 | 359 per 1000 | |||||
| Moderate | ||||||
| 283 per 1000 | 359 per 1000 | |||||
| Service utilisation outcomes: hospital admission or days in hospital | See comment | See comment | Not estimable | ‐ | ‐ | No data reported. |
| Quality of life/satisfaction with care for either recipients of care or carers: significant change in quality of life/satisfaction | See comment | See comment | Not estimable | ‐ | ‐ | No data reported. |
| *The risk in the intervention group (and its 95% confidence interval) is based on the assumed risk in the comparison group and the relative effect of the intervention (and its 95% CI). BPRS: Brief Psychiatric Rating Scale; CI: confidence interval; CLO: clozapine; RCT: randomised controlled trial; RR: risk ratio. | ||||||
| GRADE Working Group grades of evidence | ||||||
| 1 Risk of bias: downgraded by 1 level because high risk for performance bias (open label), but low risk for other biases (selection, detection, attrition, reporting). 2 Inconsistency and publication bias: not applicable (no meta‐analysis). 3 Indirectness: not downgraded because good applicability in terms of participants and interventions and rating scale measures participant‐important outcome (mental state). 4 Imprecision: downgraded by 1 level because underpowered to detect difference. Not downgraded by 2 levels because CI around mean difference did not include appreciable benefit and appreciable harm (total score on BPRS = 126). 5 Indirectness: downgraded by 1 level because leaving the study early a surrogate measure of acceptability of treatment. 6 Imprecision: downgraded by 2 level because underpowered to detect difference and CI around relative effect included appreciable benefit and harm (from less likely to leave study early to over two times more likely to leave study early). | ||||||
| Clozapine + amisulpride versus clozapine + quetiapine for treatment‐resistant schizophrenia | ||||||
| Patient or population: people with treatment‐resistant schizophrenia Setting: inpatients and outpatients Intervention: amisulpride (+ CLO) Comparison: quetiapine (+ CLO) | ||||||
| Outcomes | Anticipated absolute effects* (95% CI) | Relative effect | No of participants | Quality of the evidence | Comments | |
| Risk with quetiapine (+ CLO) | Risk with amisulpride (+ CLO) | |||||
| Clinical response: no clinically significant response in mental state | See comment | See comment | Not estimable | (1 RCT) | ‐ | No data reported. |
| Adverse effects: weight gain | See comment | See comment | Not estimable | (1 RCT) | ‐ | No data reported. |
| Clinical response: mean score/change in global state: mean CGI score (high = poor) Short term (8 weeks) | The mean score/change in global state (CGI) ‐ short term (8 weeks) was 0 | The mean score/change in global state (CGI) ‐ short term (8 weeks) in the intervention group was 0.9 fewer (1.38 fewer to 0.42 fewer) | ‐ | 50 | ⊕⊝⊝⊝ | ‐ |
| Clinical response: mean score/change in mental state: mean BPRS score (high = poor) Short term (8 weeks) | The mean score/change in mental state (BPRS) ‐ short term (8 weeks) was 0 | The mean score/change in mental state (BPRS) ‐ short term (8 weeks) in the intervention group was 4 fewer (5.86 fewer to 2.14 fewer) | ‐ | 50 | ⊕⊕⊝⊝ | ‐ |
| Leaving the study early: acceptability of treatment ‐ as measured by completion of trial | Study population | RR 0.20 | 56 | ⊕⊝⊝⊝ | ‐ | |
| 179 per 1000 | 36 per 1000 | |||||
| Moderate | ||||||
| 179 per 1000 | 36 per 1000 | |||||
| Service utilisation outcomes: hospital admission or days in hospital | See comment | See comment | Not estimable | (1 RCT) | ‐ | No data reported. |
| Quality of life/satisfaction with care for either recipients of care or carers: significant change in quality of life/satisfaction | See comment | See comment | Not estimable | (1 RCT) | ‐ | No data reported. |
| *The risk in the intervention group (and its 95% confidence interval) is based on the assumed risk in the comparison group and the relative effect of the intervention (and its 95% CI). BPRS: Brief Psychiatric Rating Scale; CGI: Clinical Global Impression; CI: confidence interval; CLO: clozapine; RCT: randomised controlled trial; RR: risk ratio. | ||||||
| GRADE Working Group grades of evidence | ||||||
| 1 Risk of bias: downgraded by 2 levels because high risk of reporting bias and unclear (so potentially high) risk of other biases (selection, performance, attrition). 2 Inconsistency and publication bias: not applicable (no meta‐analysis). 3 Indirectness: not downgraded because good applicability in terms of participants and interventions and rating score measures a participant‐important outcome (global state). 4 Imprecision: downgraded by 1 level because underpowered to detect difference. Not downgraded by 2 levels because CI around mean difference did not include appreciable benefit and appreciable harm (total score on CGI = 7). 5 Indirectness: not downgraded because good applicability in terms of participants and interventions and rating score measures a participant‐important outcome (mental state). 6 Imprecision: not downgraded because powered to detect difference and narrow CI. 7 Indirectness: downgraded by 1 level because leaving study early surrogate measure of participant‐important outcome (acceptability of treatment). | ||||||
| Clozapine + risperidone versus clozapine + sulpiride for treatment‐resistant schizophrenia | ||||||
| Patient or population: people with treatment‐resistant schizophrenia Setting: inpatients Intervention: risperidone (+ CLO) Comparison: sulpiride (+ CLO) | ||||||
| Outcomes | Anticipated absolute effects* (95% CI) | Relative effect | No of participants | Quality of the evidence | Comments | |
| Risk with Sulpiride (+ CLO) | Risk with Risperidone (+ CLO) | |||||
| Clinical response: no clinically significant response in mental state: 20% to 50% reduction in PANSS total score | Study population | RR 0.82 | 60 | ⊕⊝⊝⊝ | ‐ | |
| 367 per 1000 | 301 per 1000 | |||||
| Moderate | ||||||
| 367 per 1000 | 301 per 1000 | |||||
| Adverse effects: weight gain | Study population | RR 0.40 | 60 | ⊕⊝⊝⊝ | ‐ | |
| 167 per 1000 | 67 per 1000 | |||||
| Moderate | ||||||
| 167 per 1000 | 67 per 1000 | |||||
| Clinical response: mean score/change in global state | See comment | See comment | ‐ | (1 RCT) | ‐ | No data reported. |
| Clinical response: mean score/change in mental state: mean PANSS total score (high = poor) | The mean score/change in mental state (PANSS total) was 0 | The mean score/change in mental state (PANSS total) in the intervention group was 2.28 undefined fewer (7.41 fewer to 2.85 more) | ‐ | 60 | ⊕⊝⊝⊝ | ‐ |
| Leaving the study early: acceptability of treatment ‐ as measured by completion of trial | Study population | Not estimable | 60 | ⊕⊝⊝⊝ | ‐ | |
| 0 per 1000 | 0 per 1000 | |||||
| Service utilisation outcomes: hospital admission or days in hospital | See comment | See comment | Not estimable | ‐ | ‐ | No data reported. |
| Quality of life/satisfaction with care for either recipients of care or carers: significant change in quality of life/satisfaction | See comment | See comment | Not estimable | ‐ | ‐ | No data reported. |
| *The risk in the intervention group (and its 95% confidence interval) is based on the assumed risk in the comparison group and the relative effect of the intervention (and its 95% CI). CI: confidence interval; CLO: clozapine; PANSS: Positive and Negative Syndrome Scale; RCT: randomised controlled trial; RR: risk ratio. | ||||||
| GRADE Working Group grades of evidence | ||||||
| 1 Risk of bias: downgraded by 2 levels because unclear (so potentially high) risk of biases (selection, performance, detection, reporting). 2 Inconsistency and publication bias: not applicable (no meta‐analysis). 3 Indirectness: downgraded by 1 level because unclear population applicability (inclusion criteria not clearly specified). Not downgraded by 2 levels because rating scale measures participant‐important outcome (mental state). 4 Imprecision: downgraded by 2 levels because underpowered to detect difference and CI around relative effect includes appreciable benefit and harm. 5 Indirectness: downgraded by 1 level because unclear population applicability (inclusion criteria not clearly specified). Not downgraded by 2 levels because weight gain a direct measure of a participant‐important outcome. 6 Indirectness: downgraded by 1 level because unclear population applicability (inclusion criteria not clearly specified). Not downgraded by 2 levels because rating scale measures participant‐important outcome (mental state). 7 Imprecision: downgraded by 1 level because underpowered to detect difference. Not downgraded by 2 levels because CI around mean difference did not include appreciable benefit and appreciable harm (total score on PANSS = 120). 8 Indirectness: downgraded by 2 levels because unclear population applicability (inclusion criteria not clearly specified) and leaving the study early a surrogate measure of acceptability of treatment. 9 Imprecision: downgraded by 1 level because underpowered to detect difference. Not downgraded by 2 levels because no CI. | ||||||
| Clozapine + risperidone versus clozapine + ziprasidone for treatment‐resistant schizophrenia | ||||||
| Patient or population: people with treatment‐resistant schizophrenia Setting: inpatients and outpatients Intervention: risperidone (+ CLO) Comparison: ziprasidone (+ CLO) | ||||||
| Outcomes | Anticipated absolute effects* (95% CI) | Relative effect | No of participants | Quality of the evidence | Comments | |
| Risk with ziprasidone (+ CLO) | Risk with risperidone (+ CLO) | |||||
| Clinical response: no clinically significant response in mental state: 20% reduction in PANSS total score | Study population | RR 0.80 | 24 | ⊕⊝⊝⊝ | ‐ | |
| 417 per 1000 | 333 per 1000 | |||||
| Moderate | ||||||
| 417 per 1000 | 333 per 1000 | |||||
| Adverse effects: weight gain | See comment | See comment | Not estimable | ‐ | ‐ | No SDs reported. |
| Clinical response: mean score/change in global state: mean CGI‐II Global improvement score (high = poor) Short term (6 weeks) | The mean score/change in global state (CGI‐II Global improvement) ‐ short term (6 weeks) was 0 | The mean score/change in global state (CGI‐II global improvement) ‐ short term (6 weeks) in the intervention group was 0.3 fewer (0.82 fewer to 0.22 more) | ‐ | 22 | ⊕⊝⊝⊝ | ‐ |
| Clinical response: mean score/change in mental state: mean PANSS total score (high = poor) Medium term (26 weeks) | The mean score/change in mental state (PANSS total) ‐ medium term (26 weeks) was 0 | The mean score/change in mental state (PANSS total) ‐ medium term (26 weeks) in the intervention group was 1 more (7.91 fewer to 9.91 more) | ‐ | 16 | ⊕⊝⊝⊝ | ‐ |
| Leaving the study early: acceptability of treatment ‐ as measured by completion of trial Long term (52 weeks) | Study population | RR 1.60 | 24 | ⊕⊝⊝⊝ | ‐ | |
| 417 per 1000 | 667 per 1000 | |||||
| Moderate | ||||||
| 417 per 1000 | 667 per 1000 | |||||
| Service utilisation outcomes: hospital admission or days in hospital | See comment | See comment | Not estimable | ‐ | ‐ | No data reported. |
| Quality of life/satisfaction with care for either recipients of care or carers: significant change in quality of life/satisfaction | See comment | See comment | Not estimable | ‐ | ‐ | No data reported. |
| *The risk in the intervention group (and its 95% confidence interval) is based on the assumed risk in the comparison group and the relative effect of the intervention (and its 95% CI). CI: confidence interval; CLO: clozapine; PANSS: Positive and Negative Syndrome Scale; RCT: randomised controlled trial; RR: risk ratio. | ||||||
| GRADE Working Group grades of evidence | ||||||
| 1 Risk of bias: downgraded by 2 levels because high risk of performance bias, detection bias, attrition bias, and reporting bias. 2 Inconsistency and publication bias: not applicable (no meta‐analysis). 3 Indirectness: not downgraded because good applicability in terms of participants and interventions and rating score measures a participant‐important outcome (mental state). 4 Imprecision: downgraded by 2 levels because underpowered to detect difference and CI around relative effect includes appreciable benefit and harm (from less likely to over two times more likely to have no clinical response in mental state defined by PANSS 20% reduction). 5 Indirectness: not downgraded because good applicability (participants and interventions), and rating score measures a participant‐important outcome (global state). 6 Imprecision: downgraded by 1 level because underpowered to detect difference. Not downgraded by 2 levels because CI around mean difference does not include appreciable benefit and appreciable harm (total score on CGI = 7). 7 Imprecision: downgraded by 1 level because underpowered to detect difference. Not downgraded by 2 levels because CI around mean difference does not include appreciable benefit and appreciable harm (total score on PANSS = 120). 8 Indirectness: downgraded by 1 level because leaving the study early a surrogate for participant‐important outcome (acceptability of treatment). 9 Indirectness: downgraded by 2 levels because underpowered to detect difference and CI around relative effect includes appreciable benefit and harm (from less likely to over three times more likely to leave the study early). | ||||||
| Clozapine + ziprasidone versus clozapine + quetiapine for treatment‐resistant schizophrenia | ||||||
| Patient or population: people with treatment‐resistant schizophrenia Setting: inpatients and outpatients Intervention: ziprasidone (+ CLO) Comparison: quetiapine (+ CLO) | ||||||
| Outcomes | Anticipated absolute effects* (95% CI) | Relative effect | No of participants | Quality of the evidence | Comments | |
| Risk with quetiapine (+ CLO) | Risk with ziprasidone (+ CLO) | |||||
| Clinical response: no clinically significant response in mental state: ≥ 50% reduction in PANSS total score Medium term (12 weeks) | Study population | RR 0.54 | 63 | ⊕⊕⊝⊝ | ‐ | |
| 844 per 1000 | 456 per 1000 | |||||
| Moderate | ||||||
| 844 per 1000 | 456 per 1000 | |||||
| Adverse effects: weight gain | See comment | See comment | Not estimable | ‐ | ‐ | No data reported. |
| Clinical response: mean score/change in global state: mean CGI‐S score (high = poor) Medium term (12 weeks) | The mean score/change in global state (CGI‐S) ‐ medium term (12 weeks) was 0 | The mean score/change in global state (CGI‐S) ‐ medium term (12 weeks) in the intervention group was 0.7 fewer (1.18 fewer to 0.22 fewer) | ‐ | 60 | ⊕⊕⊝⊝ | ‐ |
| Clinical response: mean score/change in mental state: mean PANSS total score (high = poor) Medium term (12 weeks) | The mean score/change in mental state (PANSS total) ‐ medium term (12 weeks) was 0 | The mean score/change in mental state (PANSS total) ‐ medium term (12 weeks) in the intervention group was 12.3 fewer (22.43 fewer to 2.17 fewer) | ‐ | 60 | ⊕⊕⊝⊝ | ‐ |
| Leaving the study early: acceptability of treatment ‐ as measured by completion of trial | Study population | RR 0.52 | 63 | ⊕⊝⊝⊝ | ‐ | |
| 63 per 1000 | 33 per 1000 | |||||
| Moderate | ||||||
| 63 per 1000 | 33 per 1000 | |||||
| Service utilisation outcomes: hospital admission or days in hospital | See comment | See comment | Not estimable | ‐ | ‐ | No data reported. |
| Quality of life/satisfaction with care for either recipients of care or carers: significant change in quality of life/satisfaction | See comment | See comment | Not estimable | ‐ | ‐ | No data reported. |
| *The risk in the intervention group (and its 95% confidence interval) is based on the assumed risk in the comparison group and the relative effect of the intervention (and its 95% CI). CGI ‐S: Clinical Global Impression – Severity; CI: confidence interval; CLO: clozapine; PANSS: Positive and Negative Syndrome Scale; RCT: randomised controlled trial; RR: risk ratio; SD: standard deviation. | ||||||
| GRADE Working Group grades of evidence | ||||||
| 1 Risk of bias: downgraded by 2 levels because unclear (so potentially high) risk of biases (selection, performance, reporting). 2 Inconsistency and publication bias: not applicable (no meta‐analysis). 3 Indirectness: not downgraded because good applicability in terms of participants and interventions and rating scale measures a participant‐important outcome (mental state). 4 Imprecision: not downgraded because powered to detect difference and narrow CI. 5 Indirectness: not downgraded because good applicability (participants and interventions) and rating scale measures a participant‐important outcome (global state). 6 Indirectness: downgraded by 1 level because leaving the study early surrogate measure for participant‐important outcome (acceptability of treatment). 7 Imprecision: downgraded by 2 levels because underpowered to detect difference and CI around relative effect includes appreciable benefit and harm (from less likely to leave study early to five times more likely to leave study early). | ||||||
| Outcome or subgroup title | No. of studies | No. of participants | Statistical method | Effect size |
| 1 Clinical response: mean score/change in mental state: mean change in BPRS score from baseline (high = good) Show forest plot | 1 | Mean Difference (IV, Random, 95% CI) | Subtotals only | |
| 1.1 Medium term (12 weeks) | 1 | 105 | Mean Difference (IV, Random, 95% CI) | ‐1.40 [‐5.59, 2.79] |
| 1.2 Medium term (24 weeks) | 1 | 105 | Mean Difference (IV, Random, 95% CI) | ‐0.70 [‐4.81, 3.41] |
| 1.3 Long term (52 weeks) | 1 | 105 | Mean Difference (IV, Random, 95% CI) | 0.90 [‐4.38, 6.18] |
| 2 Adverse effects: other adverse effects (general or specific): mean change in LUNSERS score from baseline (high = poor) Show forest plot | 1 | Mean Difference (IV, Random, 95% CI) | Subtotals only | |
| 2.1 Medium term (12 weeks) | 1 | 105 | Mean Difference (IV, Random, 95% CI) | ‐4.9 [‐8.48, ‐1.32] |
| 2.2 Medium term (24 weeks) | 1 | 105 | Mean Difference (IV, Random, 95% CI) | ‐4.9 [‐8.25, ‐1.55] |
| 2.3 Long term (52 weeks) | 1 | 105 | Mean Difference (IV, Random, 95% CI) | ‐4.8 [‐9.79, 0.19] |
| 3 Leaving the study early: acceptability of treatment ‐ as measured by completion of trial Show forest plot | 1 | Risk Ratio (M‐H, Random, 95% CI) | Subtotals only | |
| 3.1 Medium term (12 weeks) | 1 | 106 | Risk Ratio (M‐H, Random, 95% CI) | 0.88 [0.34, 2.24] |
| 3.2 Medium term (24 weeks) | 1 | 106 | Risk Ratio (M‐H, Random, 95% CI) | 1.17 [0.60, 2.28] |
| 3.3 Long term (52 weeks) | 1 | 106 | Risk Ratio (M‐H, Random, 95% CI) | 1.27 [0.72, 2.22] |
| Outcome or subgroup title | No. of studies | No. of participants | Statistical method | Effect size |
| 1 Clinical response: 1 mean score/change in global state: mean CGI score (high = poor) Show forest plot | 1 | Mean Difference (IV, Random, 95% CI) | Subtotals only | |
| 1.1 Short term (8 weeks) | 1 | 50 | Mean Difference (IV, Random, 95% CI) | ‐0.90 [‐1.38, ‐0.42] |
| 2 Clinical response: 2a mean score/change in mental state: mean BPRS score (high = poor) Show forest plot | 1 | Mean Difference (IV, Random, 95% CI) | Subtotals only | |
| 2.1 Short term (8 weeks) | 1 | 50 | Mean Difference (IV, Random, 95% CI) | ‐4.0 [‐5.86, ‐2.14] |
| 3 Clinical response: 2b mean score/change in mental state: mean SAPS score (high = poor) Show forest plot | 1 | Mean Difference (IV, Random, 95% CI) | Subtotals only | |
| 3.1 Short term (8 weeks) | 1 | 50 | Mean Difference (IV, Random, 95% CI) | ‐6.90 [‐12.82, ‐0.98] |
| 4 Clinical response: 2c mean score/change in mental state: means SANS score (high = poor) Show forest plot | 1 | Mean Difference (IV, Random, 95% CI) | Subtotals only | |
| 4.1 Short term (8 weeks) | 1 | 50 | Mean Difference (IV, Random, 95% CI) | ‐5.20 [‐7.14, ‐3.26] |
| 5 Leaving the study early: acceptability of treatment ‐ as measured by completion of trial Show forest plot | 1 | 56 | Risk Ratio (M‐H, Fixed, 95% CI) | 0.2 [0.02, 1.60] |
| Outcome or subgroup title | No. of studies | No. of participants | Statistical method | Effect size |
| 1 Clinical response: no clinically significant response in mental state: 20% to 50% reduction in PANSS total score Show forest plot | 1 | Risk Ratio (M‐H, Random, 95% CI) | Subtotals only | |
| 1.1 Short term (8 weeks) | 1 | 60 | Risk Ratio (M‐H, Random, 95% CI) | 0.82 [0.40, 1.68] |
| 2 Adverse effect: weight gain Show forest plot | 1 | Risk Ratio (M‐H, Random, 95% CI) | Subtotals only | |
| 2.1 Short term (8 weeks) | 1 | 60 | Risk Ratio (M‐H, Random, 95% CI) | 0.4 [0.08, 1.90] |
| 3 Clinical response: 2a mean score/change in mental state: mean PANSS total score at endpoint (high = poor) Show forest plot | 1 | Mean Difference (IV, Random, 95% CI) | Subtotals only | |
| 3.1 Short term (8 weeks) | 1 | 60 | Mean Difference (IV, Random, 95% CI) | ‐2.28 [‐7.41, 2.85] |
| 4 Clinical response: 2b. mean score/change in mental state (positive symptoms): mean PANSS positive score at endpoint (high = poor) Show forest plot | 1 | Mean Difference (IV, Random, 95% CI) | Subtotals only | |
| 4.1 Short term (8 weeks) | 1 | 60 | Mean Difference (IV, Random, 95% CI) | ‐2.55 [‐4.64, ‐0.46] |
| 5 Clinical response: 2c. mean score/change in mental state (negative symptoms): mean PANSS negative score at endpoint (high = poor) Show forest plot | 1 | Mean Difference (IV, Random, 95% CI) | Subtotals only | |
| 5.1 Short term (8 weeks) | 1 | 60 | Mean Difference (IV, Random, 95% CI) | ‐0.54 [‐3.19, 2.11] |
| 6 Adverse effects: specific adverse effects: hypersalivation Show forest plot | 1 | Risk Ratio (M‐H, Random, 95% CI) | Subtotals only | |
| 6.1 Short term (8 weeks) | 1 | 60 | Risk Ratio (M‐H, Random, 95% CI) | 0.33 [0.04, 3.03] |
| 7 Leaving the study early: acceptability of treatment ‐ as measured by completion of trial Show forest plot | 1 | Risk Ratio (M‐H, Random, 95% CI) | Subtotals only | |
| 7.1 Short term (8 weeks) | 1 | 60 | Risk Ratio (M‐H, Random, 95% CI) | 0.0 [0.0, 0.0] |
| Outcome or subgroup title | No. of studies | No. of participants | Statistical method | Effect size |
| 1 Clinical response: no clinically significant response in mental state: 20% reduction in PANSS total score Show forest plot | 1 | Risk Ratio (M‐H, Fixed, 95% CI) | Subtotals only | |
| 1.1 Short term (6 weeks) | 1 | 24 | Risk Ratio (M‐H, Fixed, 95% CI) | 0.67 [0.13, 3.30] |
| 1.2 Medium term (26 weeks) | 1 | 24 | Risk Ratio (M‐H, Fixed, 95% CI) | 0.8 [0.28, 2.27] |
| 2 Clinical response: no clinically significant response in mental state (positive symptoms) 20% reduction in PANSS positive subscore Show forest plot | 1 | Risk Ratio (M‐H, Random, 95% CI) | Subtotals only | |
| 2.1 Short term (6 weeks) | 1 | 24 | Risk Ratio (M‐H, Random, 95% CI) | 3.0 [0.36, 24.92] |
| 3 Clinical response: 1a mean score/change global state: mean CGI subscale score (high = poor) Show forest plot | 1 | Mean Difference (IV, Random, 95% CI) | Subtotals only | |
| 3.1 Severity of illness | 1 | 22 | Mean Difference (IV, Random, 95% CI) | 0.20 [‐0.32, 0.72] |
| 3.2 Global improvement | 1 | 22 | Mean Difference (IV, Random, 95% CI) | ‐0.30 [‐0.82, 0.22] |
| 3.3 Therapeutic efficacy | 1 | 22 | Mean Difference (IV, Random, 95% CI) | ‐0.30 [‐0.79, 0.19] |
| 4 Clinical response: 1b mean score/change global state: mean GAF score (high = good) Show forest plot | 1 | Mean Difference (IV, Random, 95% CI) | Subtotals only | |
| 4.1 Short term (6 weeks) | 1 | 22 | Mean Difference (IV, Random, 95% CI) | 0.0 [‐7.84, 7.84] |
| 5 Clinical response: 2a. mean score/change mental state: mean HAMD score (high = poor) Show forest plot | 1 | Mean Difference (IV, Random, 95% CI) | Subtotals only | |
| 5.1 Short term (6 weeks) | 1 | 22 | Mean Difference (IV, Random, 95% CI) | ‐3.40 [‐6.71, ‐0.09] |
| 5.2 Medium term (26 weeks) | 1 | 16 | Mean Difference (IV, Random, 95% CI) | ‐0.70 [‐5.35, 3.95] |
| 6 Clinical response: 2b mean score/change mental state: mean PANSS total score (high = poor) Show forest plot | 1 | Mean Difference (IV, Random, 95% CI) | Subtotals only | |
| 6.1 Short term (6 weeks) | 1 | 22 | Mean Difference (IV, Random, 95% CI) | ‐3.10 [‐11.38, 5.18] |
| 6.2 Medium term (26 weeks) | 1 | 16 | Mean Difference (IV, Random, 95% CI) | 1.0 [‐7.91, 9.91] |
| 7 Clinical response: 2c mean score/change in mental state (positive symptoms) mean PANSS positive score (high = poor) Show forest plot | 1 | Mean Difference (IV, Random, 95% CI) | Subtotals only | |
| 7.1 Short term (6 weeks) | 1 | 22 | Mean Difference (IV, Random, 95% CI) | ‐0.20 [‐1.84, 1.44] |
| 7.2 Medium term (26 weeks) | 1 | 16 | Mean Difference (IV, Random, 95% CI) | ‐0.20 [‐2.58, 2.18] |
| 8 Clinical response: 2d mean score/change in mental state (negative symptoms) mean PANSS negative score (high = poor) Show forest plot | 1 | Mean Difference (IV, Random, 95% CI) | Subtotals only | |
| 8.1 Short term (6 weeks) | 1 | 22 | Mean Difference (IV, Random, 95% CI) | ‐1.20 [‐4.63, 2.23] |
| 8.2 Medium term (26 weeks) | 1 | 16 | Mean Difference (IV, Random, 95% CI) | 1.5 [‐2.66, 5.66] |
| 9 Clinical response: 2e mean score/change in mental state (negative symptoms) mean SANS score (high = poor) Show forest plot | 1 | Mean Difference (IV, Random, 95% CI) | Subtotals only | |
| 9.1 Short term (6 weeks) | 1 | 22 | Mean Difference (IV, Random, 95% CI) | ‐4.0 [‐17.55, 9.55] |
| 9.2 Medium term (26 weeks) | 1 | 16 | Mean Difference (IV, Random, 95% CI) | 1.80 [‐14.31, 17.91] |
| 10 Clinical response: 2f mean score/change in global state: mean PANSS global psychopathology score (high = poor) Show forest plot | 1 | Mean Difference (IV, Random, 95% CI) | Subtotals only | |
| 10.1 Short term (6 weeks) | 1 | 22 | Mean Difference (IV, Random, 95% CI) | ‐1.60 [‐6.60, 3.40] |
| 10.2 Medium term (26 weeks) | 1 | 16 | Mean Difference (IV, Random, 95% CI) | 0.0 [‐5.83, 5.83] |
| 11 Adverse effects: specific adverse effects: mean score/change in extrapyramidal adverse effects: mean EPS score (high = poor) Show forest plot | 1 | Mean Difference (IV, Random, 95% CI) | Subtotals only | |
| 11.1 Short term (6 weeks) | 1 | 22 | Mean Difference (IV, Random, 95% CI) | 0.60 [‐0.67, 1.87] |
| 11.2 Medium term (26 weeks) | 1 | 16 | Mean Difference (IV, Random, 95% CI) | 0.30 [‐0.63, 1.23] |
| 12 Adverse effects: other adverse effects (general or specific): mean CGI adverse effect scores (high = poor) Show forest plot | 1 | Mean Difference (IV, Random, 95% CI) | Subtotals only | |
| 12.1 Short term (6 weeks) | 1 | 22 | Mean Difference (IV, Random, 95% CI) | ‐0.10 [‐0.53, 0.33] |
| 13 Leaving the study early: acceptability of treatment ‐ as measured by completion of trial Show forest plot | 1 | Risk Ratio (M‐H, Random, 95% CI) | Subtotals only | |
| 13.1 Short term (6 weeks) | 1 | 24 | Risk Ratio (M‐H, Random, 95% CI) | 1.0 [0.07, 14.21] |
| 13.2 Medium term (26 weeks) | 1 | 24 | Risk Ratio (M‐H, Random, 95% CI) | 0.6 [0.18, 1.97] |
| 13.3 Long term (52 weeks) | 1 | 24 | Risk Ratio (M‐H, Random, 95% CI) | 1.6 [0.73, 3.49] |
| Outcome or subgroup title | No. of studies | No. of participants | Statistical method | Effect size |
| 1 Clinical response: 1a. no clinically significant response in mental state: PANSS reduction ≥ 50% Show forest plot | 1 | Risk Ratio (M‐H, Random, 95% CI) | Subtotals only | |
| 1.1 Medium term (12 weeks) | 1 | 63 | Risk Ratio (M‐H, Random, 95% CI) | 0.54 [0.35, 0.81] |
| 2 Clinical response: 1b. no clinically significant response in mental state: PANSS reduction ≥ 25% Show forest plot | 1 | Risk Ratio (M‐H, Random, 95% CI) | Subtotals only | |
| 2.1 Medium term (12 weeks) | 1 | 63 | Risk Ratio (M‐H, Random, 95% CI) | 0.65 [0.38, 1.10] |
| 3 Clinical response: 1. mean score/change global state: mean CGI‐S score (high = poor) Show forest plot | 1 | Mean Difference (IV, Random, 95% CI) | Subtotals only | |
| 3.1 Medium term (12 weeks) | 1 | 60 | Mean Difference (IV, Random, 95% CI) | ‐0.70 [‐1.18, ‐0.22] |
| 4 Clinical response: 2a. mean score/change mental state: mean PANSS total score (high = poor) Show forest plot | 1 | Mean Difference (IV, Random, 95% CI) | Subtotals only | |
| 4.1 Medium term (12 weeks) | 1 | 60 | Mean Difference (IV, Random, 95% CI) | ‐12.30 [‐22.43, ‐2.17] |
| 5 Clinical response: 2b. mean score/change in mental state (positive symptoms): mean PANSS positive score (high = poor) Show forest plot | 1 | Mean Difference (IV, Random, 95% CI) | Subtotals only | |
| 5.1 Medium term (12 weeks) | 1 | 60 | Mean Difference (IV, Random, 95% CI) | ‐3.10 [‐5.52, ‐0.68] |
| 6 Clinical response: 2b. mean score/change in mental state (negative symptoms): mean PANSS negative score (high = poor) Show forest plot | 1 | Mean Difference (IV, Random, 95% CI) | Subtotals only | |
| 6.1 Medium term (12 weeks) | 1 | 60 | Mean Difference (IV, Random, 95% CI) | 0.80 [‐1.99, 3.59] |
| 7 Adverse effects: specific adverse effects: mean score/change in extrapyramidal adverse effects: reported extrapyramidal adverse effects Show forest plot | 1 | Risk Ratio (M‐H, Random, 95% CI) | Subtotals only | |
| 7.1 Medium term (12 weeks) | 1 | 63 | Risk Ratio (M‐H, Random, 95% CI) | 2.06 [0.41, 10.47] |
| 8 Adverse effects: other adverse effects (general or specific): overall adverse effect rate Show forest plot | 1 | Risk Ratio (M‐H, Random, 95% CI) | Subtotals only | |
| 8.1 Medium term (12 weeks) | 1 | 63 | Risk Ratio (M‐H, Random, 95% CI) | 0.75 [0.50, 1.13] |
| 9 Adverse effects: other adverse effects (general or specific): agitation Show forest plot | 1 | Risk Ratio (M‐H, Random, 95% CI) | Subtotals only | |
| 9.1 Medium term (12 weeks) | 1 | 63 | Risk Ratio (M‐H, Random, 95% CI) | 1.03 [0.15, 6.88] |
| 10 Adverse effects: other adverse effects (general or specific): constipation Show forest plot | 1 | Risk Ratio (M‐H, Random, 95% CI) | Subtotals only | |
| 10.1 Medium term (12 weeks) | 1 | 63 | Risk Ratio (M‐H, Random, 95% CI) | 0.15 [0.01, 2.74] |
| 11 Adverse effects: other adverse effects (general or specific): drowsiness Show forest plot | 1 | Risk Ratio (M‐H, Random, 95% CI) | Subtotals only | |
| 11.1 Medium term (12 weeks) | 1 | 63 | Risk Ratio (M‐H, Random, 95% CI) | 0.47 [0.18, 1.19] |
| 12 Adverse effects: other adverse effects (general or specific): dry mouth Show forest plot | 1 | Risk Ratio (M‐H, Random, 95% CI) | Subtotals only | |
| 12.1 Medium term (12 weeks) | 1 | 63 | Risk Ratio (M‐H, Random, 95% CI) | 0.17 [0.02, 1.35] |
| 13 Adverse effects: other adverse effects (general or specific): headache Show forest plot | 1 | Risk Ratio (M‐H, Random, 95% CI) | Subtotals only | |
| 13.1 Medium term (12 weeks) | 1 | 63 | Risk Ratio (M‐H, Random, 95% CI) | 1.03 [0.28, 3.77] |
| 14 Adverse effects: other adverse effects (general or specific): insomnia Show forest plot | 1 | Risk Ratio (M‐H, Random, 95% CI) | Subtotals only | |
| 14.1 Medium term (12 weeks) | 1 | 63 | Risk Ratio (M‐H, Random, 95% CI) | 0.69 [0.12, 3.84] |
| 15 Adverse effects: other adverse effects (general or specific): orthostatic hypotension Show forest plot | 1 | Risk Ratio (M‐H, Random, 95% CI) | Subtotals only | |
| 15.1 Medium term (12 weeks) | 1 | 63 | Risk Ratio (M‐H, Random, 95% CI) | 0.21 [0.01, 4.13] |
| 16 Adverse effects: other adverse effects (general or specific): tachycardia Show forest plot | 1 | Risk Ratio (M‐H, Random, 95% CI) | Subtotals only | |
| 16.1 Medium term (12 weeks) | 1 | 63 | Risk Ratio (M‐H, Random, 95% CI) | 0.69 [0.12, 3.84] |
| 17 Adverse effects: other adverse effects (general or specific): vertigo Show forest plot | 1 | Risk Ratio (M‐H, Random, 95% CI) | Subtotals only | |
| 17.1 Medium term (12 weeks) | 1 | 63 | Risk Ratio (M‐H, Random, 95% CI) | 0.21 [0.03, 1.67] |
| 18 Leaving the study early: acceptability of treatment ‐ as measured by completion of trial Show forest plot | 1 | Risk Ratio (M‐H, Fixed, 95% CI) | Subtotals only | |
| 18.1 Medium term (12 weeks) | 1 | 63 | Risk Ratio (M‐H, Fixed, 95% CI) | 0.52 [0.05, 5.41] |