Fármacos antipsicóticos para la dependencia de la cocaína
Información
- DOI:
- https://doi.org/10.1002/14651858.CD006306.pub3Copiar DOI

- Base de datos:
-
- Cochrane Database of Systematic Reviews
- Versión publicada:
-
- 19 marzo 2016see what's new
- Tipo:
-
- Intervention
- Etapa:
-
- Review
- Grupo Editorial Cochrane:
-
Grupo Cochrane de Alcohol y drogas
- Copyright:
-
- Copyright © 2016 The Cochrane Collaboration. Published by John Wiley & Sons, Ltd.
Cifras del artículo
Altmetric:
Citado por:
Autores
Contributions of authors
In the first version LA wrote the background, inspected search hits by reading titles and abstracts, assessed full texts for inclusion, extracted data, made the analysis, wrote the results section, drafted conclusions. SM assessed full texts for inclusion, extracted data, assessed risk of bias, made the analysis, wrote the results section, PP helped with suggestion in writing the background and wrote the discussion.
In the present update BII, SM extracted data, assessed risk of bias, performed the analysis and wrote the main text of the review. LA and PP supervised and wrote the Discussion and the conclusions.
Sources of support
Internal sources
-
Department of Epidemiology, ASL RM E, Italy.
-
European Monitoring Centre for Drugs and Drug Addictionof support, Portugal.
External sources
-
National Institute of Health, Italy.
Declarations of interest
Blanca I Indave: None known.
Silvia Minozzi: None known.
Pier Paolo Pani: None known.
Laura Amato: None known.
Acknowledgements
Blanca I Indave undertook this update as her trainee's project at the EMCDDA under supervision of Marica Ferri. We would like to thank Marica Ferri for her support in particular on the assessment of the quality of the studies.We would like to acknowledge the previous contributions of Marina Davoli who was a co‐author on previous versions and helped with liaison on discussion and results writing. We thank Zuzana Mitrova, the trial search co‐ordinator, for her help in performing the bibliographic searches and retrieving the articles for the review.
Version history
| Published | Title | Stage | Authors | Version |
| 2016 Mar 19 | Antipsychotic medications for cocaine dependence | Review | Blanca I Indave, Silvia Minozzi, Pier Paolo Pani, Laura Amato | |
| 2007 Jul 18 | Antipsychotic medications for cocaine dependence | Review | Laura Amato, Silvia Minozzi, Pier Paolo Pani, Marina Davoli | |
| 2007 Jan 24 | Antipsychotic medications for cocaine dependence | Protocol | Laura Amato, Silvia Minozzi, Pier Paolo Pani, Marina Davoli | |
Differences between protocol and review
We now excluded one study (Grabowski 2006), included in the previous version as an ongoing trial which met the inclusion criteria, due to a modification in the study protocol in 2007. The pharmacological intervention had been modified, substituting an antipsychotic drug (aripiprazol) with an antidepressant (citalopram), thus rendering it ineligible for this update. Another study included in the previous version (Berger 1996) was excluded from the update because the outcome did not comply with our inclusion criteria.
Meta‐analysis of continuous outcomes of the old studies of ASI, CGI‐O, HAM‐D and HAM‐A had to be redone for postintervention outcomes, because the previous type of analysis comparing before‐and‐after changes was incorrect.
Keywords
MeSH
Medical Subject Headings (MeSH) Keywords
- Antipsychotic Agents [*therapeutic use];
- Aripiprazole [therapeutic use];
- Benzodiazepines [therapeutic use];
- Cocaine‐Related Disorders [*drug therapy];
- Haloperidol [therapeutic use];
- Lamotrigine;
- Olanzapine;
- Patient Dropouts [statistics & numerical data];
- Quetiapine Fumarate [therapeutic use];
- Randomized Controlled Trials as Topic;
- Reserpine [therapeutic use];
- Risperidone [therapeutic use];
- Triazines [therapeutic use];
Medical Subject Headings Check Words
Humans;
PICO

Study flow diagram. Review update 2015.

Risk of bias graph: review authors' judgements about each risk of bias item presented as percentages across all included studies.

Risk of bias summary: review authors' judgements about each risk of bias item for each included study.

Comparison 1 Any antipsychotic versus placebo, Outcome 1 Dropouts.

Comparison 1 Any antipsychotic versus placebo, Outcome 2 Side effects.

Comparison 1 Any antipsychotic versus placebo, Outcome 3 Number of participants using cocaine during the treatment (as days/week by urine tests or self report).
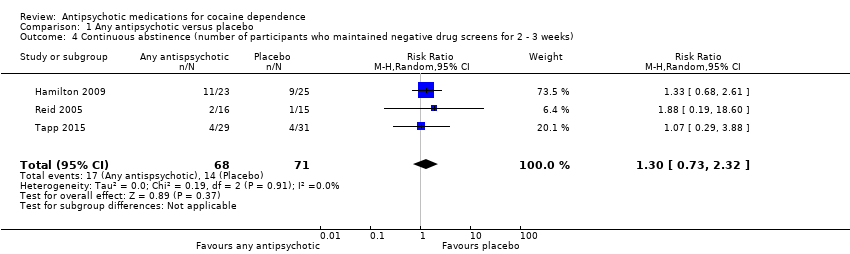
Comparison 1 Any antipsychotic versus placebo, Outcome 4 Continuous abstinence (number of participants who maintained negative drug screens for 2 ‐ 3 weeks).
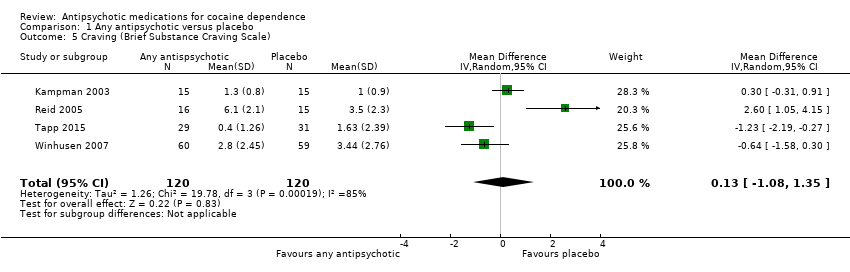
Comparison 1 Any antipsychotic versus placebo, Outcome 5 Craving (Brief Substance Craving Scale).
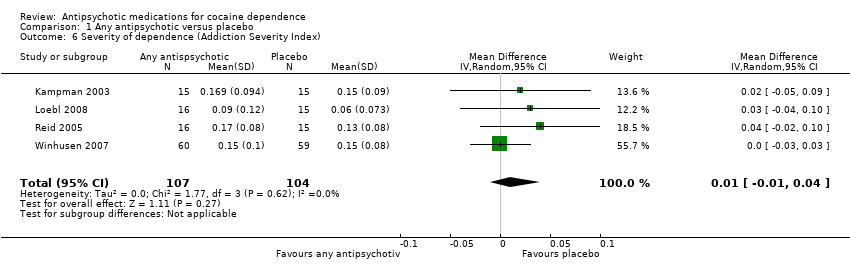
Comparison 1 Any antipsychotic versus placebo, Outcome 6 Severity of dependence (Addiction Severity Index).

Comparison 1 Any antipsychotic versus placebo, Outcome 7 Severity of dependence (Clinical Global Impression Scale).

Comparison 1 Any antipsychotic versus placebo, Outcome 8 Use of cocaine during the treatment (self‐reported as g/week).
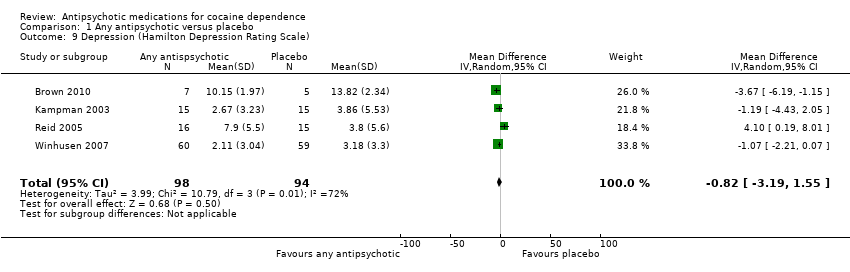
Comparison 1 Any antipsychotic versus placebo, Outcome 9 Depression (Hamilton Depression Rating Scale).

Comparison 2 Risperidone versus placebo, Outcome 1 Dropouts.

Comparison 2 Risperidone versus placebo, Outcome 2 Severity of dependence (Addiction Severity Index).
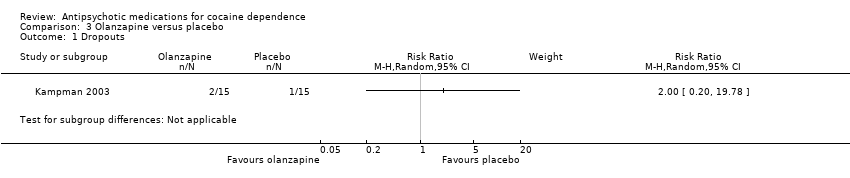
Comparison 3 Olanzapine versus placebo, Outcome 1 Dropouts.
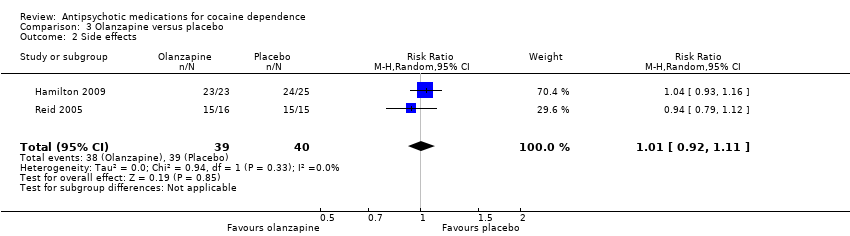
Comparison 3 Olanzapine versus placebo, Outcome 2 Side effects.

Comparison 3 Olanzapine versus placebo, Outcome 3 Use of cocaine during the treatment (self‐reported as days/week).
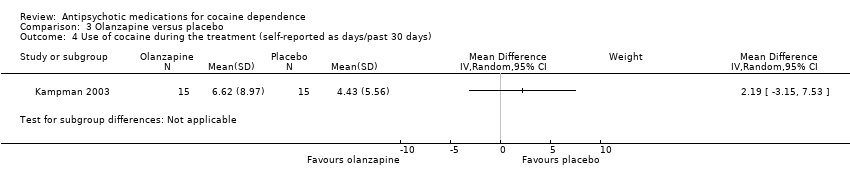
Comparison 3 Olanzapine versus placebo, Outcome 4 Use of cocaine during the treatment (self‐reported as days/past 30 days).

Comparison 3 Olanzapine versus placebo, Outcome 5 Continuous abstinence (participants who maintained negative drug screens throughout the treatment period ).

Comparison 3 Olanzapine versus placebo, Outcome 6 Craving (Brief Substance Craving Scale).
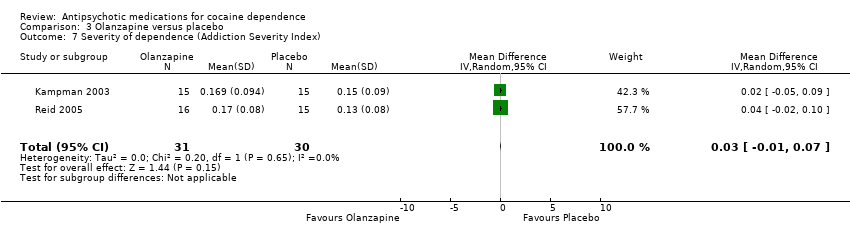
Comparison 3 Olanzapine versus placebo, Outcome 7 Severity of dependence (Addiction Severity Index).
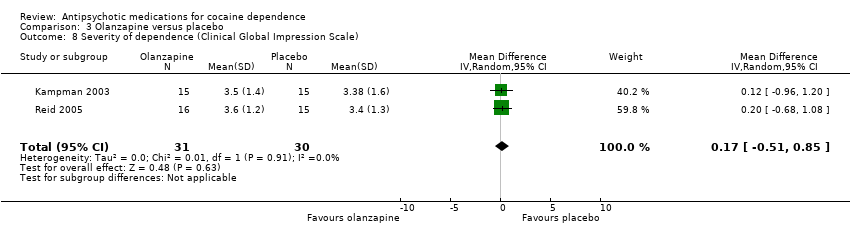
Comparison 3 Olanzapine versus placebo, Outcome 8 Severity of dependence (Clinical Global Impression Scale).

Comparison 3 Olanzapine versus placebo, Outcome 9 Amount of of cocaine use during the treatment (self‐reported as dollars spent/past 30 days).
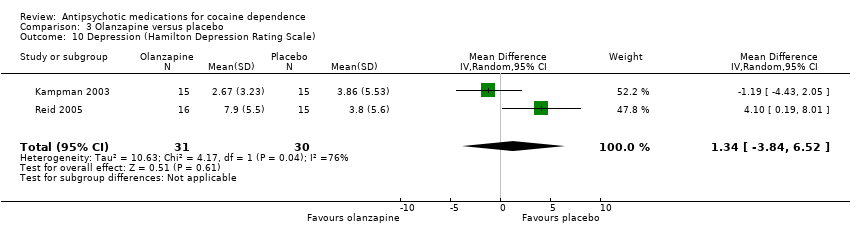
Comparison 3 Olanzapine versus placebo, Outcome 10 Depression (Hamilton Depression Rating Scale).
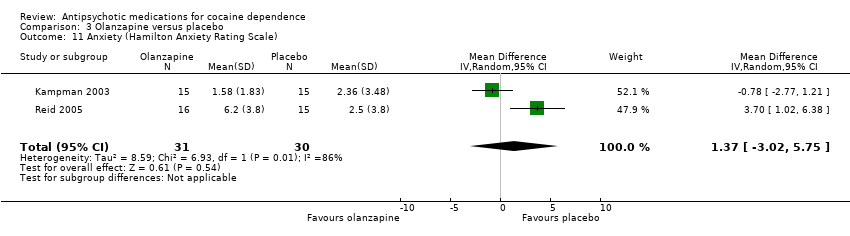
Comparison 3 Olanzapine versus placebo, Outcome 11 Anxiety (Hamilton Anxiety Rating Scale).

Comparison 3 Olanzapine versus placebo, Outcome 12 Withdrawal symptoms (Cocaine Selective Severity Assessment).
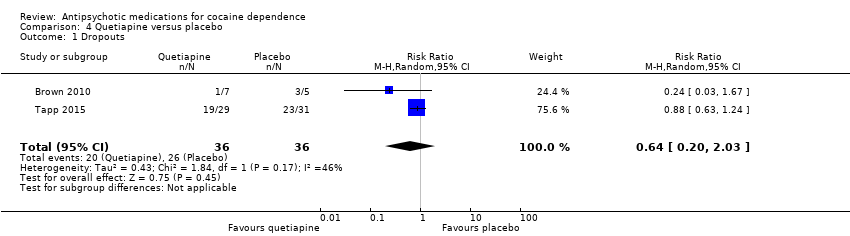
Comparison 4 Quetiapine versus placebo, Outcome 1 Dropouts.

Comparison 4 Quetiapine versus placebo, Outcome 2 Side effects.

Comparison 4 Quetiapine versus placebo, Outcome 3 Use of cocaine during the treatment (self‐reported as days/week).
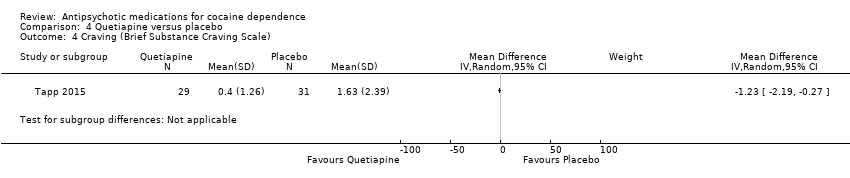
Comparison 4 Quetiapine versus placebo, Outcome 4 Craving (Brief Substance Craving Scale).

Comparison 4 Quetiapine versus placebo, Outcome 5 Amount of of cocaine use during the treatment (self‐reported as g/week).

Comparison 4 Quetiapine versus placebo, Outcome 6 Amount of of cocaine use during the treatment (self‐reported as dollars spent/week).
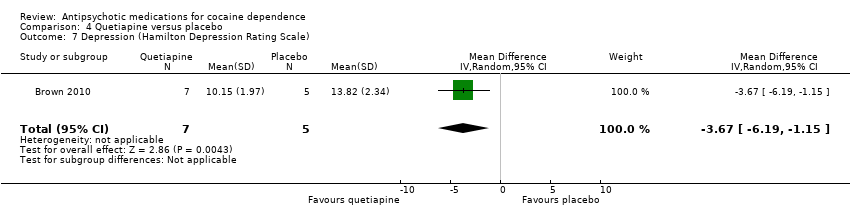
Comparison 4 Quetiapine versus placebo, Outcome 7 Depression (Hamilton Depression Rating Scale).
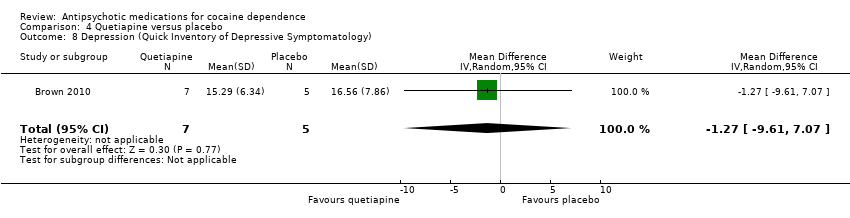
Comparison 4 Quetiapine versus placebo, Outcome 8 Depression (Quick Inventory of Depressive Symptomatology).
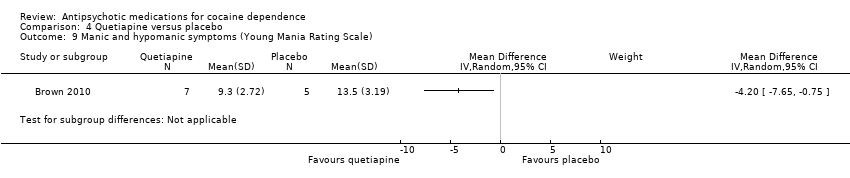
Comparison 4 Quetiapine versus placebo, Outcome 9 Manic and hypomanic symptoms (Young Mania Rating Scale).

Comparison 5 Lamotrigine versus placebo, Outcome 1 Side effects.

Comparison 6 Reserpine versus placebo, Outcome 1 Dropouts.

Comparison 6 Reserpine versus placebo, Outcome 2 Craving (Brief Substance Craving Scale).
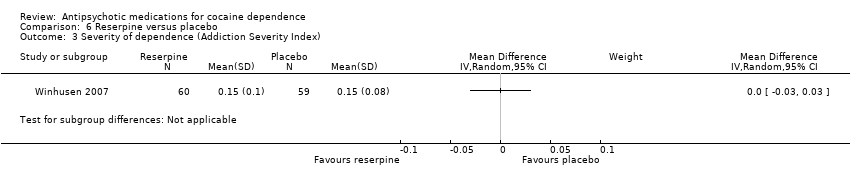
Comparison 6 Reserpine versus placebo, Outcome 3 Severity of dependence (Addiction Severity Index).

Comparison 6 Reserpine versus placebo, Outcome 4 Severity of dependence (Clinical Global Impression Scale).
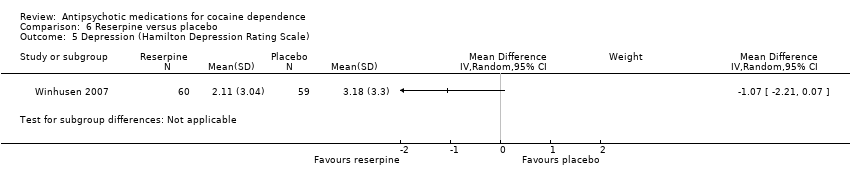
Comparison 6 Reserpine versus placebo, Outcome 5 Depression (Hamilton Depression Rating Scale).

Comparison 7 Olanzapine versus haloperidol, Outcome 1 Dropouts.

Comparison 7 Olanzapine versus haloperidol, Outcome 2 Psychopathology (Positive and Negative Syndrome Scale).
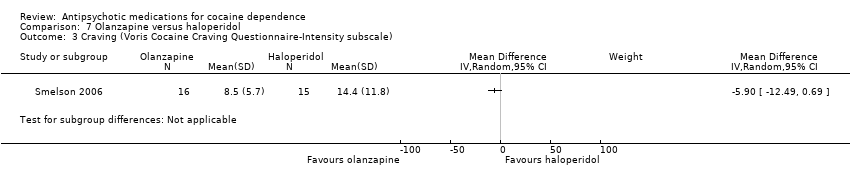
Comparison 7 Olanzapine versus haloperidol, Outcome 3 Craving (Voris Cocaine Craving Questionnaire‐Intensity subscale).
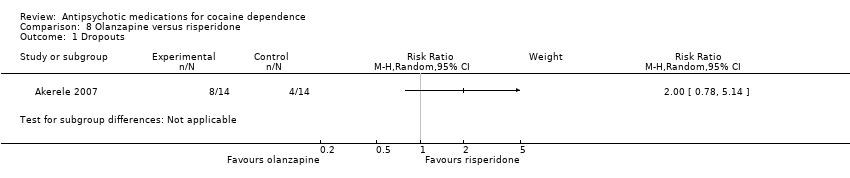
Comparison 8 Olanzapine versus risperidone, Outcome 1 Dropouts.
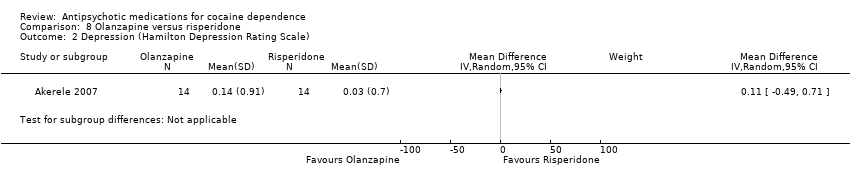
Comparison 8 Olanzapine versus risperidone, Outcome 2 Depression (Hamilton Depression Rating Scale).

Comparison 9 Aripiprazol versus ropinirol, Outcome 1 Dropouts.
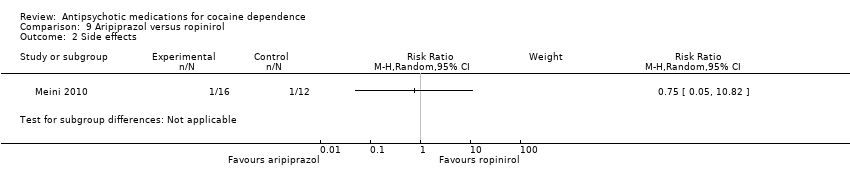
Comparison 9 Aripiprazol versus ropinirol, Outcome 2 Side effects.
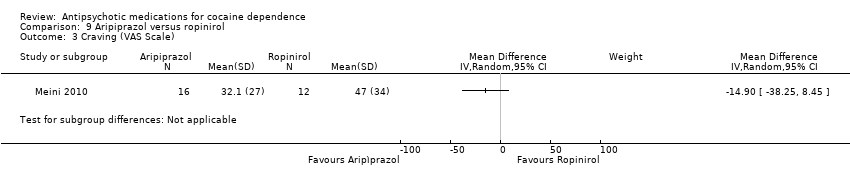
Comparison 9 Aripiprazol versus ropinirol, Outcome 3 Craving (VAS Scale).

Comparison 9 Aripiprazol versus ropinirol, Outcome 4 Severity of dependence (Clinical Global Impression Scale).
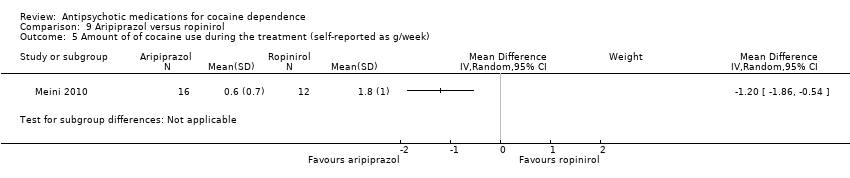
Comparison 9 Aripiprazol versus ropinirol, Outcome 5 Amount of of cocaine use during the treatment (self‐reported as g/week).
| Any antipsychotic versus placebo for cocaine dependence | ||||||
| Patient or population: people with cocaine dependence | ||||||
| Outcomes | Illustrative comparative risks* (95% CI) | Relative effect | No of Participants | Quality of the evidence | Comments | |
| Assumed risk | Corresponding risk | |||||
| Control | Any antipsychotic versus placebo | |||||
| Dropouts | Study population | RR 0.75 | 397 | ⊕⊕⊕⊝ | ||
| 547 per 1000 | 411 per 1000 | |||||
| Moderate | ||||||
| 500 per 1000 | 375 per 1000 | |||||
| Side effects | Study population | RR 1.01 | 291 | ⊕⊕⊝⊝ | ||
| 497 per 1000 | 502 per 1000 | |||||
| Moderate | ||||||
| 465 per 1000 | 470 per 1000 | |||||
| Number of participants using cocaine during the treatment (as days/week by urine tests or self report) | Study population | RR 1.02 | 91 | ⊕⊕⊝⊝ | ||
| 478 per 1000 | 488 per 1000 | |||||
| Moderate | ||||||
| 596 per 1000 | 608 per 1000 | |||||
| Continuous abstinence (number of participants who maintained negative drug screens for 2 ‐ 3 weeks) | Study population | RR 1.30 | 139 | ⊕⊕⊝⊝ | ||
| 197 per 1000 | 256 per 1000 | |||||
| Moderate | ||||||
| 129 per 1000 | 168 per 1000 | |||||
| Craving (Brief Substance Craving Scale) | The mean craving (brief substance craving scale) in the control groups was | The mean craving (Brief Substance Craving Scale) in the intervention groups was | 240 | ⊕⊕⊝⊝ | ||
| *The basis for the assumed risk (e.g. the median control group risk across studies) is provided in footnotes. The corresponding risk (and its 95% confidence interval) is based on the assumed risk in the comparison group and the relative effect of the intervention (and its 95% CI). | ||||||
| GRADE Working Group grades of evidence | ||||||
| 1All the studies were at unclear risk of selection bias. | ||||||
| Outcome or subgroup title | No. of studies | No. of participants | Statistical method | Effect size |
| 1 Dropouts Show forest plot | 8 | 397 | Risk Ratio (M‐H, Random, 95% CI) | 0.75 [0.57, 0.97] |
| 2 Side effects Show forest plot | 6 | 291 | Risk Ratio (M‐H, Random, 95% CI) | 1.01 [0.93, 1.10] |
| 3 Number of participants using cocaine during the treatment (as days/week by urine tests or self report) Show forest plot | 2 | 91 | Risk Ratio (M‐H, Random, 95% CI) | 1.02 [0.65, 1.62] |
| 4 Continuous abstinence (number of participants who maintained negative drug screens for 2 ‐ 3 weeks) Show forest plot | 3 | 139 | Risk Ratio (M‐H, Random, 95% CI) | 1.30 [0.73, 2.32] |
| 5 Craving (Brief Substance Craving Scale) Show forest plot | 4 | 240 | Mean Difference (IV, Random, 95% CI) | 0.13 [‐1.08, 1.35] |
| 6 Severity of dependence (Addiction Severity Index) Show forest plot | 4 | 211 | Mean Difference (IV, Random, 95% CI) | 0.01 [‐0.01, 0.04] |
| 7 Severity of dependence (Clinical Global Impression Scale) Show forest plot | 3 | 180 | Mean Difference (IV, Random, 95% CI) | 0.01 [‐0.38, 0.39] |
| 8 Use of cocaine during the treatment (self‐reported as g/week) Show forest plot | 2 | 72 | Mean Difference (IV, Random, 95% CI) | ‐0.54 [‐0.92, ‐0.16] |
| 9 Depression (Hamilton Depression Rating Scale) Show forest plot | 4 | 192 | Mean Difference (IV, Random, 95% CI) | ‐0.82 [‐3.19, 1.55] |
| Outcome or subgroup title | No. of studies | No. of participants | Statistical method | Effect size |
| 1 Dropouts Show forest plot | 4 | 176 | Risk Ratio (M‐H, Random, 95% CI) | 0.81 [0.63, 1.04] |
| 2 Severity of dependence (Addiction Severity Index) Show forest plot | 1 | 31 | Mean Difference (IV, Random, 95% CI) | 0.03 [‐0.04, 0.10] |
| Outcome or subgroup title | No. of studies | No. of participants | Statistical method | Effect size |
| 1 Dropouts Show forest plot | 1 | Risk Ratio (M‐H, Random, 95% CI) | Subtotals only | |
| 2 Side effects Show forest plot | 2 | 79 | Risk Ratio (M‐H, Random, 95% CI) | 1.01 [0.92, 1.11] |
| 3 Use of cocaine during the treatment (self‐reported as days/week) Show forest plot | 1 | Mean Difference (IV, Random, 95% CI) | Subtotals only | |
| 4 Use of cocaine during the treatment (self‐reported as days/past 30 days) Show forest plot | 1 | Mean Difference (IV, Random, 95% CI) | Subtotals only | |
| 5 Continuous abstinence (participants who maintained negative drug screens throughout the treatment period ) Show forest plot | 2 | 79 | Risk Ratio (M‐H, Random, 95% CI) | 1.37 [0.71, 2.61] |
| 6 Craving (Brief Substance Craving Scale) Show forest plot | 2 | 61 | Mean Difference (IV, Random, 95% CI) | 1.33 [‐0.91, 3.58] |
| 7 Severity of dependence (Addiction Severity Index) Show forest plot | 2 | 61 | Mean Difference (IV, Random, 95% CI) | 0.03 [‐0.01, 0.07] |
| 8 Severity of dependence (Clinical Global Impression Scale) Show forest plot | 2 | 61 | Mean Difference (IV, Random, 95% CI) | 0.17 [‐0.51, 0.85] |
| 9 Amount of of cocaine use during the treatment (self‐reported as dollars spent/past 30 days) Show forest plot | 1 | Mean Difference (IV, Random, 95% CI) | Subtotals only | |
| 10 Depression (Hamilton Depression Rating Scale) Show forest plot | 2 | 61 | Mean Difference (IV, Random, 95% CI) | 1.34 [‐3.84, 6.52] |
| 11 Anxiety (Hamilton Anxiety Rating Scale) Show forest plot | 2 | 61 | Mean Difference (IV, Random, 95% CI) | 1.37 [‐3.02, 5.75] |
| 12 Withdrawal symptoms (Cocaine Selective Severity Assessment) Show forest plot | 1 | Mean Difference (IV, Random, 95% CI) | Subtotals only | |
| Outcome or subgroup title | No. of studies | No. of participants | Statistical method | Effect size |
| 1 Dropouts Show forest plot | 2 | 72 | Risk Ratio (M‐H, Random, 95% CI) | 0.64 [0.20, 2.03] |
| 2 Side effects Show forest plot | 2 | 72 | Risk Ratio (M‐H, Random, 95% CI) | 0.99 [0.77, 1.27] |
| 3 Use of cocaine during the treatment (self‐reported as days/week) Show forest plot | 1 | Mean Difference (IV, Random, 95% CI) | Subtotals only | |
| 4 Craving (Brief Substance Craving Scale) Show forest plot | 1 | Mean Difference (IV, Random, 95% CI) | Subtotals only | |
| 5 Amount of of cocaine use during the treatment (self‐reported as g/week) Show forest plot | 2 | 72 | Mean Difference (IV, Random, 95% CI) | ‐0.54 [‐0.92, ‐0.16] |
| 6 Amount of of cocaine use during the treatment (self‐reported as dollars spent/week) Show forest plot | 1 | Mean Difference (IV, Random, 95% CI) | Subtotals only | |
| 7 Depression (Hamilton Depression Rating Scale) Show forest plot | 1 | 12 | Mean Difference (IV, Random, 95% CI) | ‐3.67 [‐6.19, ‐1.15] |
| 8 Depression (Quick Inventory of Depressive Symptomatology) Show forest plot | 1 | 12 | Mean Difference (IV, Random, 95% CI) | ‐1.27 [‐9.61, 7.07] |
| 9 Manic and hypomanic symptoms (Young Mania Rating Scale) Show forest plot | 1 | Mean Difference (IV, Random, 95% CI) | Subtotals only | |
| Outcome or subgroup title | No. of studies | No. of participants | Statistical method | Effect size |
| 1 Side effects Show forest plot | 1 | Risk Ratio (M‐H, Random, 95% CI) | Subtotals only | |
| Outcome or subgroup title | No. of studies | No. of participants | Statistical method | Effect size |
| 1 Dropouts Show forest plot | 1 | Risk Ratio (M‐H, Random, 95% CI) | Subtotals only | |
| 2 Craving (Brief Substance Craving Scale) Show forest plot | 1 | Mean Difference (IV, Random, 95% CI) | Subtotals only | |
| 3 Severity of dependence (Addiction Severity Index) Show forest plot | 1 | Mean Difference (IV, Random, 95% CI) | Subtotals only | |
| 4 Severity of dependence (Clinical Global Impression Scale) Show forest plot | 1 | Mean Difference (IV, Random, 95% CI) | Subtotals only | |
| 5 Depression (Hamilton Depression Rating Scale) Show forest plot | 1 | Mean Difference (IV, Random, 95% CI) | Subtotals only | |
| Outcome or subgroup title | No. of studies | No. of participants | Statistical method | Effect size |
| 1 Dropouts Show forest plot | 1 | Risk Ratio (M‐H, Random, 95% CI) | Subtotals only | |
| 2 Psychopathology (Positive and Negative Syndrome Scale) Show forest plot | 1 | Mean Difference (IV, Random, 95% CI) | Subtotals only | |
| 3 Craving (Voris Cocaine Craving Questionnaire‐Intensity subscale) Show forest plot | 1 | Mean Difference (IV, Random, 95% CI) | Subtotals only | |
| Outcome or subgroup title | No. of studies | No. of participants | Statistical method | Effect size |
| 1 Dropouts Show forest plot | 1 | Risk Ratio (M‐H, Random, 95% CI) | Subtotals only | |
| 2 Depression (Hamilton Depression Rating Scale) Show forest plot | 1 | Mean Difference (IV, Random, 95% CI) | Subtotals only | |
| Outcome or subgroup title | No. of studies | No. of participants | Statistical method | Effect size |
| 1 Dropouts Show forest plot | 1 | Risk Ratio (M‐H, Random, 95% CI) | Subtotals only | |
| 2 Side effects Show forest plot | 1 | Risk Ratio (M‐H, Random, 95% CI) | Subtotals only | |
| 3 Craving (VAS Scale) Show forest plot | 1 | Mean Difference (IV, Random, 95% CI) | Subtotals only | |
| 4 Severity of dependence (Clinical Global Impression Scale) Show forest plot | 1 | Mean Difference (IV, Random, 95% CI) | Subtotals only | |
| 5 Amount of of cocaine use during the treatment (self‐reported as g/week) Show forest plot | 1 | Mean Difference (IV, Random, 95% CI) | Subtotals only | |