Ubat‐ubatan antipsikotik untuk ketergantungan kokain
Abstract
Background
Cocaine dependence is a public health problem characterised by recidivism and a host of medical and psychosocial complications. Cocaine dependence remains a disorder for which no pharmacological treatment of proven efficacy exists.
Objectives
To evaluate the efficacy and the acceptability of antipsychotic medications for cocaine dependence.
Search methods
This review is an update of a previous Cochrane review published in 2007. We searched up to 15 July 2015 in Cochrane Drugs and Alcohol Group Specialised Register (searched in CRSLive); the Cochrane Library (including the Cochrane Central Register of Controlled Trials (CENTRAL); the Database of Abstracts of Reviews of Effects (DARE)); PubMed; EMBASE; CINAHL and Web of Science. All searches included non‐English language literature.
Selection criteria
All randomised controlled trials and controlled clinical trials with focus on the use of any antipsychotic medication for the treatment of cocaine dependence.
Data collection and analysis
We used standard methodological procedures expected by Cochrane.
Main results
We included 14 studies (719 participants). The antipsychotic drugs studied were risperidone, olanzapine, quetiapine, lamotrigine, aripiprazol, haloperidol and reserpine. Comparing any antipsychotic drugs versus placebo, we found that antipsychotics reduced dropout: eight studies, 397 participants, risk ratio (RR) 0.75 (95% confidence interval (CI) 0.57 to 0.97), moderate quality of evidence. We found no significant differences for any of the other primary outcomes considered: number of participants using cocaine during the treatment, two studies, 91 participants: RR 1.02 (95% CI 0.65 to 1.62); continuous abstinence, three studies, 139 participants: RR 1.30 (95% CI 0.73 to 2.32); side effects, six studies, 291 participants: RR 1.01 (95% CI 0.93 to 1.10); and craving, four studies, 240 participants: RR 0.13 (‐1.08 to 1.35). For all of these comparisons we rated the quality of evidence as low.
Comparisons of single drug versus placebo or versus another drug are conducted in few trials with small sample sizes, limiting the reliability of the results. Among these comparisons, only quetiapine seemed to outperform placebo in reducing cocaine use, measured by grams per week: mean difference (MD) ‐0.54 (95% CI ‐0.92 to ‐0.16), by US dollars spent per week: MD ‐53.80 (95% CI ‐97.85 to ‐9.75), and by craving: MD ‐1.23 (95% CI ‐2.19 to ‐0.27), but results came from one study with 60 participants.
The major limitations of the studies were the high risk of attrition bias (40% of the included studies) and low quality of reporting, mainly for the risk of selection bias, performance and detection bias, that we rated as being at unclear risk for 75% to 80% of the studies. Furthermore, most of the included studies did not report results on important outcomes such as side effects, or use of cocaine during treatment and craving, which prevented the possibility of including them in statistical synthesis.
Authors' conclusions
At present, there is no evidence supporting the clinical use of antipsychotic medications in the treatment of cocaine dependence, although results come from only 14 trials, with small sample sizes and moderate to low quality of evidence.
PICO
Ringkasan bahasa mudah
Ubat‐ubatan antipsikotik untuk ketergantungan kokain
Latar belakang
Ketergantungan kokain sering dikaitkan dengan masalah perubatan, psikologi dan sosial kepada kesihatan individu dan awam serta menjanakan masalah kepada komuniti. Pengguna kokain memainkan peranan dalam penyebaran penyakit berjangkit seperti AIDS, hepatitis dan batuk kering, dan juga dalam jenayah, keganasan dan pendedahan ubat neonatal. Penggunaan ubat‐ubatan seperti antidepresan, anticonvulsants dan agonis dopamin untuk merawat penyalahgunaan kokain atau ketergantungan adalah tidak disokong oleh bukti daripada ulasan Cochrane. Penggunaan agen antipsikotik juga telah dipertimbangkan, terutamanya kerana kokain boleh menyebabkan halusinasi dan paranoia yang menyerupai psikosis.
Ciri‐ciri kajian
Penulis‐penulis ulasan telah mengenal pasti 14 kajian rawak terkawal yang melibatkan 719 orang dewasa. Salah satu kajian telah dijalankan di Itali, malah yang lain dijalankan di Amerika Syarikat. Kajian‐kajian tersebut melibatkan tetapan pesakit dalam dan pesakit luar, dan mempunyai tempoh 14 hingga 168 hari (purata 80 hari). Peserta daripada sebelas kajian rawak telah menerima ubat antipsikotik atau plasebo dengan ubat‐ubatan antipsikotik berikut: risperidone (tiga kajian, 1 hingga 4 mg/hari dan satu kajian dengan suntikan jangka bertindak risperidone dengan dos 25 mg/14 hari); olanzapine (tiga kajian, 2.5 hingga 20 mg/hari); quetiapine (dua kajian, 400 dan 800 mg/hari); lamotrigine (satu kajian, 400 mg/hari); reserpine (satu kajian, 50 mg/hari). Tiga kajian telah berbandingkan dua ubat; olanzapine (10 mg/hari) berbanding haloperidol (10 mg/hari), olanzapine (20 mg/hari) berbanding risperidone (9 mg/hari) dan aripiprazol (10 ml/hari) berbanding ropirinol (4.5 mg/hari).
Keputusan utama
Kajian‐kajian telah menggunakan instrumen atau cara yang berbeza untuk menilai hasil yang berkenaan, dengan itu, menghadkan kemungkinan kami untuk menggabungkan data. Semasa kami mengumpulkan semua keputusan kajian yang membandingkan ubat antipsychotic dengan plasebo, kami mendapati bahawa antipsikotik hanya meningkatkan sedikit golongan yang sedang mengikuti rawatan tetapi tidak berkesan dalam mengurangkan penggunaan kokain semasa rawatan (dua kajian), dalam tempoh menahan diri daripada penggunaan kokain (tiga kajian), atau dalam mengurangkan keinginan untuk menggunakan kokain (empat kajian). Perbandingan dengan hanya satu ubat dengan plasebo atau perbanding dengan ubat yang lain telah dijalankan dalam beberapa kajian dengan saiz sampel yang kecil. Ini telah menghadkan kebolehpercayaan keputusan yang diperolehi. Namun, antara perbandingan ini, hanya quetiapine sahaja yang dapat mengurangkan penggunaan kokain dan keinginan lebih baik daripada plasebo, tetapi keputusan hanya didapati daripada satu kajian yang melibatkan 60 peserta. Maklumat adalah terhad mengenai kebolehterimaan rawatan dari segi kesan sampingan, menahan diri daripada penggunaan kokain dan simptom putus kokain. Secara keseluruhan kami mendapati bahawa tiada bukti yang menyokong penggunaan klinikal ubat‐ubatan antipsychotic dalam rawatan ketergantungan kokain.
Kualiti bukti
Batasan utama kajian‐kajian ini adalah bilangan orang yang tinggi telah menarik diri dan kekurangan laporan yang jelas mengenai kaedah yang digunakan semasa menjalankan kajian. Selain itu, bilangan peserta adalah kecil, dan cara‐cara yang berbeza telah digunakan untuk mengukur dan melaporkan keputusan, mengehadkan kemungkinan bagi kami untuk menggabungkan data. Secara keseluruhan kami menilai kualiti bukti sebagai sederhana bagi keciciran dan rendah bagi semua hasil lain yang dipertimbangkan. Bukti ini adalah terkini sehingga 15 Julai 2015.
Pembiayaan dan konflik kepentingan yang dilaporkan oleh kajian
Majoriti kajian yang termasuk dalam ulasan ini mendapat pembiayaan daripada sumber industri atau diisytiharkan percanggahan kepentingan untuk beberapa penyelidik kerana kerjasama kontrak yang berbeza dengan industri farmaseutikal. Hanya lima daripada 14 kajian yang termasuk melaporkan bahawa mereka dibiayai secara eksklusif oleh sumber bukan industri, dan daripada jumlah itu hanya satu (Grabowski 2004) menyatakan tiada sebarang konflik kepentingan untuk penulis. Satu lagi kajian (Brown 2012) melaporkan konflik kepentingan untuk beberapa penulis dan tiga kajian (Levin 1999, Reid 2005 dan Winhusen 2007) tidak mendedahkan konflik kepentingan penulis. Satu kajian (Meini 2010) tidak melaporkan maklumat mengenai sumber pembiayaan, tetapi menyatakan bahawa tiada sebarang konflik kepentingan untuk penulis‐penulis. Lapan kajian lain yang termasuk dalam ulasan ini telah dibiayai sama ada oleh industri (Brown 2010; Hamilton 2009; Kampman 2003), atau kombinasi geran industri dan bukan‐industri (Akerele 2007; Loebl 2008; Smelson 2004; Smelson 2006; Tapp 2015), dengan tiga kajian(Brown 2010; Hamilton 2009; Kampman 2003) mendedahkan konflik kepentingan untuk penulis, dan selebihnya tanpa deklarasi mengenai isu ini.
Authors' conclusions
Summary of findings
| Any antipsychotic versus placebo for cocaine dependence | ||||||
| Patient or population: people with cocaine dependence | ||||||
| Outcomes | Illustrative comparative risks* (95% CI) | Relative effect | No of Participants | Quality of the evidence | Comments | |
| Assumed risk | Corresponding risk | |||||
| Control | Any antipsychotic versus placebo | |||||
| Dropouts | Study population | RR 0.75 | 397 | ⊕⊕⊕⊝ | ||
| 547 per 1000 | 411 per 1000 | |||||
| Moderate | ||||||
| 500 per 1000 | 375 per 1000 | |||||
| Side effects | Study population | RR 1.01 | 291 | ⊕⊕⊝⊝ | ||
| 497 per 1000 | 502 per 1000 | |||||
| Moderate | ||||||
| 465 per 1000 | 470 per 1000 | |||||
| Number of participants using cocaine during the treatment (as days/week by urine tests or self report) | Study population | RR 1.02 | 91 | ⊕⊕⊝⊝ | ||
| 478 per 1000 | 488 per 1000 | |||||
| Moderate | ||||||
| 596 per 1000 | 608 per 1000 | |||||
| Continuous abstinence (number of participants who maintained negative drug screens for 2 ‐ 3 weeks) | Study population | RR 1.30 | 139 | ⊕⊕⊝⊝ | ||
| 197 per 1000 | 256 per 1000 | |||||
| Moderate | ||||||
| 129 per 1000 | 168 per 1000 | |||||
| Craving (Brief Substance Craving Scale) | The mean craving (brief substance craving scale) in the control groups was | The mean craving (Brief Substance Craving Scale) in the intervention groups was | 240 | ⊕⊕⊝⊝ | ||
| *The basis for the assumed risk (e.g. the median control group risk across studies) is provided in footnotes. The corresponding risk (and its 95% confidence interval) is based on the assumed risk in the comparison group and the relative effect of the intervention (and its 95% CI). | ||||||
| GRADE Working Group grades of evidence | ||||||
| 1All the studies were at unclear risk of selection bias. | ||||||
Background
Description of the condition
Cocaine is an alkaloid derived from the coca leaf, being commonly used as powder, for intranasal or intravenous use, or as crack, a free‐base form which is normally smoked. Cocaine dependence is a major public health problem, characterised by recidivism and a host of medical and psychosocial complications (EMCDDA 2014a).
There is a wide and well‐documented range of consequences associated with acute and chronic use of this drug, such as medical, psychological and social problems, including the spread of infectious diseases (e.g. AIDS, hepatitis and tuberculosis), criminal behaviour, violence and neonatal drug exposure (Higgins 1994). Both injection and non‐injection cocaine use are thought to increase the risk of HIV infection through high‐risk injecting and sexual behaviours (Sorensen 1991).
The illicit use of cocaine has become a persistent health problem worldwide. According to the estimates of the World Drug Report 2015 (UNDOC 2015) about 0.4 % of the global population uses cocaine, and in recent European national population surveys between 0.3% and 9% of the adult population report having tried cocaine at least once (i.e. lifetime prevalence), with Ireland (6.8%), Spain (8.8%) and the United Kingdom (9%) being at the upper end of this range. Recent cocaine use (last 12 months) is, in general, reported by less than 1% of adults; in most countries, the range is between 0.1% and 1%. After a peak in 2008, a decline in cocaine use has been observed in almost all countries, including those reporting high prevalence rates. In Spain and the United Kingdom recent prevalence rates are still around 2%. Although cocaine prevalence figures are much lower than comparable figures for cannabis, levels of use among younger adults can be higher than the population average. Lifetime experience among 15‐ to 34‐year‐olds ranges from 0.7% to 11.9%, with the highest levels again being found in Spain (11.1%) and the United Kingdom (11.9%). Recent use ranges from 0.2% to 3.6%, with Denmark, Italy and the Netherlands all having rates of about 2%; Spain and the United Kingdom over 3% and 3.6% respectively (EMCDDA 2014b). In the USA in 2013, an estimated 1.5 million people (0.6%) were current cocaine users (NSDUH 2014).The number of people entering treatment for the first time in their life for primary cocaine use has been decreasing in recent years in countries with traditionally high prevalence, from a peak of 38,000 in 2008 to 24,000 in 2013 (EMCDDA 2015). Differences exist between countries, with more than 70% of all cocaine users being reported by only three European countries: Spain, Italy, and the United Kingdom (EMCDDA 2015).
Description of the intervention
Although effective pharmacotherapy is available for alcohol and heroin dependence (Amato 2010; Faggiano 2003; Mattick 2014; Minozzi 2010; O'Brian 2001), none exists currently for cocaine dependence despite more than two decades of clinical trials primarily involving antidepressant, anticonvulsant and dopaminergic medications.
Cocaine effect seems to rely on its ability to increase the availability of monoamines (dopamine, serotonin and noradrenaline) in the brain. The dopamine increase in specific areas of the mesolimbic system, which is shared by cocaine with other drugs like heroin, alcohol, cannabis and nicotine, has been involved in rewarding effect of drugs and self‐administration behaviour in animals and humans (Di Chiara 1988; Drevets 1999; Drevets 2001; Volkow 2003).
There has been extensive research of optimal pharmacological approaches to the treatment of cocaine dependence, with consideration of both dopamine antagonists and agonists (Grabowski 1997; Kosten 1996).
Four Cochrane reviews have been published on the efficacy of antidepressants (Pani 2011), carbamazepine (Lima Reisser 2009), dopamine agonists (Minozzi 2015) and psychostimulants (Castells 2010) for the treatment of cocaine dependence, but none of them found clear support for the efficacy of these treatments.
Cocaine dependence remains a disorder for which no pharmacological treatment of proven efficacy exists, although considerable advances in the neurobiology of this addiction could guide future medication development.
How the intervention might work
Antipsychotics have been candidates for the treatment of addiction for their ability to block dopamine receptors and counterbalance the increase in dopaminergic activity related to drugs' effects. However, while the short‐term effect of cocaine is associated with dopamine increase in definite brain areas, acute and protracted withdrawal from this drug is associated with diminished dopaminergic neurotransmission. This reduced dopaminergic tone may underlie impaired hedonic function and increased craving, so maintaining the addictive behaviour (Dackis 2002; Kuhar 1996). On this basis, the supposed efficacy of dopamine antagonists in cocaine addiction could be questionable, since their use could even further reduce dopamine tone.
While these observations apply well to classical neuroleptics, which exert their action essentially through the dopaminergic system, the so‐called 'atypical' ones, like risperidone and olanzapine, extend their action to other brain systems which have been involved in drug addiction. Particularly, their action on the serotoninergic system has been regarded with interest, given the involvement of serotonin neurotransmission in addictive behaviour (Filip 2005). The use of atypical neuroleptics in cocaine addiction has also been criticised due to their antagonist effect on dopamine receptors. However, their interference with the serotoninergic system and a less severe side‐effect profile (Berk 1999; Leucht 1999) could improve the compliance of patients and promote their retention in treatment. These assumptions would support the use of atypical neuroleptics such as olanzapine and aripripazol in the treatment of cocaine addiction.
Furthermore, cocaine use can lead to symptoms mimicking psychosis, such as hallucinations and paranoia, and the use of antipsychotics may relieve these symptoms. Some of the antipsychotics more commonly studied for this purpose are, for example, haloperidol, olanzapine, quetiapine, clozapine, risperidone and lamotrigine.
Why it is important to do this review
This review is an update of the original Cochrane review (Amato 2007). The original version on the efficacy of antipsychotic agents for the treatment of cocaine dependence did not find evidence supporting the clinical use of antipsychotic medications in the treatment of cocaine dependence.
This update reviews the current state of scientific evidence for the efficacy of antipsychotic pharmacotherapy for the treatment of cocaine dependence.
Objectives
To evaluate the efficacy and the acceptability of antipsychotic medications for cocaine dependence.
Methods
Criteria for considering studies for this review
Types of studies
All randomised controlled trials and controlled clinical trials which focus on the use of any antipsychotic medication for cocaine dependence.
Types of participants
Cocaine‐dependent people as diagnosed by the Diagnostic and Statistical Manual of Mental Disorder (DSM‐IV‐R) or by specialists, since all trials have been performed prior to the publication of the DSM‐V Manual. Trials including participants with additional diagnoses of substance dependence were also eligible. We exclude trials in people under 18 years of age and in pregnant women, because of the substantially different approach to the clinical management of these people. People with comorbid mental health conditions were included and considered in a subgroup analysis.
Types of interventions
Experimental intervention:
-
Any antipsychotic medication, alone or in combination with any psychosocial intervention.
Control Intervention
-
Placebo
-
No intervention
-
Other pharmacological interventions
-
Any psychosocial intervention
Types of outcome measures
Primary outcomes
-
Dropouts from treatment, defined as the number of participants who did not complete the treatment
-
Acceptability of the treatment, defined as the number and type of side effects experienced during the treatment
-
Use of primary substance of abuse, defined as the number of participants that reported the use of cocaine during the treatment, and/or the number of participants with urine samples positive or negative for cocaine
-
Results at follow‐up, defined as the number of participants using cocaine at follow‐up
Secondary outcomes
-
Compliance
-
Craving as measured by validated scales, e.g. Brief Substance Craving Scale (BSCS), Visual Analogue Scale (VAS)
-
Severity of dependence as measured by validated scales, e.g. Addiction Severity Index (ASI), Clinical Global Impression scale (CGI‐S), Clinical Global Impression ‐ Observer Scale (CGI‐O)
-
Amount of cocaine use, as measured by grams used or money spent
-
Psychiatric symptoms/psychological distress, diagnosed using standard criteria, e.g. Diagnostic and Statistical Manual of Mental Disorders (DSM‐IV) criteria, or measured by validated scales, e.g. Hamilton Depression Scale (HAM‐D), Profile of Mood States Scale (POMSS), Positive and Negative Syndrome Scale (PANSS)
-
Withdrawal symptoms, measured using validated scales such as the Cocaine Selective Severity Assessment (CSSA)
Search methods for identification of studies
Electronic searches
We have listed the search methods we used in the original review (Amato 2007) in Appendix 1
For the update performed up to 15 July 2015, we searched the following databases:
-
Cochrane Drugs and Alcohol Group (CDAG) Specialised Register (searched July 2015) using the search strategy outlined in Appendix 2;
-
Cochrane Central Register of Controlled Trials (CENTRAL) (2015, Issue 7) using the search strategy outlined in Appendix 3;
-
MEDLINE (PubMed) (October 2006 to July 2015) using the search strategy outlined in Appendix 4;
-
EMBASE (Elsevier, EMBASE.com) (October 2006 to July 2015) using the search strategy outlined in Appendix 5;
-
CINAHL (EBSCO HOST) (October 2006 to July 2015)) using the search strategy outlined in Appendix 6;
-
Web of Science (Thomson Reuters) (January 2006 to January 2015) using the search strategy outlined in Appendix 7.
Searching other resources
We also searched:
-
The reference lists of all relevant papers to identify further studies
-
Some of the main electronic sources of ongoing trials (National Research Register, meta‐Register of Controlled Trials, ClinicalTrials.gov)
We contacted investigators to request information about unpublished or incomplete trials.
All searches included non‐English language literature, and we assessed studies with English abstracts for inclusion. We had studies translated where we considered that they were likely to meet the inclusion criteria.
Data collection and analysis
Selection of studies
For the first review, one review author (LA) inspected the search hits by reading titles and abstracts. We obtained each potentially relevant study located in the search in full text, and two review authors (SM, LA) independently assessed them for inclusion. We resolved disagreements by discussion between all the review authors.
For the present update, two review authors (BII, SM) inspected the search hits by reading titles and abstracts. We obtained each potentially relevant study located in the search in full text, and two review authors (BII, SM) independently assessed them for inclusion. We resolved disagreements by discussion between all the review authors.
Data extraction and management
Two review authors (SM, BII) independently extracted data . In case of missing data about declared outcomes in the full article, we also consulted the information reported in the Clinical Trials Registry of the US National Institutes of Health (ClinicalTrials.gov). We resolved any disagreement by discussion. We summarised key findings narratively in the first instance, and assessed them for meta‐analysis where possible.
We extracted the following data from the identified publications:
-
Year of publication
-
Country
-
Inclusion and exclusion criteria
-
Mean characteristics of participants (age, sex, other substances of abuse, comorbidity)
-
Experimental and control treatment
-
Outcomes assessed
-
Duration of the study
Assessment of risk of bias in included studies
Two review authors (BII, SM) independently assessed risk of bias of the included studies.
We conducted the 'Risk of bias' assessment using the criteria recommended by the Cochrane Handbook (Higgins 2011). The recommended approach for assessing risk of bias in studies included in Cochrane reviews is a two‐part tool, addressing specific domains, namely sequence generation and allocation concealment (selection bias), blinding of participants and providers (performance bias), blinding of outcome assessor (detection bias), incomplete outcome data (attrition bias) and selective outcome reporting (reporting bias). The first part of the tool involves describing what was reported to have happened in the study. The second part of the tool involves assigning a judgement related to the risk of bias for that entry, in terms of low, high or unclear risk. To make these judgements we used the criteria indicated by the Handbook, adapted to the addiction field. See Appendix 8 for details.
We addressed the domains of sequence generation and allocation concealment (avoidance of selection bias) in the tool by a single entry for each study.
We considered blinding of participants and of outcome assessors (avoidance of detection bias) separately for objective outcomes (e.g. dropouts, abstinence measured by urinanalysis, participants relapsed at the end of follow‐up) and for subjective outcomes (e.g. duration and severity of signs and symptoms of withdrawal, craving, participant self‐reported use of substances, side effects, psychiatric symptoms, clinical global evaluation).
We assessed incomplete outcome data (avoidance of attrition bias) for all outcomes except for the dropout rates from the treatment, which is very often the primary outcome measure in trials on addiction; see Characteristics of included studies for a detailed description of how we assessed the risks of bias in this review.
Grading of evidence
We assessed the overall quality of the evidence for the primary outcome using the GRADE system. The GRADE Working Group developed a system for grading the quality of evidence (GRADE 2004; Guyatt 2008; Guyatt 2011; Schünemann 2006) which takes into account issues not only related to internal validity but also to external validity, such as directness of results. The 'Summary of findings' tables present the main findings of a review in a transparent and simple tabular format. In particular, they provide key information concerning the quality of evidence, the magnitude of effect of the interventions examined and the sum of available data on the main outcomes.
The GRADE system uses the following criteria for assigning grades of evidence:
-
High: further research is very unlikely to change our confidence in the estimate of effect.
-
Moderate: further research is likely to have an important impact on our confidence in the estimate of effect and may change the estimate.
-
Low: further research is very likely to have an important impact on our confidence in the estimate of effect and is likely to change the estimate.
-
Very low: any estimate of effect is very uncertain.
Grading is decreased for the following reasons:
-
Serious (‐1) or very serious (‐2) limitation to study quality.
-
Important inconsistency (‐1).
-
Some (‐1) or major (‐2) uncertainty about directness.
-
Imprecise or sparse data (‐1).
-
High probability of reporting bias (‐1).
Grading is increased for the following reasons:
-
Strong evidence of association ‐ significant relative risk of > 2 (< 0.5) based on consistent evidence from two or more observational studies, with no plausible confounders (+1).
-
Very strong evidence of association ‐ significant relative risk of > 5 (< 0.2) based on direct evidence with no major threats to validity (+2).
-
Evidence of a dose‐response gradient (+1).
-
All plausible confounders would have reduced the effect (+1).
Measures of treatment effect
We analysed dichotomous outcomes by calculating the risk ratio (RR) for each trial with uncertainty in each result expressed by 95% confidence intervals (CIs). We analysed continuous outcomes by calculating the mean difference (MD) with a 95% CI when studies used the same instrument to assess the outcome. We used the standardised mean difference (SMD) when studies used different instruments. For craving score, severity of dependence (Drug ASI, CGI‐O, depression (HAM‐D) and anxiety (Hamilton Anxiety Scale (HAM‐A)), we compared the postintervention mean scores of the experimental and control groups. Meta‐analysis of continuous outcomes of the old studies of ASI, CGI‐O, HAM‐D and HAM‐A had to be redone for postintervention outcomes, because the previous type of analysis comparing before‐and‐after changes was incorrect.
Unit of analysis issues
We have not used data presented as the number of positive urine tests over the total number of tests in the experimental and control group as a measure of substance abuse. This is because using tests instead of the participants as the unit of analysis violates the hypothesis of independence among observations. In fact, the results of tests done in each participant are not independent.
If there had been cross‐over trials to include, we would have considered only the results of the first phase of the study.
Assessment of heterogeneity
We analysed heterogeneity by using the I² statistic and the Chi² test. Cut‐off points included an I² value greater than 50% and a P value for the Chi² test less than 0.1.
Assessment of reporting biases
We planned to use a funnel plot (plotting the effect from each study against the sample size or effect standard error) to assess the potential for bias related to the size of the trials, which could indicate possible publication bias. However this was not possible because less than ten trials were included in the analyses
Data synthesis
We combined outcomes from the individual trials through meta‐analysis when possible (comparability of interventions and outcomes between trials), using a random‐effects model, because we expected some degree of heterogeneity among trials.
Subgroup analysis and investigation of heterogeneity
We first compared any antipsychotic versus placebo. We then performed subgroup analyses for single types of antipsychotics.
Sensitivity analysis
To incorporate our assessment of risk of bias into the review process, we first plotted the intervention effect estimates stratified for risk of selection bias. If we had found differences in results among studies at different risks of bias, we planned to perform sensitivity analysis by excluding from the analysis those studies at high risk of bias. We did not conduct these analyses, because we found no studies at high risk of selection bias. Neither did we conduct sensitivity analysis excluding studies with inadequate allocation concealment, because only one of the included studies had inadequate allocation concealment, and it was not included in meta‐analysis
Results
Description of studies
Results of the search
In the original review (Amato 2007), the bibliographic searches identified 97 reports; we excluded 80 studies on the basis of title and abstract, and retrieved 17 articles in full text, 8 of which we excluded, two were awaiting assessment and seven satisfied all the criteria to be included in the review.
For the present update, we identified 246 reports after removing duplicates, of which we excluded 221 on the basis of title and abstract; we retrieved 25 articles in full text for more detailed evaluation, 14 of which we excluded, and 11 articles (eight studies) satisfied all the criteria to be included in the review. SeeFigure 1.
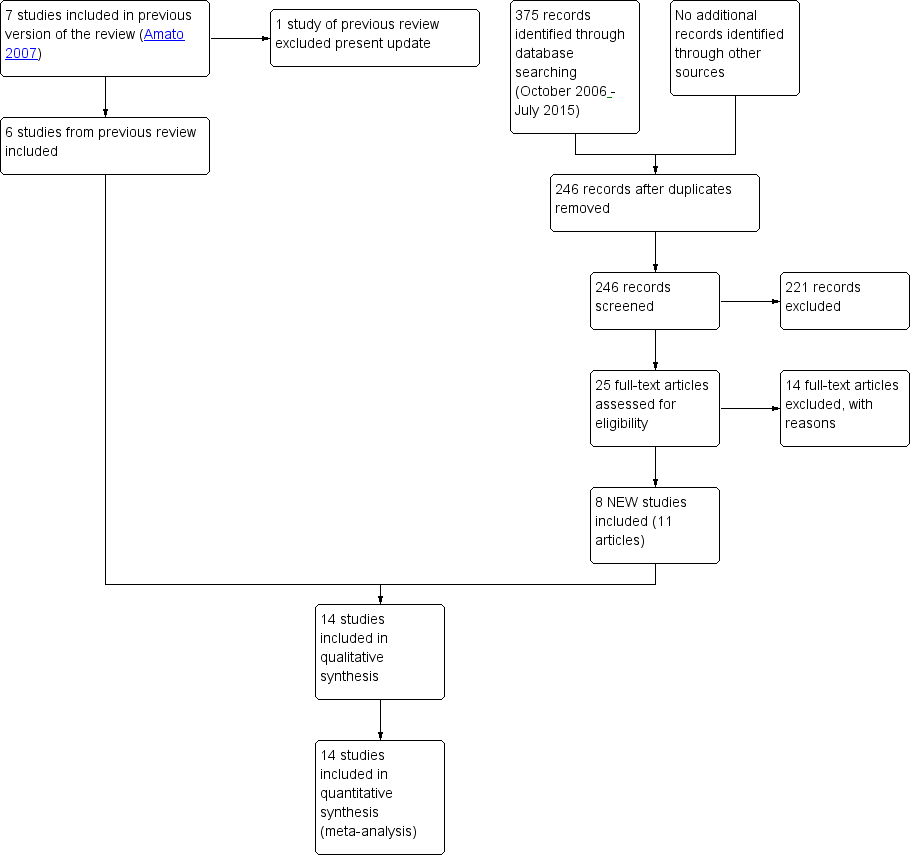
Study flow diagram. Review update 2015.
We excluded from the review one study which was included in the first version (Berger 1996).
For substantive descriptions of studies see 'Characteristics of included studies' and 'Characteristics of excluded studies' tables.
Included studies
We include 14 studies (719 participants); six from the original review and eight studies from the update.
Duration of trials:
The mean duration of the trials was 80 days (range 14 to 168 days).
Treatment regimens and setting:
Thirteen studies were conducted in the USA and one in Italy. The antipsychotic medication used in the included studies were:
-
Risperidone: five studies (Akerele 2007; Grabowski 2004; Levin 1999; Loebl 2008; Smelson 2004), mean dose for four of the studies 2.27 mg/day (range 1 to 4 mg) and one study with injections of long‐acting risperidone at a dose of 25 mg/14 days;
-
Olanzapine: five studies (Akerele 2007; Hamilton 2009; Kampman 2003; Reid 2005; Smelson 2006), mean dose 14 mg/day (range 2.5 to 20 mg/day);
-
Haloperidol: one study (Smelson 2006), using a target dose of 10 mg/day;
-
Quetiapine: two studies (Brown 2010; Tapp 2015), using doses of 400 ‐ 800 and 400 mg/day respectively;
-
Lamotrigine: one study (Brown 2012), using a dose of 400 mg/day;
-
Reserpine: one study (Winhusen 2007), using a dose of 50 mg/day;
-
Aripiprazol: one study (Meini 2010), using a dose of 10 mg/day.
Twelve studies were conducted in the outpatient setting, two studies in an inpatient .
Participants:
The studies covered 719 cocaine‐dependent participants; 469 from nine studies according to DSM‐IV criteria (DSM‐IV‐R) and 250 from five studies with different diagnostic criteria: 142 participants from two studies based on a reference to a previous diagnosis of dependence and recent use of cocaine; 28 participants from a study selected according to ICD‐9‐CM criteria; 20 diagnosed for another study using the Mini‐International Neuropsychiatric Interview (MINI); and one study with 30 participants requiring certification by a psychiatrist); 477/719 (66.3%) were men, but two studies (Smelson 2004; Smelson 2006) did not report data on gender; the mean age was 41.5 years.
Rating instruments used in the studies:
Acceptability of the treatment:
Side effects:
-
Abnormal Involuntary Movements Scale (NIMH 1988) used by Akerele 2007
-
Simpson‐Angus Scale (Simpson 1970) used by Akerele 2007
Craving:
-
Brief Substance Craving Scale (Somoza 1995) used by Kampman 2003, Reid 2005, Tapp 2015 and Winhusen 2007
-
Cocaine Craving Questionnaire (Tiffany 1993) used by Reid 2005, Brown 2010,Brown 2012 and Hamilton 2009
-
Visual Analogue Scale (McCormack 1988) used by Levin 1999 and Meini 2010
-
Voris Cocaine Craving Questionnaire (Smelson 1999) used by Smelson 2004 and Smelson 2006
-
Cocaine Craving Report (Weddington 1990) used by Akerele 2007
-
Cocaine Craving Scale (Halikas 1991) used by Loebl 2008
Use of cocaine:
-
Timeline Followback Interview (Sobell 1992) used by Brown 2012, Reid 2005, Tapp 2015 and Winhusen 2007
Severity of dependence:
-
Addiction Severity Index (McLellan 1992) used by Akerele 2007, Brown 2012, Grabowski 2004, Hamilton 2009, Kampman 2003, Loebl 2008, Reid 2005, and Winhusen 2007
-
Clinical Global Impression Scale (Guy 1976) used by Akerele 2007, Meini 2010 and Reid 2005
Psychiatric symptoms/psychological distress:
Anxiety
-
Hamilton Anxiety Rating Scale (Hamilton 1959) used by Kampman 2003 and Reid 2005
Depression
-
Hamilton Depression Rating Scale (Hamilton 1967) used by Akerele 2007, Brown 2012, Kampman 2003, Loebl 2008, Reid 2005, and Winhusen 2007
-
Quick Inventory of Depressive Symptomatology‐SR (Rush 2003) used by Brown 2010 and Brown 2012
-
Beck Depression Inventory (Beck 1996) used by Grabowski 2004
Psychopathology
-
Positive and Negative Syndrome Scale (Kay 1992) used by Akerele 2007 and Smelson 2006
-
Snaith‐Hamilton Pleasure Scale (Snaith 1995) used by Loebl 2008
-
Young Mania Rating Scale (Young 1978) used by Brown 2010 and Brown 2012
Withdrawal symptoms:
-
Cocaine Selective Severity Assessment (Kampman 1998) used by Kampman 2003 and Loebl 2008
Comparisons:
-
Any antipsychotic versus placebo: eight studies, 430 participants (Brown 2010; Grabowski 2004; Kampman 2003; Levin 1999; Loebl 2008; Smelson 2004; Tapp 2015; Winhusen 2007)
-
Risperidone versus placebo: four studies, 176 participants (Grabowski 2004; Levin 1999; Loebl 2008; Smelson 2004)
-
Olanzapine versus placebo: three studies, 146 participants (Hamilton 2009; Kampman 2003; Reid 2005)
-
Quetiapine versus placebo: two studies, 72 participants (Brown 2010; Tapp 2015)
-
Lamotrigine versus placebo: one study, 112 participants (Brown 2012)
-
Reserpine versus placebo: one study, 119 participants (Winhusen 2007)
-
Olanzapine versus haloperidol: one study, 31 participants (Smelson 2006)
-
Olanzapine versus risperidone: one study, 28 participants (Akerele 2007)
-
Aripiprazol versus ropirinole: one study, 28 participants (Meini 2010)
Grabowski 2004 has three arms, comparing risperidone 2 mg and 4 mg versus placebo; we have used the 33 participants in the placebo arm in both Analysis 1.1 and Analysis 2.1.
Excluded studies
Twenty‐four studies did not meet the criteria for inclusion. The grounds for exclusion were the following: study design: ; objective of the studies and outcomes measures: 16 studies (Evans 2001; Farren 2000; Haney 2011; Price 1997; Sherer 1988; Ersche 2010; Lile 2008; Lile 2011; Lofwall 2014; Máñez 2010; Netjek 2008; Middleton 2009; Nuzzo 2012; Rush 2009; Stoops 2007; Landabaso 2009); impossible to extract usable data: six studies (Grabowski 2000; Rubio 2006a; Rubio 2006b; Landabaso 2003; Sayers 2005; Tsuang 2002). We now excluded one study (Grabowski 2006), included in the previous version as an ongoing trial which met the inclusion criteria, due to a modification in the study protocol in 2007. The pharmacological intervention had been modified, substituting an antipsychotic drug (aripiprazol) with an antidepressant (citalopram), thus rendering it ineligible for this update. Another study included in the previous version (Berger 1996) was excluded from the update because the outcome did not comply with our inclusion criteria.
Risk of bias in included studies
All the studies were randomised controlled trials.
Allocation
Random sequence generation: we judged five studies to be at low risk of bias (Brown 2012; Kampman 2003; Meini 2010; Tapp 2015; Winhusen 2007). All the other were at unclear risk of bias because no information was provided about the methods followed.
Allocation concealment: Only two studies (Hamilton 2009; Reid 2005) had an adequate allocation concealment. One study (Brown 2012) presented a high risk of bias due to an inadequate concealment of allocation. In all the other studies the concealment of allocation was unclear.
Blinding
Performance bias
Objective outcomes: we judged all the studies to be at low risk of bias, because we considered that lack of blinding was unlikely to bias the outcomes.
Subjective outcomes: we judged only three studies (Brown 2012; Hamilton 2009; Reid 2005) to be at low risk of performance bias. One study (Meini 2010) was open‐label and judged to be at high risk of bias. All the other studies simply stated that they were double‐blind without further description, so we judged them to be at unclear risk.
Detection bias
Objective outcome: we judged all the studies to be at low risk of bias, because we considered that lack of blinding was unlikely to bias the outcomes.
Subjective outcomes: we rated only two studies (Brown 2012; Reid 2005) at low risk of performance bias. One study (Meini 2010) was open‐label and judged to be at high risk of bias . None of the other studies reported any information on this domain, so we judged them to be at unclear risk.
Incomplete outcome data
We judged five studies (Akerele 2007; Meini 2010; Smelson 2006; Tapp 2015; Winhusen 2007) to be at high risk of attrition bias because more than 30% of participants dropped out and there was no imputing of missing data or intention‐to‐treat (ITT) analysis.
One study (Brown 2012) did not report sufficient information for us to evaluate the risk of attrition bias. We rated all the other studies at low risk of attrition bias.
Selective reporting
All but one study (Akerele 2007) reported on the primary outcomes prespecified in the Methods section.

Risk of bias graph: review authors' judgements about each risk of bias item presented as percentages across all included studies.
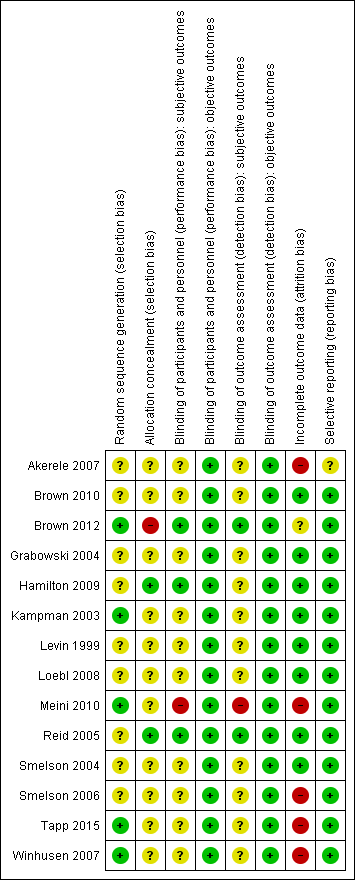
Risk of bias summary: review authors' judgements about each risk of bias item for each included study.
Effects of interventions
We summarised the results, with comparisons of quantitative data where possible, first for any antipsychotic drug versus placebo (see summary of findings Table for the main comparison) and then comparing separately the different types of antipsychotic medications versus placebo, as well as separate analyses for olanzapine versus haloperidol, olanzapine versus risperidone, and aripiprazol versus ropinirol.
For some outcomes reported in the included studies, it was impossible to pool the data due to the different ways of reporting the results. Different rating instruments were used and for many of them the authors did not indicate the scores considered to represent boundaries of mild, moderate and severe, to allow comparison of results between studies.
Primary outcomes
Dropouts from the treatment
Measured as number of participants who did not complete the treatment
(01) Any antipsychotic versus placebo
Eight studies (Brown 2010; Grabowski 2004; Kampman 2003; Levin 1999; Loebl 2008; Smelson 2004; Tapp 2015; Winhusen 2007), 430 participants, see Analysis 1.1 and summary of findings Table for the main comparison: Risk ratio (RR) 0.75 (95% confidence interval (CI) 0.57 to 0.97; I² = 27%); the results favour antipsychotic treatment.
(02) Risperidone versus placebo
Four studies (Grabowski 2004; Levin 1999; Loebl 2008; Smelson 2004), 176 participants, see Analysis 2.1, RR 0.81 (95% CI 0.63 to 1.04). The result shows a small but statistically non‐significant trend in favour of risperidone.
(03) Olanzapine versus placebo
One study (Kampman 2003), 30 participants, RR 2.00 (95% CI 0.20 to 19.78), see Analysis 3.1. No significant difference.
(04) Quetiapine versus placebo
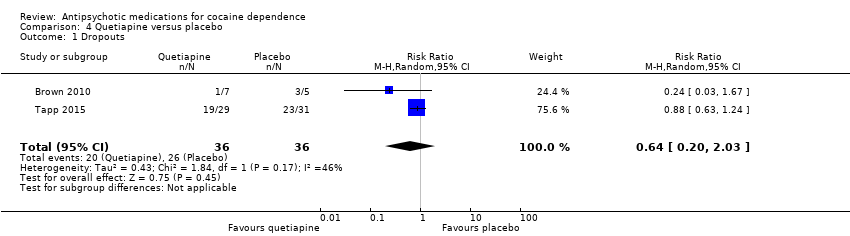
Two studies (Brown 2010; Tapp 2015), 72 participants, RR 0.64 (95% CI 0.20 to 2.03), see Analysis 4.1. No significant difference.
(06) Reserpine versus placebo
One study (Winhusen 2007), 119 participants, RR 0.80 (95% CI 0.48 to 1.34), see Analysis 6.1. No significant difference.
(07) Olanzapine versus haloperidol
One study (Smelson 2006), 31 participants, RR 1.50 (95% CI 0.63 to 3.57), see Analysis 7.1. No significant difference.
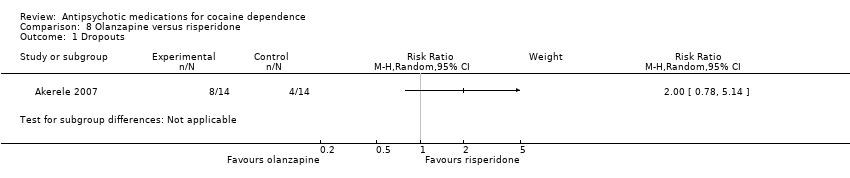
(08) Olanzapine versus risperidone
One study (Akerele 2007), 28 participants, RR 2.00 (95% CI 0.78 to 5.14), see Analysis 8.1. No significant difference.
(09) Aripiprazol versus ropinirol
One study (Meini 2010), 28 participants, RR 1.35 (95% CI 0.61 to 2.99), see Analysis 9.1. No significant difference.
Acceptability of the treatment
Measured as number of participants presenting at least one side effect
(01) Any antipsychotic versus placebo
Six studies (Brown 2010; Brown 2012; Hamilton 2009;Meini 2010; Reid 2005; Tapp 2015), 291 participants, RR 1.01 (95% CI 0.93 to 1.10), see Analysis 1.2 and summary of findings Table for the main comparison; no statistically significant difference.
(03) Olanzapine versus placebo
Two studies (Hamilton 2009; Reid 2005), 79 participants, RR 1.01 (95% CI 0.92 to 1.11), see Analysis 3.2, no significant difference.
One study (Kampman 2003) reported that adverse events were evenly distributed between the olanzapine and placebo groups, without significant differences in the occurrence of any adverse event between the two groups.
(04) Quetiapine versus placebo
Two studies (Brown 2010; Tapp 2015), 72 participants, RR 0.99 (95% CI 0.77 to 1.27), see Analysis 4.2; no significant difference.
(05) Lamotrigine versus placebo
One study (Brown 2012), 112 participants, RR 1.48 (95% CI 0.61 to 3.61), see Analysis 5.1, no significant difference.
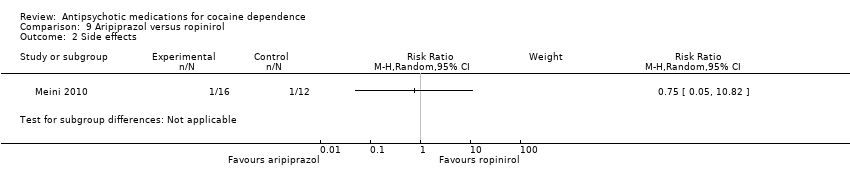
(09) Aripiprazol versus ropinirol
One study (Meini 2010), 28 participants, RR 0.75 (95% CI 0.05 to 10.82), see Analysis 9.2, no significant difference.
Use of primary substance of abuse
(01) Any antipsychotic versus placebo
Measured as the number of participants that reported the use of cocaine during the treatment
Two studies (Reid 2005; Tapp 2015), 91 participants, RR 1.02 (95% CI 0.65 to 1.62), see Analysis 1.3 and summary of findings Table for the main comparison; no significant difference.
Measured as continuous abstinence (number of participants that maintained negative cocaine screens for at least 2 ‐ 3 weeks)
Three studies (Hamilton 2009; Reid 2005; Tapp 2015), 139 participants, RR 1.30 (95% CI 0.73 to 2.32), see Analysis 1.4 and summary of findings Table for the main comparison; no significant difference.
(02) Risperidone versus placebo
Measured as the number of participants that maintained negative cocaine screens throughout the treatment period
One study (Loebl 2008) of 31 participants, reported that five participants in the risperidone group had negative cocaine screens at 50% or more of their visits throughout the treatment period, and that the 11 other participants were abstinent at 28% or fewer of their visits. Only one participant in the placebo group had negative cocaine screens at 50% or more of their visits. The difference was not statistically significant (Fisher exact test = 0.17). Participants in the risperidone group had a mean reduction in days of cocaine use in the preceding 30 days of 51% (standard deviation (SD) 45%), and in the placebo group of 9% (SD 117%). This difference was also not statistically significant.
(03) Olanzapine versus placebo
Measured as the number of participants that reported the use of cocaine during the treatment
One study (Reid 2005) of 31 participants measured self‐reported cocaine use in days/week, and did not find a statistically significant treatment effect, MD 0.80 (95% CI ‐0.61 to 2.21), seeAnalysis 3.3.
A second study (Kampman 2003) measured self‐reported cocaine use in days during the past 30 days in 30 participants, and reported similar results: MD 2.19 (95% CI ‐3.15 to 7.53), seeAnalysis 3.4.
Measured as the number of participants that maintained negative cocaine screens throughout the treatment period
Two studies (Hamilton 2009; Reid 2005), 79 participants, RR 1.37 (95% CI 0.71 to 2.61; I² = 0%) see Analysis 3.5, did not find a statistically significant treatment effect on continuous abstinence.
(04) Quetiapine versus placebo
Measured as the number of participants that reported the use of cocaine during the treatment
One study (Tapp 2015), 60 participants, measured self‐reported cocaine use in days/week. No statistically significant results were reported, MD ‐0.89 (95% CI ‐1.81 to 0.03), see Analysis 4.3.
Measured as the number of participants that had negative cocaine screens for three consecutive weeks
One study (Tapp 2015), 60 participants, showed no differences in terms of end‐of‐trial abstinence (13.7% in the quetiapine group versus 12.9% in the placebo group (Wald statistic = 0.01, df = 1, P = 0.92)). By the end of the study, 30% of participants who completed the study had achieved this remission, but there was no statistically significant difference in the percentage of change by group.
(05) Lamotrigine versus placebo
One study (Brown 2012) with 112 participants reported, using a declining‐effects random regression model, no differences in treatment effect between groups (F = 1.1, P = 0.31) in the percentage of days of cocaine use as measured by the change from week 1 to week 12.
(06) Reserpine versus placebo
Measured by weekly proportion of self‐reported cocaine non‐use days, confirmed by negative cocaine screens
One study( Winhusen 2007) of 119 participants showed a higher average of non‐use days (7%) than the reserpine group across the treatment period, and found no difference between groups over the treatment period (GEE, P = 0.45).
Results at follow‐up
None of the included studies presented results on follow‐up in a way suitable for use in a meta‐analysis or narrative description.
Secondary outcomes
Compliance
(03) Olanzapine versus placebo
Measured by pill count
One study (Hamilton 2009), 48 participants, reported no significant differences in mean percentage of adherence to prescribed olanzapine (93.4%, SD 9.9%) and prescribed placebo (90.1%, SD 13.1%); these did not significantly differ by one‐way ANOVA (F(1,43) = 0.896, P = 0.349).
Another study (Kampman 2003), 30 participants, described similar results with an average percentage of prescribed pills taken by the
olanzapine‐treated participants of 84.5% compared to 89.3% in the placebo‐treated group (t = 0.629, df = 28, not statistically significant).
A third study (Reid 2005) of 31 participants reported that compliance with medication treatment was not significantly different between any treatment
groups (P = 0.832).
(06) Reserpine versus placebo
Measured by pill count
One study (Winhusen 2007) of 119 participants assessed this outcome, calculating a compliance score from the number of tablets dispensed minus the number returned or reported lost divided by the number of tablets prescribed. The mean of this compliance score for the reserpine group, 0.79 (SD = 0.23), was not significantly different from that of the placebo group at 0.74 (SD = 0.34), (t = 1.13, P = 0.26).
(08) Olanzapine versus risperidone
Measured by self‐reported ingestion of medication
One study (Akerele 2007), 28 participants, showed no difference in the percentage reduction of self‐reported missed dosage over all administered doses: Olanzapine group 7% and risperidone group 8% (t = 0.31, df = 20, P = 0.76).
Craving
The included studies used different scales to rate this outcome, limiting the possibility to pool data.
(01) Any antipsychotic versus placebo
Measured by Brief Substance Craving Scale
Four studies (Kampman 2003; Reid 2005; Tapp 2015; Winhusen 2007), 240 participants, MD 0.13 (95% CI ‐1.08 to 1.35), see Analysis 1.5 and summary of findings Table for the main comparison, showed no significant difference, but heterogeneity was extremely high ( I2:85%) .
(02) Risperidone versus placebo
Measured by mean decrease of Visual Analogue Scale
In one study (Levin 1999),14 participants, using a scale from 0 to 100, the percentage reduction of the score after treatment was ‐31% in the risperidone group compared with ‐49% in the placebo group. The result was not y significant.
Measured by mean decrease in Minnesota Cocaine Craving Scale
One study (Loebl 2008) of 31 participants showed no treatment effect on intensity (F = 0.03, P = 0.86) or frequency (F = 1.69, P = 0.11) of craving, but described a trend for main effect in duration of craving episodes, with a smaller decrease in the risperidone group (56.6%) than in the placebo group (65.7%, F = 2.71, P = 0.11).
Measured by improvement on the Voris Cocaine Craving Questionnaire (VCCQ) subscale scores
One study (Smelson 2004) of 35 participants showed a significant main effect of time for the craving (F = 33.62, P = 0.01), mood (F = 5.78, P = 0.023), and sick (F = 4.264, P = 0.040) subscales of the VCCQ ( no further description is provided about which symptoms the term "sick" refers to), suggesting that participants in both groups improved over the course of the study.
(03) Olanzapine versus placebo
Measured by Brief Substance Craving Scale
Two studies (Kampman 2003; Reid 2005), 61 participants, see Analysis 3.6. MD 1.33 (95% CI ‐0.91 to 3.58; I² = 86%). There is no significant difference that could indicate a treatment effect, but heterogeneity was extremely high .
Another study (Hamilton 2009), 48 participants, did not find statistically significant differences between the olanzapine and placebo groups for the Craving Questionnaire.
(04) Quetiapine versus placebo
Measured by Brief Substance Craving Scale
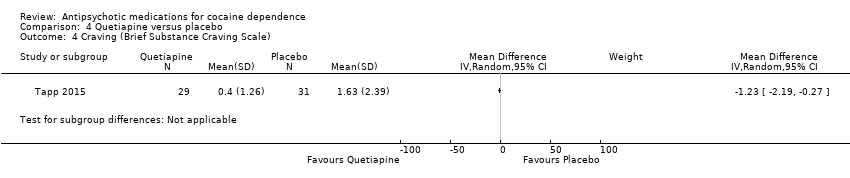
One study (Tapp 2015), 60 participants, reported no differences between groups in terms of absence of cravings (34.5% in quetiapine group versus 29.0% in placebo group; Wald statistic = 0.21,df = 1, P = 0.65). See also Analysis 4.4. MD ‐1.23 (95% CI ‐2.19 to ‐0.27), which also shows no statistically significant difference.
(05) Lamotrigine versus placebo
Measured by Cocaine Craving Questionnaire
One study (Brown 2012), 112 participants, reported using a declining‐effects random regression model, and found no differences in treatment effect between groups (F = 0.4, P = 0.53) as measured by the change from week 1 to week 12.
(06) Reserpine versus placebo
Measured by Brief Substance Craving Scale
One study (Winhusen 2007), 119 participants, see Analysis 6.2. MD ‐0.64 (95% CI ‐1.58 to 0.30), no statistically significant difference.
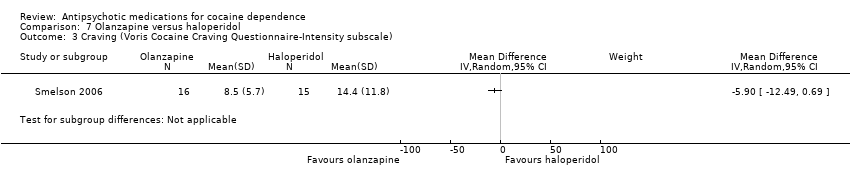
(07) Olanzapine versus haloperidol
Measured by Voris Cocaine Craving Questionnaire
One study (Smelson 2006), 31 participants, see Analysis 7.3. MD ‐5.90 (95% CI ‐12.49 to 0.69), no statistically significant difference.
(08) Olanzapine versus risperidone
Measured by Cocaine Craving Report
One study (Akerele 2007), in an analysis of the cocaine‐dependent subgroup with 19 participants, reported no statistically significant differences between groups in terms of cocaine craving over time.
(09) Aripiprazol versus ropinirol
Measured by Voris Cocaine Craving Questionnaire
This small trial (Meini 2010) of 28 participants, found no statistically significant differences: MD ‐14.90 (95% CI ‐38.25 to 8.45), see Analysis 9.3.
Severity of dependence
(01) Any antipsychotic versus placebo
Measured by Addiction Severity Index (ASI)
Four studies (Kampman 2003; Loebl 2008; Reid 2005; Winhusen 2007), 211 participants, MD 0.01 (95% CI ‐0.01 to 0.04), see Analysis 1.6, showed no statistically significant difference in ASI global scores.
Measured by Clinical Global Impression Scale (CGIS)
Three studies (Kampman 2003; Reid 2005; Winhusen 2007), 180 participants, MD 0.01 (95% CI ‐0.38 to 0.39), see Analysis 1.7, showed a similar result on CGIS scores.
(02) Risperidone versus placebo
Measured by Addiction Severity Index (ASI)
One study (Loebl 2008) of 31 participants reported no main effect of treatment for cocaine selective ASI scores, and showed no statistically significant differences in drug composite scores: MD 0.03 (95% CI ‐0.04 to 0.10), see Analysis 2.2.
(03) Olanzapine versus placebo
Measured by Addiction Severity Index (ASI)
Two studies (Kampman 2003; Reid 2005), 61 participants, see Analysis 3.7. MD 0.03 (95% CI ‐0.01 to 0.07) showed no statistically significant differences.
One study (Hamilton 2009), 48 participants, identified no statistically significant differences between the olanzapine and placebo groups on any of the ASI subscale measures.
Measured by Clinical Global Impression Scale
Using another measuring instrument, the above‐mentioned two studies (Kampman 2003; Reid 2005), 61 participants, see Analysis 3.8, MD 0.17 (95% CI ‐0.51 to 0.85) presented similar non‐significant results.
(06) Reserpine versus placebo
Measured by Addiction Severity Index
One study (Winhusen 2007), 119 participants, see Analysis 6.3, MD 0.00 (95% CI ‐0.03 to 0.03) found no statistically significant difference.
Measured by Clinical Global Impression Scale
The same study (Winhusen 2007), 119 participants, see Analysis 6.4, presented similar results using another scale: MD ‐0.07 (95% CI ‐0.54 to 0.40).
(09) Aripiprazol versus ropinirol
Measured by Clinical Global Impression Scale
One study (Meini 2010), 28 participants, also reported statistically non‐significant results for addiction severity: MD ‐0.40 (95% CI ‐1.66 to 0.86). See Analysis 9.4.
Amount of cocaine use
(01) Any antipsychotic versus placebo
Measured by grams used during the last week
Two studies (Brown 2010; Tapp 2015), 72 participants, MD ‐0.54 (95% CI ‐0.92 to ‐0.16), see Analysis 1.8, showed a small statistically significant reduction in self‐reported grams of cocaine used during the past week in the antipsychotic treatment group. But again, the result is limited by the small sample size of the included studies.
(03) Olanzapine versus placebo
Measured by money (US dollars) spent during past 30 days
One study( Kampman 2003), 30 participants, MD 218 (95% CI ‐61.96 to 497.96), see Analysis 3.9, showed no significant difference.
(04) Quetiapine versus placebo
Measured by grams used during the last week
Two studies (Brown 2010; Tapp 2015), 72 participants, showed a very small statistically significant difference in favour of quetiapine when comparing the amount of cocaine use by grams per week: MD ‐0.54 (95% CI ‐0.92 to ‐0.16), see Analysis 4.5.
Measured by money (US dollars) spent during the last week
One of these studies (Tapp 2015), 60 participants, also measured the amount of cocaine use by US dollars spent per week and found results in favour of quetiapine: MD ‐53.80 (95% CI ‐97.85 to ‐9.75), see Analysis 4.6. But the generalisability of this finding is low, due to the small sample size .
(05) Lamotrigine versus placebo
One study (Brown 2012), 112 participants, using a declining‐effects random regression model, reported a statistically significant decrease in US dollars spent on cocaine in the lamotrigine group compared to the placebo group (F = 3.9, P = 0.05), as measured by the change from week 1 to week 12.
(09) Aripiprazol versus ropinirol
Measured by grams of self‐reported cocaine consume per week
One study (Meini 2010), 28 participants, see Analysis 9.5, shows a small statistically significant effect in favour of aripiprazol: MD: ‐1.20 (95% CI ‐1.86 to ‐0.54), but the generalisability is low due the very small sample size.
Psychiatric symptoms/psychological distress
Depression
(01) Any antipsychotic versus placebo
Measured by Hamilton Depression Rating Scale
Four studies (Brown 2010; Kampman 2003; Reid 2005; Winhusen 2007), 192 participants, MD ‐0.82 (95% CI ‐3.19 to 1.55), see Analysis 1.9, showed a statistically non‐significant reduction in Hamilton Depression Rating Scale scores over the treatment periods in favour of antipsychotic treatment.
(02) Risperidone versus placebo
Measured by Hamilton Depression Rating Scale
One study (Loebl 2008) of 31 participants reported that no participants assigned to risperidone who completed the trial had an improvement in depressive symptoms. There was a mean increase in HAM‐D scores in the risperidone group of 7.4 (SD 8.8) and in the placebo group a decrease of ‐2.3 (SD 5.8,P = 0.018).
(03) Olanzapine versus placebo
Measured by Hamilton Depression Rating Scale
Two studies (Kampman 2003; Reid 2005), 61 participants, see Analysis 3.10, MD 1.34 (95% CI ‐3.84 to 6.52; I² = 76%). No significant difference found, but heterogeneity was extremely high.
(04) Quetiapine versus placebo
Measured by Hamilton Depression Rating Scale
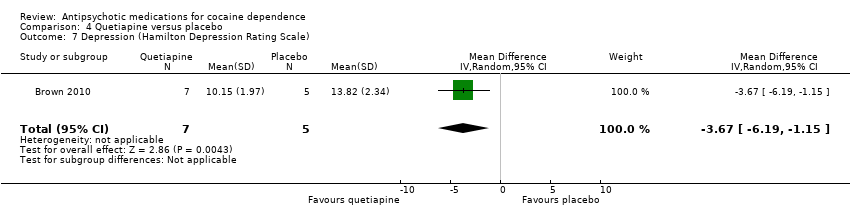
One small trial (Brown 2010) of 12 participants, see Analysis 4.7, MD ‐3.67 (95% CI ‐6.19 to ‐1.15) obtained results favouring quetiapine in reducing HAM‐D mean scores, but the very small sample size limits generalisability.
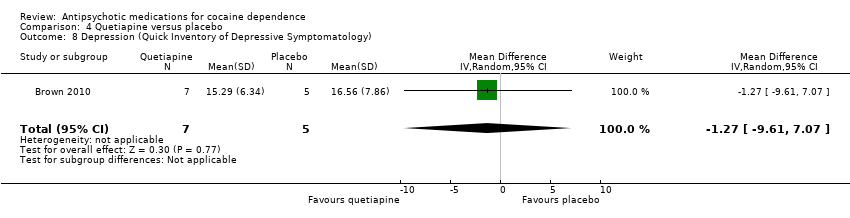
Measured by Quick Inventory of Depressive Symptomatology‐SR
One small trial (Brown 2010) of 12 participants, see Analysis 4.8, MD ‐1.27 (95% CI ‐9.61 to 7.07) showed no statistically significant difference.
(05) Lamotrigine versus placebo
Measured by Hamilton Depression Rating Scale and Quick Inventory of Depressive Symptomatology‐SR
One study (Brown 2012), 112 participants,using a declining‐effects random regression model, reported no differences in score changes between groups in depressive symptoms measured by HAM‐D (F = 0.3, P = 0.57) and QIDS‐SR (F = 0.1, P = 0.89) from week 1 to week 12.
(06) Reserpine versus placebo
Measured by Hamilton Depression Rating Scale
One study (Winhusen 2007), 119 participants, see Analysis 6.5, MD ‐1.07 (95% CI ‐2.21 to 0.07) No significant difference found,
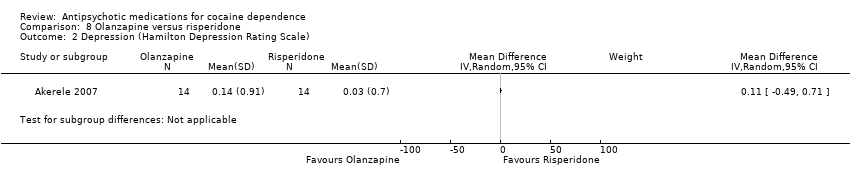
(08) Olanzapine versus risperidone
Measured by Hamilton Depression Rating Scale
One study (Akerele 2007), 28 participants, see Analysis 8.2, showed no significant differences: MD 0.11 (95% CI ‐0.49 to 0.71).
Anxiety
(03) Olanzapine versus placebo
Measured by Hamilton Anxiety Rating Scale
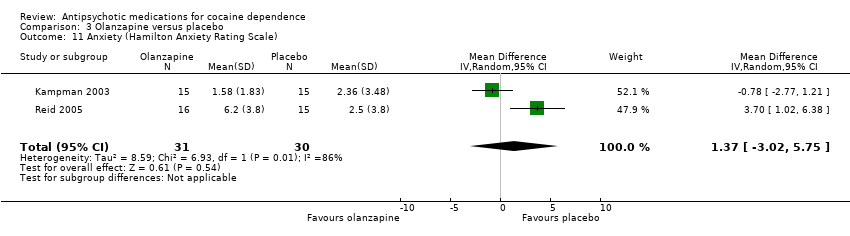
Two studies (Kampman 2003; Reid 2005), 61 participants, see Analysis 3.11, MD 1.37 (95% CI ‐3.02 to 5.75; I² = 86%) showed no significant difference, but heterogeneity was extremely high.
Psychopathology
(02) Risperidone versus placebo
Measured by Snaith‐Hamilton Pleasure Scale
One study (Loebl 2008), 31 participants, reported no effect of treatment.
(04) Quetiapine versus placebo
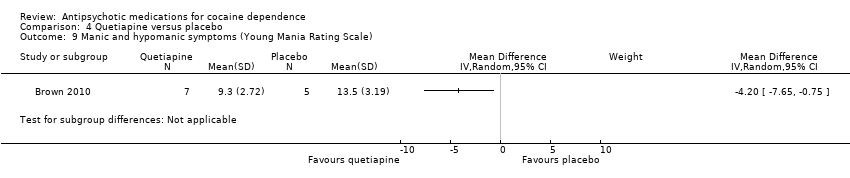
Measured by Young Mania Rating Scale (YMRS)
One small trial (Brown 2010) of 12 participants, see Analysis 4.9, MD ‐4.20 (95% CI ‐7.65 to ‐0.75) obtained results favouring quetiapine in reducing YMRS mean scores, but the small sample size limits generalisability.
(05) Lamotrigine versus placebo
Measured by Young Mania Rating Scale (YMRS)
One study (Brown 2012), 112 participants, using a declining‐effects random regression model, reported no differences in treatment effect between groups in manic and hypomanic symptoms (F = 0.5, P = 0.47) as measured by the change from week 1 to week 12.
(07) Olanzapine versus haloperidol
Measured by Positive and Negative Syndrome Scale (PANSS)
One study (Smelson 2006), 31 participants, see Analysis 7.2, MD ‐6.10 (95% CI ‐10.93 to ‐1.27) showed results favouring haloperidol in reducing scores, but the small sample size limits generalisability.
(08) Olanzapine versus risperidone
Measured by Positive and Negative Syndrome Scale
The Akerele 2007 study found a decrease in severity on the positive subscale over time for both groups (Z = 2.53, P = 0.01), but found no statistically significant differences between groups (Z = 0.49, P = 0.62) and no decrease in severity for the negative subscale over time (Z = 0.34, P = 0.73).
Withdrawal symptoms
(03) Olanzapine versus placebo
Measured by Cocaine Selective Severity Assessment
One study (Kampman 2003), 30 participants see Analysis 3.12, MD 5.60 (95% CI ‐0.31 to 11.51) found no statistically significant difference in withdrawal symptoms between groups.
Discussion
Summary of main results
We include 14 trials. They tested risperidone, olanzapine, quetiapine, lamotrigine, reserpine, haloperidol and aripiprazol as antipsychotic agents for the treatment of cocaine dependence, comparing them with placebo and in three studies (Akerele 2007; Meini 2010; Smelson 2006) comparing two drugs.
Comparing any antipsychotic drugs versus placebo, we found moderate‐quality evidence that antipsychotics reduced dropouts; these findings came from eight studies with 397 participants (Brown 2010; Grabowski 2004; Kampman 2003; Levin 1999; Loebl 2008; Smelson 2004; Tapp 2015; Winhusen 2007). There were no significant differences for any of the other primary outcomes: number of participants using cocaine during the treatment (as days/week by urine tests or self report): continuous abstinence (number of participants who maintained negative drug screens for two to three weeks), and side effects (number of participants with at least one side effect), but the evidence was low and came from only two, three and four studies respectively. We also found low‐quality evidence showing no difference in craving as assessed by the BSCS, but these results are based on only four studies with 240 participants (Kampman 2003; Reid 2005; Tapp 2015; Winhusen 2007). The single comparisons of each drug versus placebo or versus another drug included few trials with small sample sizes, so limiting the reliability of the results. Among these comparisons, only quetiapine seemed to perform better than placebo in reducing cocaine use as measured by grams per week or US dollars spent per week, and in levels of craving assessed by the BSCS. These results came only from two studies, one with 60 participants (Tapp 2015) and another with 20 participants (Brown 2010).
Overall completeness and applicability of evidence
Thirteen of the 14 included studies were conducted in the USA; this limits the generalisability of the results, because health effects of various substances of abuse seem to be strongly dependent on social context, and the location of the conduct of the studies could act as an effect modifier in the estimation of the efficacy of treatment.
Most of the included studies did not report useful results on important outcomes such as side effects, use of cocaine during the treatment and craving. In those studies which did report them, it was not possible to undertake a cumulative analysis because of the great heterogeneity of the scales used in the primary studies and in the way in which results are reported.
Quality of the evidence
The major limitations of the studies were the high risk of attrition bias (40% of the included studies) and the low quality of reporting, mainly affecting the risk of selection bias, and performance and detection bias, which we rated as being at unclear risk for 75% to 80% of the studies. Overall we rated study quality as moderate for dropouts, and low for the other outcomes
Potential biases in the review process
Risk of publication bias by Funnel plot could not be assessed because less than ten trials were included in the analysis. We performed a very comprehensive search and contacted investigators to request information about unpublished or incomplete trials. However, publication bias could not be excluded because only small studies have been included in the analyses.

Study flow diagram. Review update 2015.

Risk of bias graph: review authors' judgements about each risk of bias item presented as percentages across all included studies.

Risk of bias summary: review authors' judgements about each risk of bias item for each included study.

Comparison 1 Any antipsychotic versus placebo, Outcome 1 Dropouts.

Comparison 1 Any antipsychotic versus placebo, Outcome 2 Side effects.

Comparison 1 Any antipsychotic versus placebo, Outcome 3 Number of participants using cocaine during the treatment (as days/week by urine tests or self report).
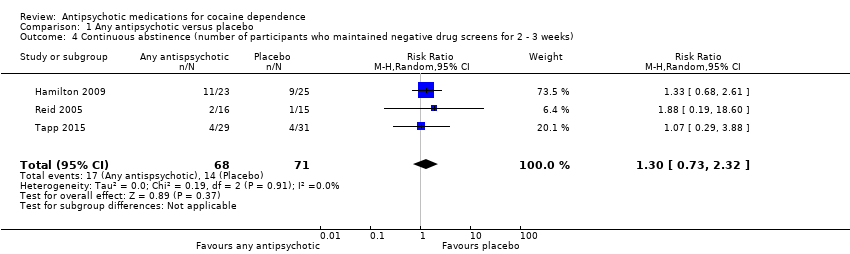
Comparison 1 Any antipsychotic versus placebo, Outcome 4 Continuous abstinence (number of participants who maintained negative drug screens for 2 ‐ 3 weeks).
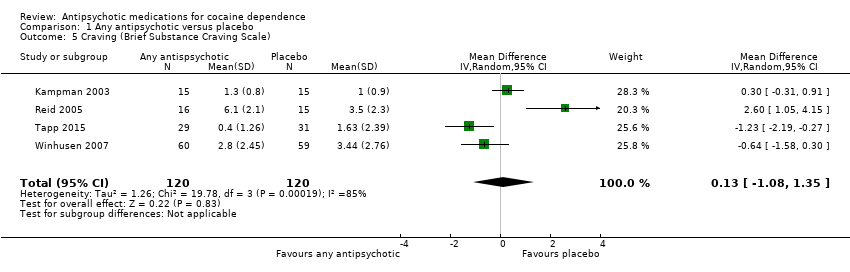
Comparison 1 Any antipsychotic versus placebo, Outcome 5 Craving (Brief Substance Craving Scale).
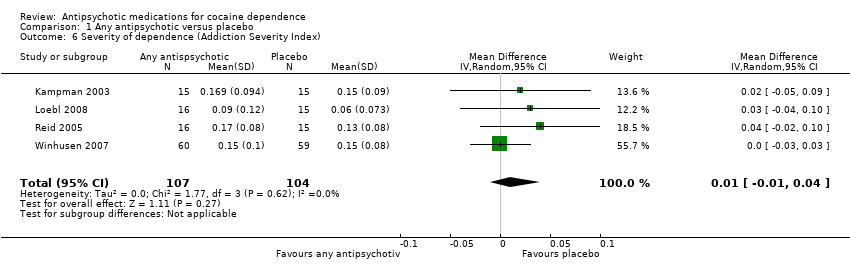
Comparison 1 Any antipsychotic versus placebo, Outcome 6 Severity of dependence (Addiction Severity Index).

Comparison 1 Any antipsychotic versus placebo, Outcome 7 Severity of dependence (Clinical Global Impression Scale).

Comparison 1 Any antipsychotic versus placebo, Outcome 8 Use of cocaine during the treatment (self‐reported as g/week).
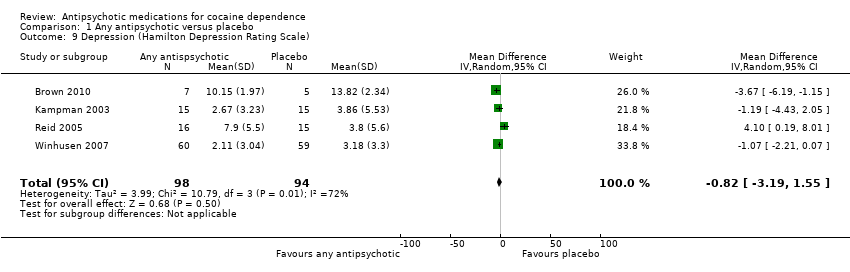
Comparison 1 Any antipsychotic versus placebo, Outcome 9 Depression (Hamilton Depression Rating Scale).

Comparison 2 Risperidone versus placebo, Outcome 1 Dropouts.

Comparison 2 Risperidone versus placebo, Outcome 2 Severity of dependence (Addiction Severity Index).
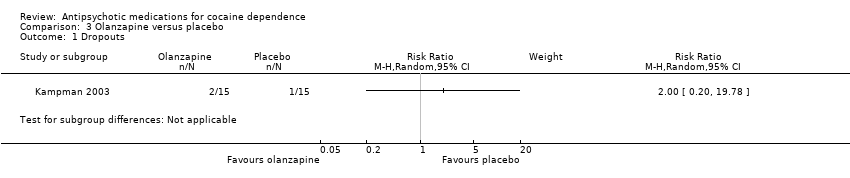
Comparison 3 Olanzapine versus placebo, Outcome 1 Dropouts.
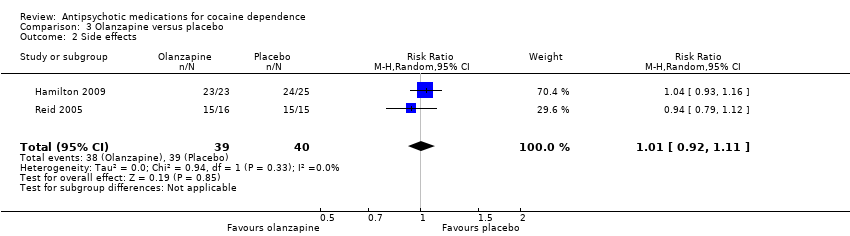
Comparison 3 Olanzapine versus placebo, Outcome 2 Side effects.

Comparison 3 Olanzapine versus placebo, Outcome 3 Use of cocaine during the treatment (self‐reported as days/week).
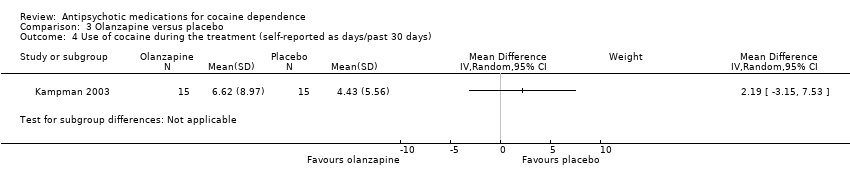
Comparison 3 Olanzapine versus placebo, Outcome 4 Use of cocaine during the treatment (self‐reported as days/past 30 days).

Comparison 3 Olanzapine versus placebo, Outcome 5 Continuous abstinence (participants who maintained negative drug screens throughout the treatment period ).

Comparison 3 Olanzapine versus placebo, Outcome 6 Craving (Brief Substance Craving Scale).
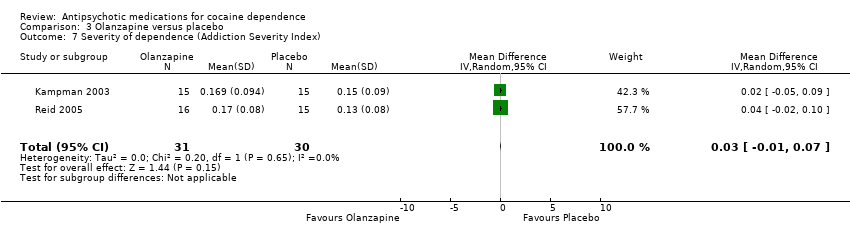
Comparison 3 Olanzapine versus placebo, Outcome 7 Severity of dependence (Addiction Severity Index).
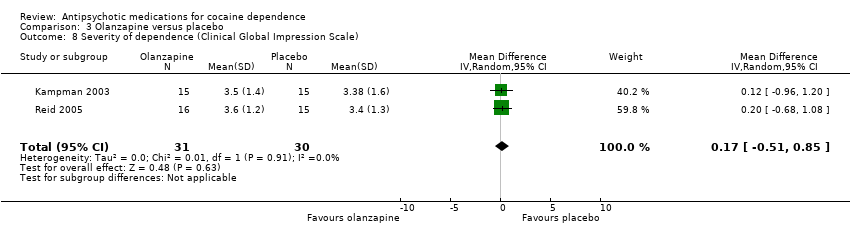
Comparison 3 Olanzapine versus placebo, Outcome 8 Severity of dependence (Clinical Global Impression Scale).

Comparison 3 Olanzapine versus placebo, Outcome 9 Amount of of cocaine use during the treatment (self‐reported as dollars spent/past 30 days).
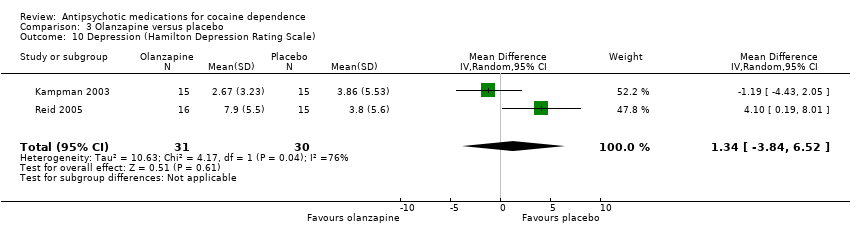
Comparison 3 Olanzapine versus placebo, Outcome 10 Depression (Hamilton Depression Rating Scale).
Comparison 3 Olanzapine versus placebo, Outcome 11 Anxiety (Hamilton Anxiety Rating Scale).

Comparison 3 Olanzapine versus placebo, Outcome 12 Withdrawal symptoms (Cocaine Selective Severity Assessment).
Comparison 4 Quetiapine versus placebo, Outcome 1 Dropouts.

Comparison 4 Quetiapine versus placebo, Outcome 2 Side effects.

Comparison 4 Quetiapine versus placebo, Outcome 3 Use of cocaine during the treatment (self‐reported as days/week).
Comparison 4 Quetiapine versus placebo, Outcome 4 Craving (Brief Substance Craving Scale).

Comparison 4 Quetiapine versus placebo, Outcome 5 Amount of of cocaine use during the treatment (self‐reported as g/week).

Comparison 4 Quetiapine versus placebo, Outcome 6 Amount of of cocaine use during the treatment (self‐reported as dollars spent/week).
Comparison 4 Quetiapine versus placebo, Outcome 7 Depression (Hamilton Depression Rating Scale).
Comparison 4 Quetiapine versus placebo, Outcome 8 Depression (Quick Inventory of Depressive Symptomatology).
Comparison 4 Quetiapine versus placebo, Outcome 9 Manic and hypomanic symptoms (Young Mania Rating Scale).

Comparison 5 Lamotrigine versus placebo, Outcome 1 Side effects.

Comparison 6 Reserpine versus placebo, Outcome 1 Dropouts.

Comparison 6 Reserpine versus placebo, Outcome 2 Craving (Brief Substance Craving Scale).
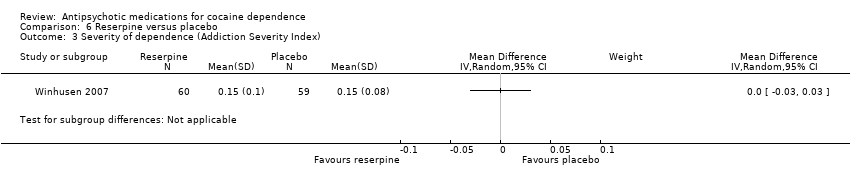
Comparison 6 Reserpine versus placebo, Outcome 3 Severity of dependence (Addiction Severity Index).

Comparison 6 Reserpine versus placebo, Outcome 4 Severity of dependence (Clinical Global Impression Scale).
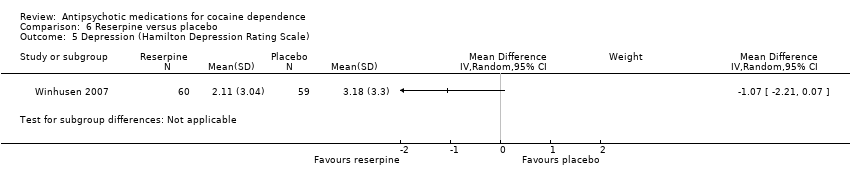
Comparison 6 Reserpine versus placebo, Outcome 5 Depression (Hamilton Depression Rating Scale).

Comparison 7 Olanzapine versus haloperidol, Outcome 1 Dropouts.

Comparison 7 Olanzapine versus haloperidol, Outcome 2 Psychopathology (Positive and Negative Syndrome Scale).
Comparison 7 Olanzapine versus haloperidol, Outcome 3 Craving (Voris Cocaine Craving Questionnaire‐Intensity subscale).
Comparison 8 Olanzapine versus risperidone, Outcome 1 Dropouts.
Comparison 8 Olanzapine versus risperidone, Outcome 2 Depression (Hamilton Depression Rating Scale).

Comparison 9 Aripiprazol versus ropinirol, Outcome 1 Dropouts.
Comparison 9 Aripiprazol versus ropinirol, Outcome 2 Side effects.
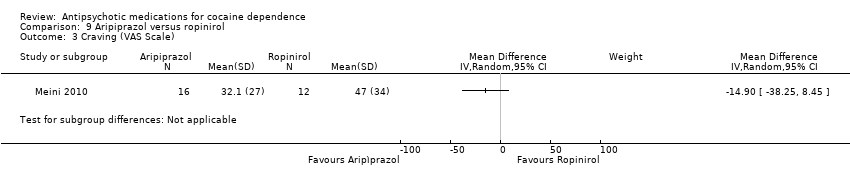
Comparison 9 Aripiprazol versus ropinirol, Outcome 3 Craving (VAS Scale).

Comparison 9 Aripiprazol versus ropinirol, Outcome 4 Severity of dependence (Clinical Global Impression Scale).
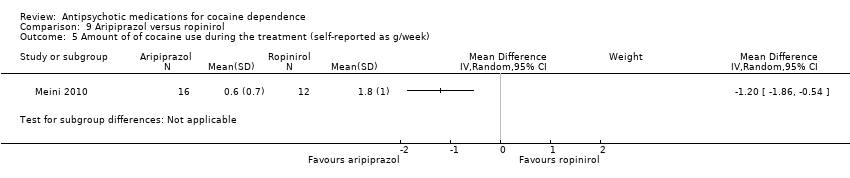
Comparison 9 Aripiprazol versus ropinirol, Outcome 5 Amount of of cocaine use during the treatment (self‐reported as g/week).
| Any antipsychotic versus placebo for cocaine dependence | ||||||
| Patient or population: people with cocaine dependence | ||||||
| Outcomes | Illustrative comparative risks* (95% CI) | Relative effect | No of Participants | Quality of the evidence | Comments | |
| Assumed risk | Corresponding risk | |||||
| Control | Any antipsychotic versus placebo | |||||
| Dropouts | Study population | RR 0.75 | 397 | ⊕⊕⊕⊝ | ||
| 547 per 1000 | 411 per 1000 | |||||
| Moderate | ||||||
| 500 per 1000 | 375 per 1000 | |||||
| Side effects | Study population | RR 1.01 | 291 | ⊕⊕⊝⊝ | ||
| 497 per 1000 | 502 per 1000 | |||||
| Moderate | ||||||
| 465 per 1000 | 470 per 1000 | |||||
| Number of participants using cocaine during the treatment (as days/week by urine tests or self report) | Study population | RR 1.02 | 91 | ⊕⊕⊝⊝ | ||
| 478 per 1000 | 488 per 1000 | |||||
| Moderate | ||||||
| 596 per 1000 | 608 per 1000 | |||||
| Continuous abstinence (number of participants who maintained negative drug screens for 2 ‐ 3 weeks) | Study population | RR 1.30 | 139 | ⊕⊕⊝⊝ | ||
| 197 per 1000 | 256 per 1000 | |||||
| Moderate | ||||||
| 129 per 1000 | 168 per 1000 | |||||
| Craving (Brief Substance Craving Scale) | The mean craving (brief substance craving scale) in the control groups was | The mean craving (Brief Substance Craving Scale) in the intervention groups was | 240 | ⊕⊕⊝⊝ | ||
| *The basis for the assumed risk (e.g. the median control group risk across studies) is provided in footnotes. The corresponding risk (and its 95% confidence interval) is based on the assumed risk in the comparison group and the relative effect of the intervention (and its 95% CI). | ||||||
| GRADE Working Group grades of evidence | ||||||
| 1All the studies were at unclear risk of selection bias. | ||||||
| Outcome or subgroup title | No. of studies | No. of participants | Statistical method | Effect size |
| 1 Dropouts Show forest plot | 8 | 397 | Risk Ratio (M‐H, Random, 95% CI) | 0.75 [0.57, 0.97] |
| 2 Side effects Show forest plot | 6 | 291 | Risk Ratio (M‐H, Random, 95% CI) | 1.01 [0.93, 1.10] |
| 3 Number of participants using cocaine during the treatment (as days/week by urine tests or self report) Show forest plot | 2 | 91 | Risk Ratio (M‐H, Random, 95% CI) | 1.02 [0.65, 1.62] |
| 4 Continuous abstinence (number of participants who maintained negative drug screens for 2 ‐ 3 weeks) Show forest plot | 3 | 139 | Risk Ratio (M‐H, Random, 95% CI) | 1.30 [0.73, 2.32] |
| 5 Craving (Brief Substance Craving Scale) Show forest plot | 4 | 240 | Mean Difference (IV, Random, 95% CI) | 0.13 [‐1.08, 1.35] |
| 6 Severity of dependence (Addiction Severity Index) Show forest plot | 4 | 211 | Mean Difference (IV, Random, 95% CI) | 0.01 [‐0.01, 0.04] |
| 7 Severity of dependence (Clinical Global Impression Scale) Show forest plot | 3 | 180 | Mean Difference (IV, Random, 95% CI) | 0.01 [‐0.38, 0.39] |
| 8 Use of cocaine during the treatment (self‐reported as g/week) Show forest plot | 2 | 72 | Mean Difference (IV, Random, 95% CI) | ‐0.54 [‐0.92, ‐0.16] |
| 9 Depression (Hamilton Depression Rating Scale) Show forest plot | 4 | 192 | Mean Difference (IV, Random, 95% CI) | ‐0.82 [‐3.19, 1.55] |
| Outcome or subgroup title | No. of studies | No. of participants | Statistical method | Effect size |
| 1 Dropouts Show forest plot | 4 | 176 | Risk Ratio (M‐H, Random, 95% CI) | 0.81 [0.63, 1.04] |
| 2 Severity of dependence (Addiction Severity Index) Show forest plot | 1 | 31 | Mean Difference (IV, Random, 95% CI) | 0.03 [‐0.04, 0.10] |
| Outcome or subgroup title | No. of studies | No. of participants | Statistical method | Effect size |
| 1 Dropouts Show forest plot | 1 | Risk Ratio (M‐H, Random, 95% CI) | Subtotals only | |
| 2 Side effects Show forest plot | 2 | 79 | Risk Ratio (M‐H, Random, 95% CI) | 1.01 [0.92, 1.11] |
| 3 Use of cocaine during the treatment (self‐reported as days/week) Show forest plot | 1 | Mean Difference (IV, Random, 95% CI) | Subtotals only | |
| 4 Use of cocaine during the treatment (self‐reported as days/past 30 days) Show forest plot | 1 | Mean Difference (IV, Random, 95% CI) | Subtotals only | |
| 5 Continuous abstinence (participants who maintained negative drug screens throughout the treatment period ) Show forest plot | 2 | 79 | Risk Ratio (M‐H, Random, 95% CI) | 1.37 [0.71, 2.61] |
| 6 Craving (Brief Substance Craving Scale) Show forest plot | 2 | 61 | Mean Difference (IV, Random, 95% CI) | 1.33 [‐0.91, 3.58] |
| 7 Severity of dependence (Addiction Severity Index) Show forest plot | 2 | 61 | Mean Difference (IV, Random, 95% CI) | 0.03 [‐0.01, 0.07] |
| 8 Severity of dependence (Clinical Global Impression Scale) Show forest plot | 2 | 61 | Mean Difference (IV, Random, 95% CI) | 0.17 [‐0.51, 0.85] |
| 9 Amount of of cocaine use during the treatment (self‐reported as dollars spent/past 30 days) Show forest plot | 1 | Mean Difference (IV, Random, 95% CI) | Subtotals only | |
| 10 Depression (Hamilton Depression Rating Scale) Show forest plot | 2 | 61 | Mean Difference (IV, Random, 95% CI) | 1.34 [‐3.84, 6.52] |
| 11 Anxiety (Hamilton Anxiety Rating Scale) Show forest plot | 2 | 61 | Mean Difference (IV, Random, 95% CI) | 1.37 [‐3.02, 5.75] |
| 12 Withdrawal symptoms (Cocaine Selective Severity Assessment) Show forest plot | 1 | Mean Difference (IV, Random, 95% CI) | Subtotals only | |
| Outcome or subgroup title | No. of studies | No. of participants | Statistical method | Effect size |
| 1 Dropouts Show forest plot | 2 | 72 | Risk Ratio (M‐H, Random, 95% CI) | 0.64 [0.20, 2.03] |
| 2 Side effects Show forest plot | 2 | 72 | Risk Ratio (M‐H, Random, 95% CI) | 0.99 [0.77, 1.27] |
| 3 Use of cocaine during the treatment (self‐reported as days/week) Show forest plot | 1 | Mean Difference (IV, Random, 95% CI) | Subtotals only | |
| 4 Craving (Brief Substance Craving Scale) Show forest plot | 1 | Mean Difference (IV, Random, 95% CI) | Subtotals only | |
| 5 Amount of of cocaine use during the treatment (self‐reported as g/week) Show forest plot | 2 | 72 | Mean Difference (IV, Random, 95% CI) | ‐0.54 [‐0.92, ‐0.16] |
| 6 Amount of of cocaine use during the treatment (self‐reported as dollars spent/week) Show forest plot | 1 | Mean Difference (IV, Random, 95% CI) | Subtotals only | |
| 7 Depression (Hamilton Depression Rating Scale) Show forest plot | 1 | 12 | Mean Difference (IV, Random, 95% CI) | ‐3.67 [‐6.19, ‐1.15] |
| 8 Depression (Quick Inventory of Depressive Symptomatology) Show forest plot | 1 | 12 | Mean Difference (IV, Random, 95% CI) | ‐1.27 [‐9.61, 7.07] |
| 9 Manic and hypomanic symptoms (Young Mania Rating Scale) Show forest plot | 1 | Mean Difference (IV, Random, 95% CI) | Subtotals only | |
| Outcome or subgroup title | No. of studies | No. of participants | Statistical method | Effect size |
| 1 Side effects Show forest plot | 1 | Risk Ratio (M‐H, Random, 95% CI) | Subtotals only | |
| Outcome or subgroup title | No. of studies | No. of participants | Statistical method | Effect size |
| 1 Dropouts Show forest plot | 1 | Risk Ratio (M‐H, Random, 95% CI) | Subtotals only | |
| 2 Craving (Brief Substance Craving Scale) Show forest plot | 1 | Mean Difference (IV, Random, 95% CI) | Subtotals only | |
| 3 Severity of dependence (Addiction Severity Index) Show forest plot | 1 | Mean Difference (IV, Random, 95% CI) | Subtotals only | |
| 4 Severity of dependence (Clinical Global Impression Scale) Show forest plot | 1 | Mean Difference (IV, Random, 95% CI) | Subtotals only | |
| 5 Depression (Hamilton Depression Rating Scale) Show forest plot | 1 | Mean Difference (IV, Random, 95% CI) | Subtotals only | |
| Outcome or subgroup title | No. of studies | No. of participants | Statistical method | Effect size |
| 1 Dropouts Show forest plot | 1 | Risk Ratio (M‐H, Random, 95% CI) | Subtotals only | |
| 2 Psychopathology (Positive and Negative Syndrome Scale) Show forest plot | 1 | Mean Difference (IV, Random, 95% CI) | Subtotals only | |
| 3 Craving (Voris Cocaine Craving Questionnaire‐Intensity subscale) Show forest plot | 1 | Mean Difference (IV, Random, 95% CI) | Subtotals only | |
| Outcome or subgroup title | No. of studies | No. of participants | Statistical method | Effect size |
| 1 Dropouts Show forest plot | 1 | Risk Ratio (M‐H, Random, 95% CI) | Subtotals only | |
| 2 Depression (Hamilton Depression Rating Scale) Show forest plot | 1 | Mean Difference (IV, Random, 95% CI) | Subtotals only | |
| Outcome or subgroup title | No. of studies | No. of participants | Statistical method | Effect size |
| 1 Dropouts Show forest plot | 1 | Risk Ratio (M‐H, Random, 95% CI) | Subtotals only | |
| 2 Side effects Show forest plot | 1 | Risk Ratio (M‐H, Random, 95% CI) | Subtotals only | |
| 3 Craving (VAS Scale) Show forest plot | 1 | Mean Difference (IV, Random, 95% CI) | Subtotals only | |
| 4 Severity of dependence (Clinical Global Impression Scale) Show forest plot | 1 | Mean Difference (IV, Random, 95% CI) | Subtotals only | |
| 5 Amount of of cocaine use during the treatment (self‐reported as g/week) Show forest plot | 1 | Mean Difference (IV, Random, 95% CI) | Subtotals only | |