Hemodiafiltración, hemofiltración y hemodiálisis para la enfermedad renal terminal
Información
- DOI:
- https://doi.org/10.1002/14651858.CD006258.pub2Copiar DOI

- Base de datos:
-
- Cochrane Database of Systematic Reviews
- Versión publicada:
-
- 20 mayo 2015see what's new
- Tipo:
-
- Intervention
- Etapa:
-
- Review
- Grupo Editorial Cochrane:
-
Grupo Cochrane de Riñón y trasplante
- Copyright:
-
- Copyright © 2015 The Cochrane Collaboration. Published by John Wiley & Sons, Ltd.
Cifras del artículo
Altmetric:
Citado por:
Autores
Contributions of authors
Original review (2006)
-
Giovanni FM Strippoli: Design, conduct, data‐analysis, writing review
-
Alison M MacLeod: Design and writing the review
-
Conal Daly: Designing, screening search results, selecting relevant studies and writing the review
-
Paul Roderick: Design and writing the review.
-
Sheila Wallace: Develop search strategy
-
Kannaiyan S Rabindranath: Develop search strategy, screen search titles, select studies, data extraction and analysis, writing review
Updated review (2015)
-
Ionut Nistor: Screening and identification of additional studies for inclusion, development of database, data extraction, completion of tables and figures, drafting of first version of updated manuscript
-
Suetonia Palmer: Data checking and analysis, revision of first and subsequent drafts, generation of additional tables
-
Valeria Saglimbene: Screening and identification of additional studies for inclusion, data extraction and checking
-
Jonathan C. Craig: Data analysis and revision of first and subsequent drafts
-
Giovanni FM Strippoli: Screening and identification of additional studies for inclusion, data analysis and revision of first and subsequent drafts
Sources of support
Internal sources
-
University of Sydney School of Public Health, non‐established PhD scholarship, Australia.
External sources
-
National Kidney Research Fund, UK.
-
European Renal Best Practice and ERA‐EDTA, Other.
Ionut Nistor was the recipient of a grant from European Renal Best Practice (ERBP) and the European Renal Association‐ European Dialysis Transplantation Association (ERA‐EDTA).
Declarations of interest
The 2006 review was funded by the National Kidney Research Fund (UK).
Acknowledgements
2006 review
The 2006 version of this review was funded by the National Kidney Research Fund (UK). We thank Drs C Basile, J Eiselt, LW Henderson, W Lornoy, E Moville, M Noris, H Schiffl, and V Wizemann for supplying data relating to their studies on request. Dr Strippoli was part‐funded through a University of Sydney School of Public Health, non‐established PhD scholarship.
2015 review
Drs Rabindranath, Daly, Roderick, Wallace and MacLeod were authors on the first version of this review. We thank Drs Alvestrand (PROFIL Study 2011), Asci (TURKISH HDF 2013), Coll (Coll 2009), Grooteman (CONTRAST (Dutch) Study 2005), Locatelli (Bolasco 2003), Mancini (Santoro 2005a), Mandolfo (Mandolfo 2008), Mostovaya (CONTRAST (Dutch) Study 2005), Ok (TURKISH HDF 2013), Pedrini (Pedrini 2011a), Righetti (Righetti 2010), Santoro (Santoro 2005a; Santoro 1999), Selby (Selby 2006a), Stefansson (Stefansson 2012), Tessitore (Santoro 1999), Vaslaki (Vaslaki 2006),and Vernaglione (Cristofano 2004) for supplying data for their studies on request.
Dr Nistor is a fellow of the Methods Support Team of European Renal Best Practice (ERBP), supported by a grant of the European Renal Association‐European Dialysis Transplantation Association (ERA‐EDTA).
Version history
| Published | Title | Stage | Authors | Version |
| 2015 May 20 | Haemodiafiltration, haemofiltration and haemodialysis for end‐stage kidney disease | Review | Ionut Nistor, Suetonia C Palmer, Jonathan C Craig, Valeria Saglimbene, Mariacristina Vecchio, Adrian Covic, Giovanni FM Strippoli | |
| 2006 Oct 18 | Haemodiafiltration, haemofiltration and haemodialysis for end‐stage kidney disease | Review | Kannaiyan S Rabindranath, Giovanni FM Strippoli, Conal Daly, Paul J Roderick, Sheila A Wallace, Alison M MacLeod | |
Differences between protocol and review
Risk of bias assessment tool has replaced the quality assessment checklist (Rabindranath 2005).
Keywords
MeSH
Medical Subject Headings (MeSH) Keywords
Medical Subject Headings Check Words
Adult; Female; Humans; Male;
PICO

Study flow diagram.

Risk of bias summary: review authors' judgements about each risk of bias item for each included study.
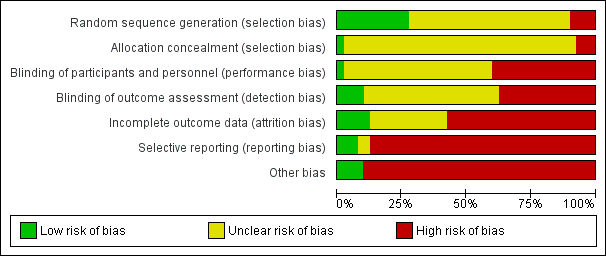
Risk of bias graph: review authors' judgements about each risk of bias item presented as percentages across all included studies.
Funnel plot of comparison: 1 Convection (haemofiltration/HDF/acetate‐free biofiltration) versus haemodialysis, outcome: 1.1 All‐cause mortality.

Funnel plot of comparison: 1 Convection (haemofiltration/haemodiafiltration/acetate‐free biofiltration) versus haemodialysis, outcome: 1.2 Cardiovascular mortality.

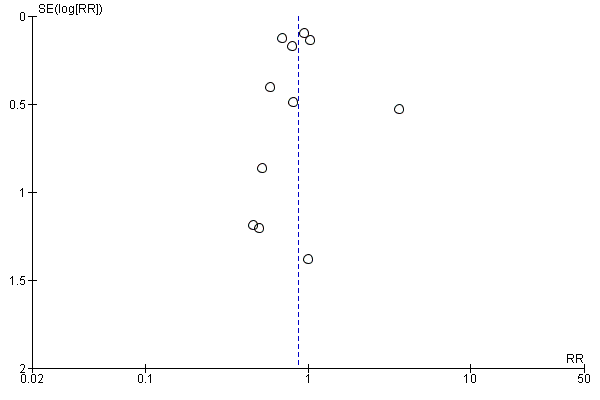
Funnel plot of comparison: 1 Convection (haemofiltration/HDF/acetate‐free biofiltration) versus haemodialysis, outcome: 1.6 Change of dialysis modality.

Comparison 1 Convection (haemofiltration/haemodiafiltration/acetate‐free biofiltration) versus haemodialysis, Outcome 1 All‐cause mortality.

Comparison 1 Convection (haemofiltration/haemodiafiltration/acetate‐free biofiltration) versus haemodialysis, Outcome 2 Cardiovascular mortality.
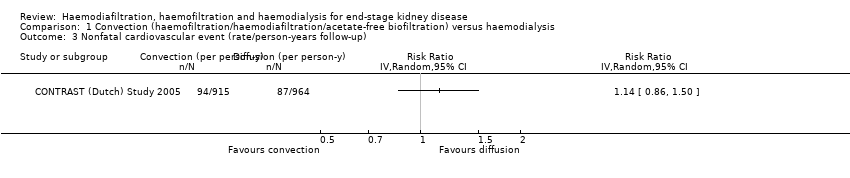
Comparison 1 Convection (haemofiltration/haemodiafiltration/acetate‐free biofiltration) versus haemodialysis, Outcome 3 Nonfatal cardiovascular event (rate/person‐years follow‐up).

Comparison 1 Convection (haemofiltration/haemodiafiltration/acetate‐free biofiltration) versus haemodialysis, Outcome 4 Hospitalisation.

Comparison 1 Convection (haemofiltration/haemodiafiltration/acetate‐free biofiltration) versus haemodialysis, Outcome 5 Hospitalisation (rate/person‐years follow‐up).
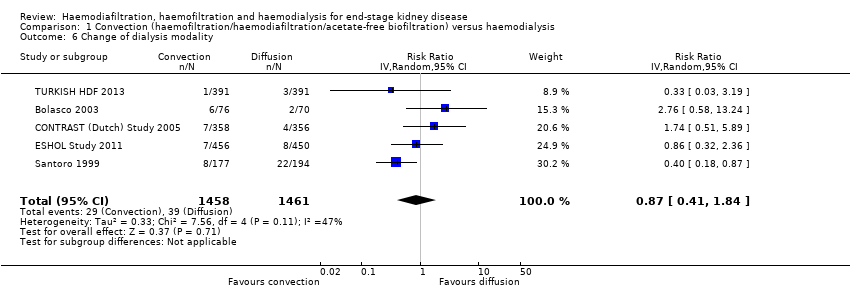
Comparison 1 Convection (haemofiltration/haemodiafiltration/acetate‐free biofiltration) versus haemodialysis, Outcome 6 Change of dialysis modality.
| Study | Treatment effect | No. of participants |
| ESHOL Study 2011 | In this study which reporting the number of hypotensive events/person‐years follow‐up, convective dialysis reduced the rate of hypotension during dialysis (906 participants: RR 0.72, 95% CI 0.66 to 0.80) | 906 |
Comparison 1 Convection (haemofiltration/haemodiafiltration/acetate‐free biofiltration) versus haemodialysis, Outcome 7 Hypotension during dialysis (rate/person‐years follow‐up).

Comparison 1 Convection (haemofiltration/haemodiafiltration/acetate‐free biofiltration) versus haemodialysis, Outcome 8 Dialysis sessions with hypotension.

Comparison 1 Convection (haemofiltration/haemodiafiltration/acetate‐free biofiltration) versus haemodialysis, Outcome 9 Predialysis blood pressure.
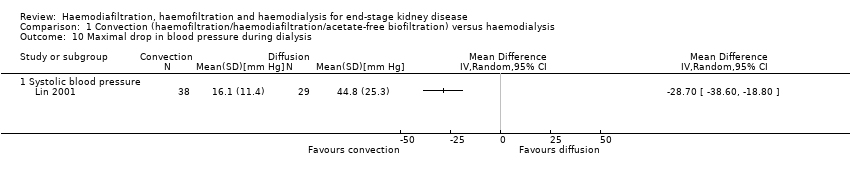
Comparison 1 Convection (haemofiltration/haemodiafiltration/acetate‐free biofiltration) versus haemodialysis, Outcome 10 Maximal drop in blood pressure during dialysis.

Comparison 1 Convection (haemofiltration/haemodiafiltration/acetate‐free biofiltration) versus haemodialysis, Outcome 11 Kidney diseases questionnaire and well‐being scores.

Comparison 1 Convection (haemofiltration/haemodiafiltration/acetate‐free biofiltration) versus haemodialysis, Outcome 12 Kt/V.

Comparison 1 Convection (haemofiltration/haemodiafiltration/acetate‐free biofiltration) versus haemodialysis, Outcome 13 Urea reduction ratio.

Comparison 1 Convection (haemofiltration/haemodiafiltration/acetate‐free biofiltration) versus haemodialysis, Outcome 14 Predialysis serum B2 microglobulin.

Comparison 1 Convection (haemofiltration/haemodiafiltration/acetate‐free biofiltration) versus haemodialysis, Outcome 15 B2 microglobulin clearance.
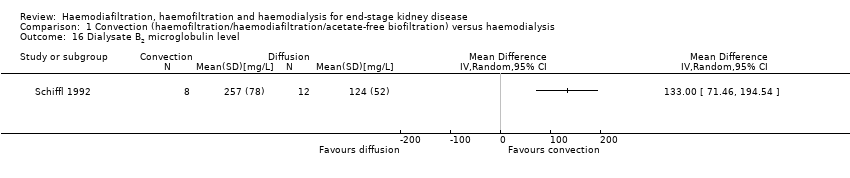
Comparison 1 Convection (haemofiltration/haemodiafiltration/acetate‐free biofiltration) versus haemodialysis, Outcome 16 Dialysate B2 microglobulin level.
| Study | Convective therapy | Diffusive therapy | P value from paper |
| Hospitalisation | |||
| Verzetti 1998 | 8 | 17 | Not reported |
| Patients experiencing hypotension | |||
| Fox 1993 | 1/9 | 0/9 | Not reported |
| Karamperis 2005 | 0/12 | 0/12 | Not significant |
| Pedrini 2011a | 2/62 | 5/62 | Not reported |
| Teo 1987 | 0/10 | 0/10 | Not reported |
| Intradialytic hypotensive events | |||
| Selby 2006a | 23 | 37 | Not significant |
| Stefansson 2012 | 32 dialysis sessions with hypotension from a total of 520 sessions | 28 dialysis sessions with hypotension from a total of 520 sessions | Not significant |
| Symptomatic intradialytic hypotensive events | |||
| Selby 2006a | 2 | 2 | Not significant |
| Predialysis systolic blood pressure (mm Hg) | |||
| Karamperis 2005 | 12 patients | 12 patients | Not significant |
| Noris 1998 | 5 patients | 5 patients | P > 0.05 |
| Pedrini 2011a | 62 patients | 62 patients | P = 0.014 |
| Stefansson 2012 | 20 patients | 20 patients | Not reported |
| Todeschini 2002 | 9 patients | 9 patients | P > 0.05 |
| Predialysis diastolic blood pressure (mm Hg) | |||
| Karamperis 2005 | 12 patients | 12 patients | Not significant |
| Noris 1998 | 5 patients | 5 patients | P > 0.05 |
| Pedrini 2011a | 62 patients | 62 patients | P = 0.05 |
| Stefansson 2012 | 20 patients | 20 patients | Not reported |
| Todeschini 2002 | 9 patients | 9 | P > 0.05 |
| Predialysis mean arterial pressure (mm Hg) | |||
| Karamperis 2005 | 12 patients | 12 patients | Not significant |
| Teo 1987 | 10 patients | 10 patients | "Statistically insignificant" |
| Postdialysis systolic blood pressure (mm Hg) | |||
| Karamperis 2005 | 12 patients | 12 patients | Not significant |
| Noris 1998 | 5 patients | 5 patients | P > 0.05 |
| Pedrini 2011a | 62 patients | 62 patients | "not differ significantly" |
| Stefansson 2012 | 20 patients | 20 patients | Not reported |
| Todeschini 2002 | 9 patients | 9 patients | P > 0.05 |
| Postdialysis diastolic blood pressure (mm Hg) | |||
| Karamperis 2005 | 12 patients | 12 patients | Not significant |
| Pedrini 2011a | 62 patients | 62 patients | "not differ significantly" |
| Stefansson 2012 | 20 patients | 20 patients | Not reported |
| Postdialysis fall in systolic blood pressure (mm Hg) | |||
| Todeschini 2002 | 9 patients | 9 patients | P > 0.05 |
| Postdialysis mean arterial pressure (mm Hg) | |||
| Karamperis 2005 | 12 patients | 12 patients | Not significant |
| Teo 1987 | 10 patients | 10 patients | "Statistically insignificant" |
| Difference between pre‐ and postdialysis systolic blood pressure (mm Hg) | |||
| Noris 1998 | 5 patients | 5 patients | P > 0.05 |
| Difference between pre‐ and postdialysis diastolic blood pressure (mm Hg) | |||
| Noris 1998 | 5 patients | 5 patients | P > 0.05 |
| Todeschini 2002 | 9 patients | 9 patients | P > 0.05 |
| Intradialysis mean systolic blood pressure (mm Hg) | |||
| Selby 2006a | 12 patients | 12 patients | P < 0.0001 |
| Intradialysis mean diastolic blood pressure (mm Hg) | |||
| Selby 2006a | 12 patients | 12 patients | P = 0.005 |
| Intradialysis mean arterial pressure (mm Hg) | |||
| Selby 2006a | 12 patients | 12 patients | P < 0.0001 |
| Teo 1987 | 10 patients | 10 patients | "statistically insignificant decrease" |
| Kt/V | |||
| Basile 2001 | 10 patients | 10 patients | No significant difference |
| Kantartzi 2013 | 48 patients | 48 patients | P = 0.33 |
| Karamperis 2005 | 12 patients | 12 patients | No significant difference |
| Noris 1998 | 5 patients | 5 patients | P > 0.05 |
| Pedrini 2011a | 62 patients Mean (± SE): 1.60 (0.31) | 62 patients Mean (± SE): 1.44 (0.26) | P < 0.0001 |
| Righetti 2010 | 24 patients | 24 patients | P < 0.01 |
| Selby 2006a | 12 patients Mean (± SE): 1.37 (0.28) | 12 patients Mean (± SE): 1.38 (0.32) | P = 0.91 |
| Stefansson 2012 | 20 patients | 20 patients | Not reported |
| Todeschini 2002 | 9 patients | 9 patients | P > 0.05 |
| Tuccillo 2002 | 12 patients | 12 patients | P > 0.05 |
| Urea reduction ratio | |||
| Righetti 2010 | 24 patients | 24 patients | P < 0.01 |
| Predialysis serum B2 microglobulin level (mg/L) | |||
| Kantartzi 2013 | 48 patients | 48 patients | P < 0.01 |
| Pedrini 2011a | 62 patients | 62 patients | P < 0.0001 |
| Righetti 2010 | 24 patients | 24 patients | P < 0.01 |
| Stefansson 2012 | 20 patients | 20 patients | Not reported |
Comparison 1 Convection (haemofiltration/haemodiafiltration/acetate‐free biofiltration) versus haemodialysis, Outcome 17 Data from cross‐over studies.

Comparison 2 Convection versus convection (haemofiltration versus haemodiafiltration), Outcome 1 All‐cause mortality.

Comparison 2 Convection versus convection (haemofiltration versus haemodiafiltration), Outcome 2 Predialysis blood pressure.

Comparison 2 Convection versus convection (haemofiltration versus haemodiafiltration), Outcome 3 Kt/V.
| Study | Haemodiafiltraton | Haemofiltration | P value from paper |
| Days spent in hospital | |||
| Altieri 2004 | 30 patients | 30 patients | Not significant |
| Average number of episodes of hypotension/patient/month | |||
| Altieri 2004 | 30 patients | 30 patients | P = 0.0169 |
| Number of patients experiencing hypotension | |||
| Altieri 2004 | 2/30 | 0/30 | P > 0.05 |
| Predialysis systolic blood pressure (mm Hg) | |||
| Altieri 2004 | 30 patients | 30 patients | P = 0.044 |
| Predialysis diastolic blood pressure (mm Hg) | |||
| Altieri 2004 | 30 patients | 30 patients | P > 0.05 |
| Predialysis mean arterial pressure (mm Hg) | |||
| Altieri 2004 | 30 patients | 30 patients | P > 0.05 |
| Postdialysis systolic blood pressure (mm Hg) | |||
| Altieri 2004 | 30 patients | 30 patients | P > 0.05 |
| Postdialysis diastolic blood pressure (mm Hg) | |||
| Altieri 2004 | 30 patients | 30 patients Mean (± SD): 74.5 (7.9) | P > 0.05 |
| Postdialysis mean arterial blood pressure (mm Hg) | |||
| Altieri 2004 | 30 patients | 30 patients | P > 0.05 |
| Number of patients experiencing hypertension | |||
| Altieri 2004 | 6/30 | 7/30 | P > 0.05 |
| Kt/V | |||
| Altieri 2004 | 30 patients | 30 patients | P < 0.001 |
| Predialysis serum B2 microglobulin (mg/L) | |||
| Altieri 2004 | 30 patients | 30 patients | Not significant |
| B2 microglobulin clearance (mL/min) | |||
| Meert 2009 | 14 patients | 14 patients | P < 0.017 |
Comparison 2 Convection versus convection (haemofiltration versus haemodiafiltration), Outcome 4 Data from cross‐over studies.
| Study | Haemodiafiltration | Acid‐free biofiltration | P value from paper |
| Number of hospitalisations/patient during observation period | |||
| Movilli 1996 | 12 patients | 12 patients | Not significant |
| Length of hospitalisation stay/patient (days/patient) | |||
| Movilli 1996 | 12 patients | 12 patients | Not significant |
| Number of dialysis sessions with hypotension | |||
| Coll 2009 | 21 patients 7/545 sessions | 21 patients 46/545 sessions | "On‐line HDF was associated with fewer hypotensive episodes than treatment with on‐line HDF without acetate (P=0.019)" |
| Movilli 1996 | 12 patients | 12 patients | Not significant |
| Predialysis systolic blood pressure (mm Hg) | |||
| Ding 2002 | 9 patients | 9 patients | Not significant |
| Predialysis mean arterial pressure (mm Hg) | |||
| Ding 2002 | 9 patients | 9 patients | Not reported |
| Postdialysis systolic blood pressure (mm Hg) | |||
| Ding 2002 | 9 patients | 9 patients | Not significant |
| Interdialysis symptom score | |||
| Ding 2002 | 9 patients | 9 patients | Not significant |
| Kt/V | |||
| Movilli 1996 | 12 patients | 12 patients | Not significant |
| Urea reduction ratio | |||
| Ding 2002 | 9 patients | 9 patients | Not significant |
| Predialysis B2 microglobulin (mg/L) | |||
| Coll 2009 | 21 patients Mean (± SD): 27.7 (7.2) | 21 patients Mean (± SD): 27.4 (6.7) | Not significant |
| Ding 2002 | 9 patients | 9 patients | Not significant |
| Number of dialysis sessions with side effects (nausea, vomiting, headaches) | |||
| Movilli 1996 | 12 patients | 12 patients | Not significant |
Comparison 3 Convection versus convection (haemodiafiltration versus acetate‐free biofiltration), Outcome 1 Data from cross‐over studies.
| Convective compared with diffusive dialysis modalities for men and women with end‐stage kidney disease | ||||||
| Patient or population: men and women with end‐stage kidney disease Intervention: convective dialysis Comparison: diffusive dialysis | ||||||
| Outcomes | Illustrative comparative risks* (95% CI) | Relative effect | No of participants | Quality of the evidence | Comments | |
| Assumed risk | Corresponding risk | |||||
| Diffusion | Convection | |||||
| All‐cause mortality | 200 per 1000 | Not significant | RR 0.87 (0.72 to 1.05) | 11 (3396) | ⊕⊕⊝⊝ | Convective therapy has little or no effect on all‐cause mortality |
| Cardiovascular mortality | 100 per 1000 | 75 per 1000 | RR 0.75 (0.81 to 0.92) | 6 (2889) | ⊕⊕⊝⊝ | Convective therapy may reduce cardiovascular mortality |
| Nonfatal cardiovascular events | 130 per 1000 | Not significant | RR 1.23 (0.93‐1.63) | 2 (1688) | ⊕⊝⊝⊝ | Convective therapy has uncertain effects on non‐fatal cardiovascular events |
| Health‐related quality of life | Not estimable | Not estimable | Not estimable | 8 (988) | ⊕⊕⊝⊝ | Convective therapy has uncertain effects on health‐related quality of life |
| *The assumed risk (e.g. the median control group risk across studies) is derived from data within dialysis registries for all‐cause mortality and cardiovascular mortality and the reported event rate in the available study for nonfatal cardiovascular events (CONTRAST (Dutch) Study 2005). The corresponding risk (and its 95% confidence interval) is based on the assumed risk in the comparison group and the relative effect of the intervention (and its 95% CI). CI: Confidence interval; RR: Risk Ratio | ||||||
| GRADE (Grading of Recommendations Assessment, Development, and Evaluation) Working Group grades of evidence (Guyatt 2011). | ||||||
| Study ID | Intervention | Duration | Number of patients |
| HDF versus HF | 12 months | 39 | |
| HDF versus HD | 2 weeks | 14 | |
| AFB versus HD | 12 months | 11 | |
| HF versus HD | 12 months | 40 | |
| HF versus HDF versus HD | 18 months | 146 | |
| AFB versus HDF | 15 months | 30 | |
| HDF versus HD | 36 months | 714 | |
| HDF versus HD | 1 session | 12 | |
| HDF versus AFB | 36 weeks | 12 | |
| AFB versus HD | 12 months | 20 | |
| HDF versus HD | 36 months | 906 | |
| HF versus HD | 1 session | 9 | |
| HDF versus HD | 3 months | 24 | |
| HDF versus HD | 2 sessions | 12 | |
| HDF versus HD | 15 months | 67 | |
| HDF versus HD | 24 months | 205 | |
| HDF versus HD | 1 session | 8 | |
| HDF versus HD | 6 weeks | 8 | |
| HDF versus HF | 9 weeks | 14 | |
| HDF versus AFB | 6 months | 12 | |
| AFB versus HD | 1 week | 5 | |
| HDF versus HD | 12 months | 22 | |
| HDF versus HD | 12 months | 69 | |
| HF versus HD | 24 months | 48 | |
| HDF versus HD | 18 months | 24 | |
| AFB versus HD | 48 months | 371 | |
| HF versus HD | 36 months | 64 | |
| HF versus HD | 48 months | 32 | |
| HDF versus HD | 48 months | 76 | |
| AFB versus HD | 12 months | 24 | |
| AFB versus HD | 4 weeks | 12 | |
| HDF versus HD | 4 months | 20 | |
| HDF versus HD | 8 months | 13 | |
| AFB versus HD | 3 sessions | 9 | |
| HDF versus HD | 3 months | 12 | |
| HDF versus HD | 24 months | 782 | |
| HDF versus HD | 48 weeks | 129 | |
| AFB versus HD | 12 months | 41 | |
| HDF versus HD | 12 months | 50 | |
| HDF versus HD | 24 months | 44 | |
| AFB ‐ acetate‐free biofiltration; HDF ‐ haemodiafiltration; HD ‐ haemodialysis; HF ‐ haemofiltration | |||
| Categories of intervention | Study | Total number of studies | Total number of patients |
| HDF versus HD | Bammens 2004; Lin 2001; Locatelli 1994; Lornoy 1998; Teo 1987; Tuccillo 2002; Ward 2000; Wizemann 2000; Bolasco 2003; CONTRAST (Dutch) Study 2005; Cristofano 2004; Karamperis 2005; Mandolfo 2008; Pedrini 2011a; Righetti 2010; Schiffl 2007; Stefansson 2012; TURKISH HDF 2013; Vaslaki 2006ESHOL Study 2011; Kantartzi 2013; Ohtake 2012 | 22 | 3299 |
| HF versus HD | Beerenhout 2005; Fox 1993; Schiffl 1992; Bolasco 2003; Santoro 2005a; PROFIL Study 2011 | 6 | 325 |
| AFB versus HD | Basile 2001; Santoro 1999; Eiselt 2000; Noris 1998; Schrander vd Meer 1998; Selby 2006a; Todeschini 2002; Verzetti 1998 | 8 | 487 |
| HDF versus AFB | 3 | 59 | |
| HDF versus HF | 3 | 199 | |
| More than two treatment arms | 3 | 383 | |
| AFB ‐ acetate‐free biofiltration; HDF ‐ haemodiafiltration; HD ‐ haemodialysis; HF ‐ haemofiltration | |||
| Study ID | Comparison | Quality of Life scale used | Time of assessment | End of study result | Selective reporting of quality of life dimensions |
| HF versus HD | Kidney Disease Questionnaire | Before randomisation, at 6 months and at 1 year | No significant difference in scores in all five components of the scoring system between interventions | Yes | |
| HDF versus HD | Kidney Disease Quality of Life‐Short Form | Median follow‐up | There were no significant differences in changes in health‐related quality of life over time between groups (generic or kidney‐disease specific domains) | No | |
| HDF versus HD | SF‐36 | At 3 months | There were statistical significant differences in QoL for the total SF‐36 (36.1 (26.7 to 45.7) and 40.7 (30.2 to 62.8)), for classic low‐flux HD and high‐flux HDF, for bodily pain (45 (26.9 to 66.9) and 55 (35.6 to 87.5)), and No data were available for the end of the first phase of treatment | No | |
| HDF versus HD | Patient well‐being score | Once weekly for 15 months | Patients on HDF had significantly better scores ((physical well‐being score) MD 0.60, 95% CI 0.30 to 0.90). | No | |
| HDF versus HD | Kidney Disease | after 52 weeks | None of the other dimensions of the KDQ showed a change during the course of the study No data were available for the end of the first phase of treatment | Yes | |
| HDF versus HD | Physical functioning domain of IQOLA SF‐36 questionnaire | At day 60 | With the exception of a lower score for social functioning with HDF (P < 0.05), there was no significant difference in quality of life between HD and HDF No data were available for the end of the first phase of treatment | No | |
| AFB | Subjective well‐being | Monthly | Reported well‐being significantly higher in patients receiving AFB in multivariate analysis although unclear whether between‐groups comparison was reported No data were available for the end of the first phase of treatment | No | |
| HDF versus HD | Kidney Disease Questionnaire | At 6 months and 1 year | No significant difference in scores in all five components of the scoring system between interventions | No | |
| AFB ‐ acetate‐free biofiltration; HDF ‐ haemodiafiltration; HD ‐ haemodialysis; HF ‐ haemofiltration; SF‐36 ‐ Short‐Form Health Survey with 36 questions | |||||
| Outcome or subgroup title | No. of studies | No. of participants | Statistical method | Effect size |
| 1 All‐cause mortality Show forest plot | 11 | 3396 | Risk Ratio (IV, Random, 95% CI) | 0.87 [0.72, 1.05] |
| 2 Cardiovascular mortality Show forest plot | 6 | 2889 | Risk Ratio (IV, Random, 95% CI) | 0.75 [0.61, 0.92] |
| 3 Nonfatal cardiovascular event (rate/person‐years follow‐up) Show forest plot | 1 | Risk Ratio (IV, Random, 95% CI) | Totals not selected | |
| 4 Hospitalisation Show forest plot | 2 | Mean Difference (IV, Random, 95% CI) | Subtotals only | |
| 4.1 Hospital admissions/year | 1 | 45 | Mean Difference (IV, Random, 95% CI) | 0.20 [‐0.07, 0.47] |
| 4.2 Days spent in hospital | 2 | 67 | Mean Difference (IV, Random, 95% CI) | ‐1.22 [‐7.47, 5.03] |
| 5 Hospitalisation (rate/person‐years follow‐up) Show forest plot | 2 | 400 | Risk Ratio (IV, Random, 95% CI) | 1.23 [0.93, 1.63] |
| 6 Change of dialysis modality Show forest plot | 5 | 2919 | Risk Ratio (IV, Random, 95% CI) | 0.87 [0.41, 1.84] |
| 7 Hypotension during dialysis (rate/person‐years follow‐up) Show forest plot | Other data | No numeric data | ||
| 8 Dialysis sessions with hypotension Show forest plot | 2 | 42 | Mean Difference (IV, Random, 95% CI) | ‐4.05 [‐15.39, 7.30] |
| 9 Predialysis blood pressure Show forest plot | 7 | Mean Difference (IV, Random, 95% CI) | Subtotals only | |
| 9.1 Systolic blood pressure | 7 | 1859 | Mean Difference (IV, Random, 95% CI) | 1.19 [‐1.46, 3.84] |
| 9.2 Diastolic blood pressure | 6 | 1154 | Mean Difference (IV, Random, 95% CI) | ‐0.25 [‐1.06, 0.56] |
| 10 Maximal drop in blood pressure during dialysis Show forest plot | 1 | Mean Difference (IV, Random, 95% CI) | Totals not selected | |
| 10.1 Systolic blood pressure | 1 | Mean Difference (IV, Random, 95% CI) | 0.0 [0.0, 0.0] | |
| 11 Kidney diseases questionnaire and well‐being scores Show forest plot | 3 | Mean Difference (IV, Random, 95% CI) | Subtotals only | |
| 11.1 Inter‐dialysis patient well‐being score | 1 | 67 | Mean Difference (IV, Random, 95% CI) | 0.60 [0.30, 0.90] |
| 11.2 Physical symptoms | 2 | 121 | Mean Difference (IV, Random, 95% CI) | ‐0.54 [‐1.52, 0.44] |
| 11.3 Fatigue | 1 | 45 | Mean Difference (IV, Random, 95% CI) | 0.0 [‐0.98, 0.98] |
| 11.4 Depression | 1 | 45 | Mean Difference (IV, Random, 95% CI) | 0.20 [‐0.50, 0.90] |
| 11.5 Relationships | 1 | 45 | Mean Difference (IV, Random, 95% CI) | 0.10 [‐0.73, 0.93] |
| 11.6 Frustration | 1 | 45 | Mean Difference (IV, Random, 95% CI) | ‐0.20 [‐1.61, 1.21] |
| 12 Kt/V Show forest plot | 14 | 2022 | Mean Difference (IV, Random, 95% CI) | 0.07 [‐0.00, 0.14] |
| 13 Urea reduction ratio Show forest plot | 3 | 879 | Std. Mean Difference (IV, Random, 95% CI) | 0.39 [0.06, 0.72] |
| 14 Predialysis serum B2 microglobulin Show forest plot | 12 | 1813 | Mean Difference (IV, Random, 95% CI) | ‐5.55 [‐9.11, ‐1.98] |
| 15 B2 microglobulin clearance Show forest plot | 3 | 65 | Mean Difference (IV, Random, 95% CI) | 13.05 [‐5.94, 32.04] |
| 16 Dialysate B2 microglobulin level Show forest plot | 1 | Mean Difference (IV, Random, 95% CI) | Totals not selected | |
| 17 Data from cross‐over studies Show forest plot | Other data | No numeric data | ||
| 17.1 Hospitalisation | Other data | No numeric data | ||
| 17.2 Patients experiencing hypotension | Other data | No numeric data | ||
| 17.3 Intradialytic hypotensive events | Other data | No numeric data | ||
| 17.4 Symptomatic intradialytic hypotensive events | Other data | No numeric data | ||
| 17.5 Predialysis systolic blood pressure (mm Hg) | Other data | No numeric data | ||
| 17.6 Predialysis diastolic blood pressure (mm Hg) | Other data | No numeric data | ||
| 17.7 Predialysis mean arterial pressure (mm Hg) | Other data | No numeric data | ||
| 17.8 Postdialysis systolic blood pressure (mm Hg) | Other data | No numeric data | ||
| 17.9 Postdialysis diastolic blood pressure (mm Hg) | Other data | No numeric data | ||
| 17.10 Postdialysis fall in systolic blood pressure (mm Hg) | Other data | No numeric data | ||
| 17.11 Postdialysis mean arterial pressure (mm Hg) | Other data | No numeric data | ||
| 17.12 Difference between pre‐ and postdialysis systolic blood pressure (mm Hg) | Other data | No numeric data | ||
| 17.13 Difference between pre‐ and postdialysis diastolic blood pressure (mm Hg) | Other data | No numeric data | ||
| 17.14 Intradialysis mean systolic blood pressure (mm Hg) | Other data | No numeric data | ||
| 17.15 Intradialysis mean diastolic blood pressure (mm Hg) | Other data | No numeric data | ||
| 17.16 Intradialysis mean arterial pressure (mm Hg) | Other data | No numeric data | ||
| 17.17 Kt/V | Other data | No numeric data | ||
| 17.18 Urea reduction ratio | Other data | No numeric data | ||
| 17.19 Predialysis serum B2 microglobulin level (mg/L) | Other data | No numeric data | ||
| Outcome or subgroup title | No. of studies | No. of participants | Statistical method | Effect size |
| 1 All‐cause mortality Show forest plot | 1 | Risk Ratio (M‐H, Random, 95% CI) | Totals not selected | |
| 2 Predialysis blood pressure Show forest plot | 1 | Mean Difference (IV, Random, 95% CI) | Totals not selected | |
| 2.1 Systolic blood pressure | 1 | Mean Difference (IV, Random, 95% CI) | 0.0 [0.0, 0.0] | |
| 2.2 Diastolic blood pressure | 1 | Mean Difference (IV, Random, 95% CI) | 0.0 [0.0, 0.0] | |
| 3 Kt/V Show forest plot | 1 | Mean Difference (IV, Random, 95% CI) | Totals not selected | |
| 4 Data from cross‐over studies Show forest plot | Other data | No numeric data | ||
| 4.1 Days spent in hospital | Other data | No numeric data | ||
| 4.2 Average number of episodes of hypotension/patient/month | Other data | No numeric data | ||
| 4.3 Number of patients experiencing hypotension | Other data | No numeric data | ||
| 4.4 Predialysis systolic blood pressure (mm Hg) | Other data | No numeric data | ||
| 4.5 Predialysis diastolic blood pressure (mm Hg) | Other data | No numeric data | ||
| 4.6 Predialysis mean arterial pressure (mm Hg) | Other data | No numeric data | ||
| 4.7 Postdialysis systolic blood pressure (mm Hg) | Other data | No numeric data | ||
| 4.8 Postdialysis diastolic blood pressure (mm Hg) | Other data | No numeric data | ||
| 4.9 Postdialysis mean arterial blood pressure (mm Hg) | Other data | No numeric data | ||
| 4.10 Number of patients experiencing hypertension | Other data | No numeric data | ||
| 4.11 Kt/V | Other data | No numeric data | ||
| 4.12 Predialysis serum B2 microglobulin (mg/L) | Other data | No numeric data | ||
| 4.13 B2 microglobulin clearance (mL/min) | Other data | No numeric data | ||
| Outcome or subgroup title | No. of studies | No. of participants | Statistical method | Effect size |
| 1 Data from cross‐over studies Show forest plot | Other data | No numeric data | ||
| 1.1 Number of hospitalisations/patient during observation period | Other data | No numeric data | ||
| 1.2 Length of hospitalisation stay/patient (days/patient) | Other data | No numeric data | ||
| 1.3 Number of dialysis sessions with hypotension | Other data | No numeric data | ||
| 1.4 Predialysis systolic blood pressure (mm Hg) | Other data | No numeric data | ||
| 1.5 Predialysis mean arterial pressure (mm Hg) | Other data | No numeric data | ||
| 1.6 Postdialysis systolic blood pressure (mm Hg) | Other data | No numeric data | ||
| 1.7 Interdialysis symptom score | Other data | No numeric data | ||
| 1.8 Kt/V | Other data | No numeric data | ||
| 1.9 Urea reduction ratio | Other data | No numeric data | ||
| 1.10 Predialysis B2 microglobulin (mg/L) | Other data | No numeric data | ||
| 1.11 Number of dialysis sessions with side effects (nausea, vomiting, headaches) | Other data | No numeric data | ||