Bifosfonatos para el cáncer de próstata avanzado
Información
- DOI:
- https://doi.org/10.1002/14651858.CD006250.pub2Copiar DOI

- Base de datos:
-
- Cochrane Database of Systematic Reviews
- Versión publicada:
-
- 26 diciembre 2017see what's new
- Tipo:
-
- Intervention
- Etapa:
-
- Review
- Grupo Editorial Cochrane:
-
Grupo Cochrane de Urología
- Copyright:
-
- Copyright © 2017 The Cochrane Collaboration. Published by John Wiley & Sons, Ltd.
Cifras del artículo
Altmetric:
Citado por:
Autores
Contributions of authors
SM: data extraction and analysis, drafting of final review.
IM: developed and ran search strategies and provided databases.
FJ: clinical expertise.
KJ: clinical expertise.
KKY: clinical expertise for the first version of this review.
AH: clinical expertise.
NS: data extraction and analysis, content and methodologic input.
Sources of support
Internal sources
-
University Hospital of Cologne, Department I of Internal Medicine, Germany.
External sources
-
No sources of support supplied
Declarations of interest
SM: none known.
IM: none known.
FJ: received payment for lectures from MSD, Riemser and Tesaro; received travel, accommodation or meeting expenses from Pfizer, Roche, Tesaro.
KJ: received payment for lectures from Amgen.
KKY: none known.
AH: none known.
NS: none known.
Acknowledgements
The authors of the first version of this review would like to thank Mrs Bernadette Coles MSc for developing and running the search strategies for this review.
We thank the authors of the first published version of this review, Mike Shelley, Wai Man Sze, Timothy J Wilt and Malcolm D Mason.
We thank the Cochrane Urology Group for their support, including the editors for their feedback on this review. We also thank the referees for their appreciated feedback: Stefan Krause, Stefanie Schmidt and Gunhild von Amsberg.
Version history
| Published | Title | Stage | Authors | Version |
| 2017 Dec 26 | Bisphosphonates for advanced prostate cancer | Review | Sascha Macherey, Ina Monsef, Franziska Jahn, Karin Jordan, Kwok Keung Yuen, Axel Heidenreich, Nicole Skoetz | |
| 2006 Oct 18 | Bisphosphonates for advanced prostate cancer | Review | Kwok Keung Yuen, Mike Shelley, Wai Man Sze, Timothy J. Wilt, Malcolm Mason | |
Differences between protocol and review
We included all trials fitting the inclusion criteria, irrespective of outcomes reported. The protocol and first version of the review included only trials that evaluated pain. However, as this is not in line with the methodologic expectations of Cochrane intervention reviews (MECIR) guidelines, we included all trials irrespective of the outcomes reported.
For continuous outcomes we would have calculated mean differences, or in case different scales would have been used, standardized mean difference (SMD). For time‐to‐event outcomes, we would have extracted the hazard ratio (HR) from published data according to Parmar 1998 and Tierney 2007, but neither continuous outcomes nor time‐to‐event outcomes have been reported.
In contrast to the protocol and the prior version of this review, we did not include trials with active control groups (other bisphosphonates). We initially identified three trials comparing different doses and types of bisphosphonates, but these studies have been designed heterogeneously. As agreed with the Editorial Base, in the final analysis, we subsequently decided to omit analysis of these trials due to potentially imbalanced results with restricted applicability.
Notes
Some passages in this review, especially in the methods part, are from the standard template of the Cochrane Haematological Malignancies Review Group.
Keywords
MeSH
Medical Subject Headings (MeSH) Keywords
- *Prostatic Neoplasms;
- Bisphosphonate‐Associated Osteonecrosis of the Jaw [epidemiology];
- Bone Density Conservation Agents [adverse effects, *therapeutic use];
- Bone Neoplasms [*drug therapy, mortality, *secondary];
- Diphosphonates [adverse effects, *therapeutic use];
- Kidney [drug effects];
- Nausea [chemically induced];
- Pain [*drug therapy, etiology];
- Randomized Controlled Trials as Topic;
Medical Subject Headings Check Words
Humans; Male;
PICO

Study flow diagram.
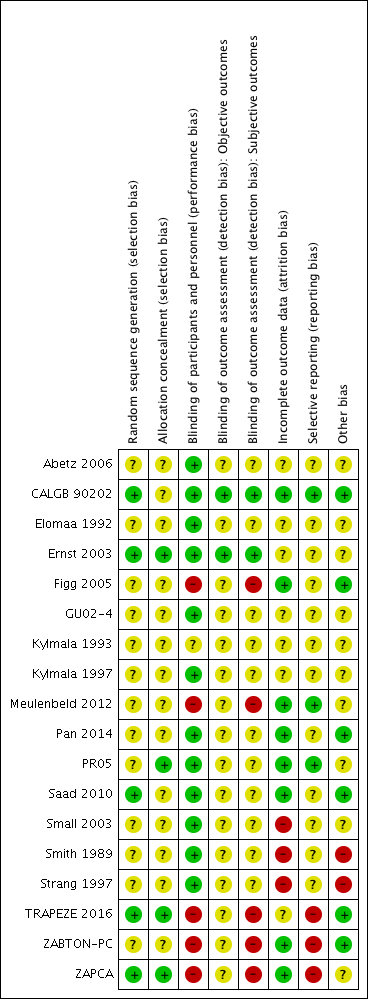
Risk of bias summary: review authors' judgments about each risk of bias item for each included study.

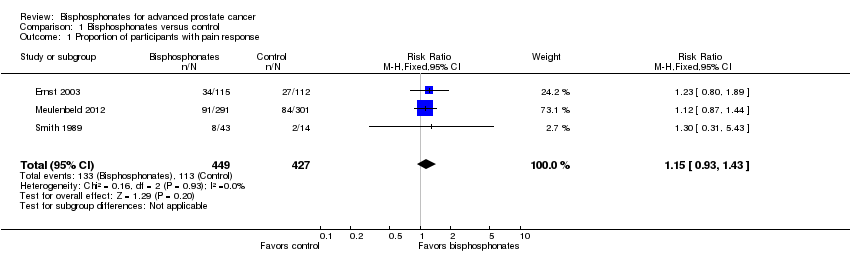
Forest plot of comparison: 1 Bisphosphonates versus control, outcome: 1.1 Proportion of participants with pain response.
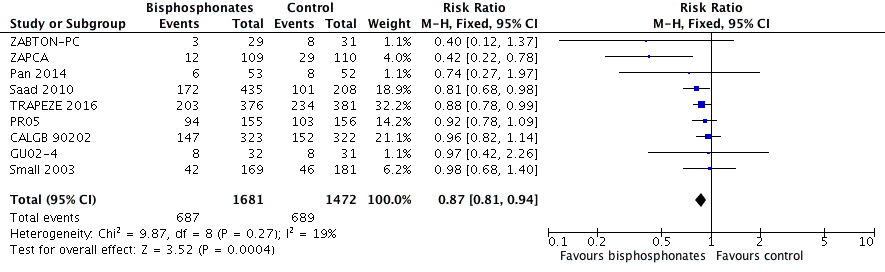
Forest plot of comparison: 1 Bisphosphonates versus control, outcome: 1.2 Skeletal‐related events: any.

Forest plot of comparison: 1 Bisphosphonates versus control, outcome: 1.9 Mortality.
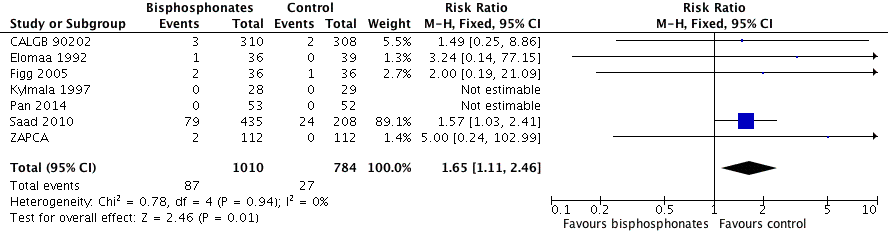
Forest plot of comparison: 1 Bisphosphonates versus control, outcome: 1.11 Adverse events: renal.
Comparison 1 Bisphosphonates versus control, Outcome 1 Proportion of participants with pain response.
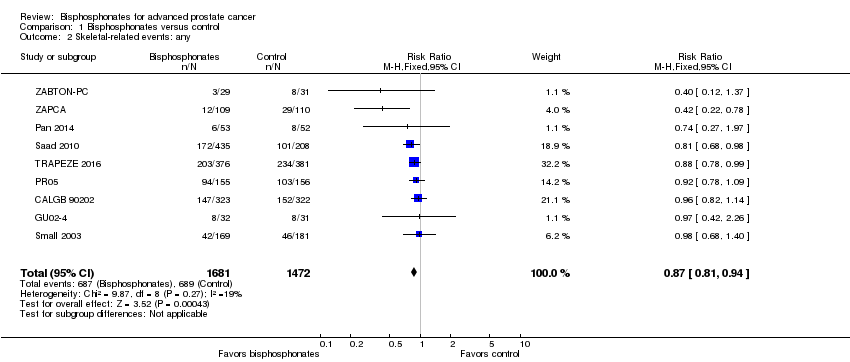
Comparison 1 Bisphosphonates versus control, Outcome 2 Skeletal‐related events: any.
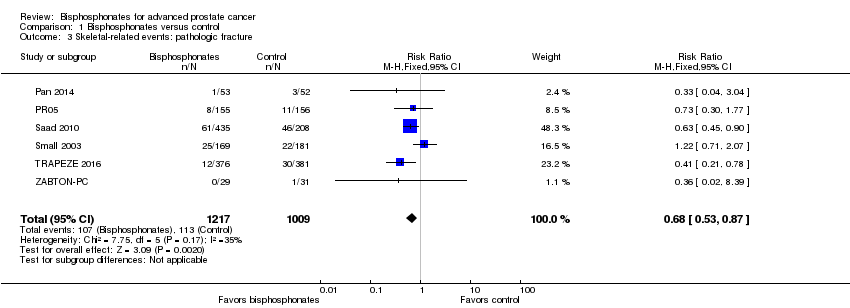
Comparison 1 Bisphosphonates versus control, Outcome 3 Skeletal‐related events: pathologic fracture.
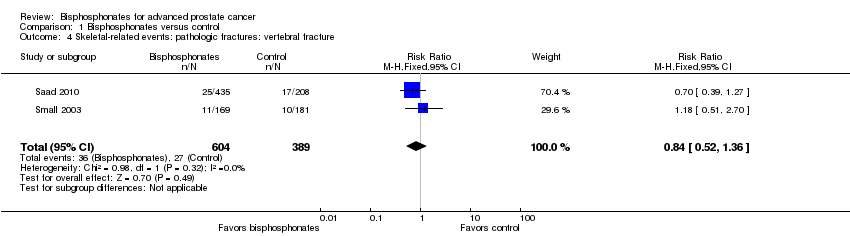
Comparison 1 Bisphosphonates versus control, Outcome 4 Skeletal‐related events: pathologic fractures: vertebral fracture.
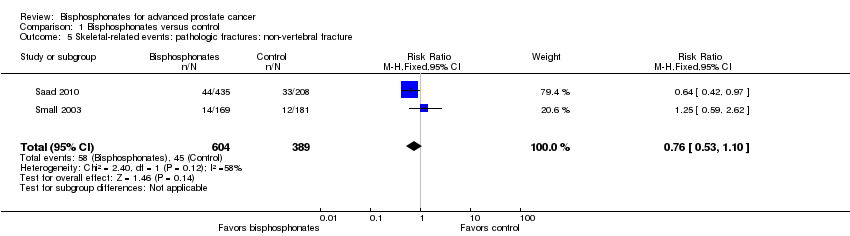
Comparison 1 Bisphosphonates versus control, Outcome 5 Skeletal‐related events: pathologic fractures: non‐vertebral fracture.
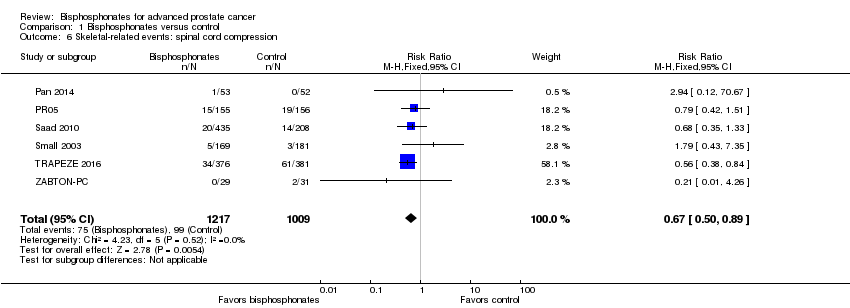
Comparison 1 Bisphosphonates versus control, Outcome 6 Skeletal‐related events: spinal cord compression.
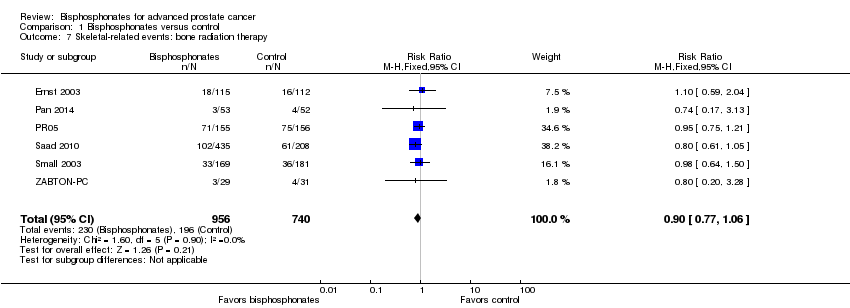
Comparison 1 Bisphosphonates versus control, Outcome 7 Skeletal‐related events: bone radiation therapy.

Comparison 1 Bisphosphonates versus control, Outcome 8 Skeletal‐related events: bone surgery.

Comparison 1 Bisphosphonates versus control, Outcome 9 Mortality.

Comparison 1 Bisphosphonates versus control, Outcome 10 Adverse events: nausea.

Comparison 1 Bisphosphonates versus control, Outcome 11 Adverse events: renal.
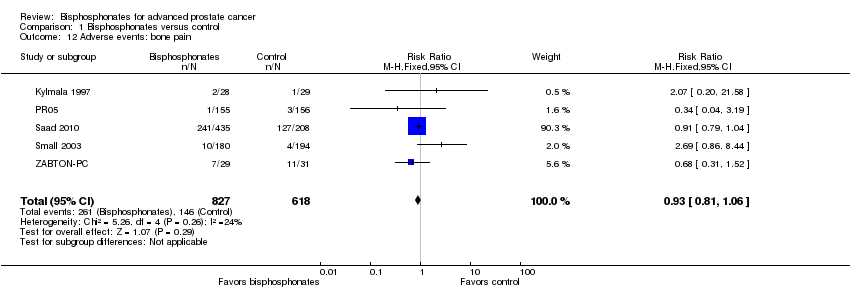
Comparison 1 Bisphosphonates versus control, Outcome 12 Adverse events: bone pain.

Comparison 1 Bisphosphonates versus control, Outcome 13 Adverse events: osteonecrosis of the jaw.

Comparison 1 Bisphosphonates versus control, Outcome 14 Proportion of participants with decreased analgesic consumption.

Comparison 1 Bisphosphonates versus control, Outcome 15 Proportion of participants with disease progression.

Comparison 1 Bisphosphonates versus control, Outcome 16 Sensitivity analysis: pain response (low risk of bias vs high risk of bias).

Comparison 1 Bisphosphonates versus control, Outcome 17 Subgroup analysis: pain response (amino‐bisphosphonate vs non‐amino‐bisphosphonate).
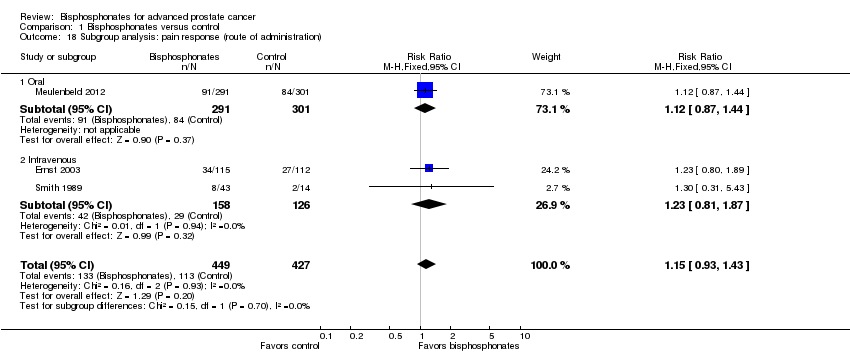
Comparison 1 Bisphosphonates versus control, Outcome 18 Subgroup analysis: pain response (route of administration).

Comparison 1 Bisphosphonates versus control, Outcome 19 Sensitivity analysis: skeletal‐related events (low risk of bias vs high risk of bias).
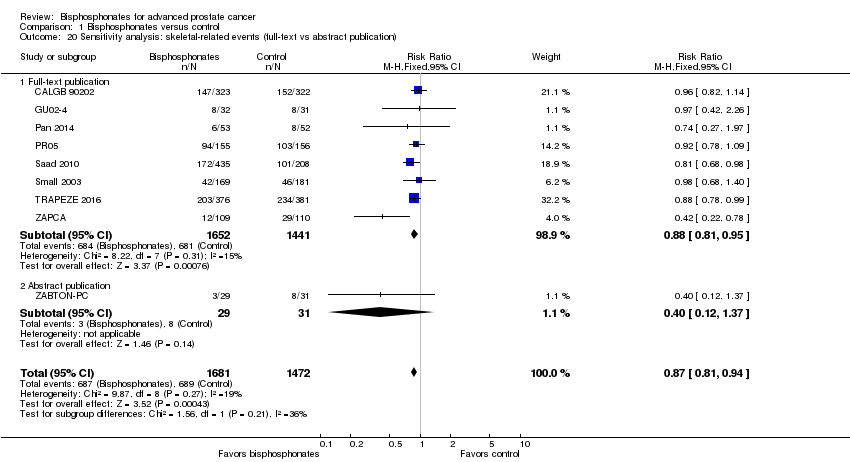
Comparison 1 Bisphosphonates versus control, Outcome 20 Sensitivity analysis: skeletal‐related events (full‐text vs abstract publication).

Comparison 1 Bisphosphonates versus control, Outcome 21 Subgroup analysis: skeletal‐related events (amino‐bisphosphonate versus non‐amino‐bisphosphonate).

Comparison 1 Bisphosphonates versus control, Outcome 22 Subgroup analysis: skeletal‐related events (route of administration).
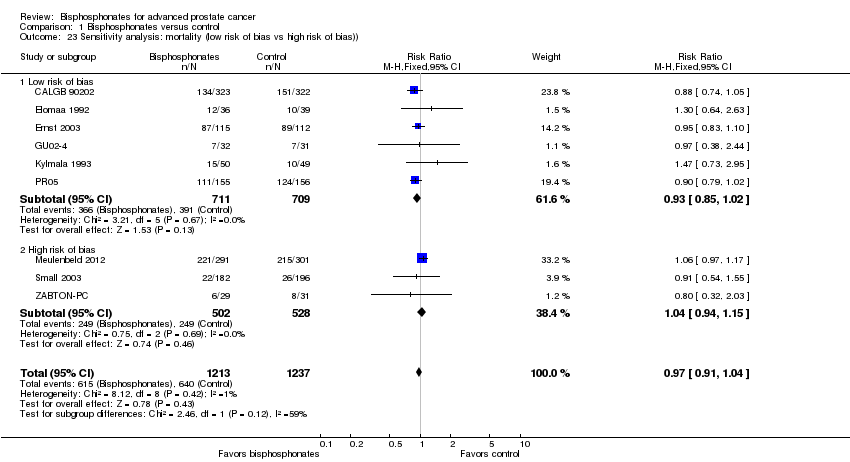
Comparison 1 Bisphosphonates versus control, Outcome 23 Sensitivity analysis: mortality (low risk of bias vs high risk of bias)).
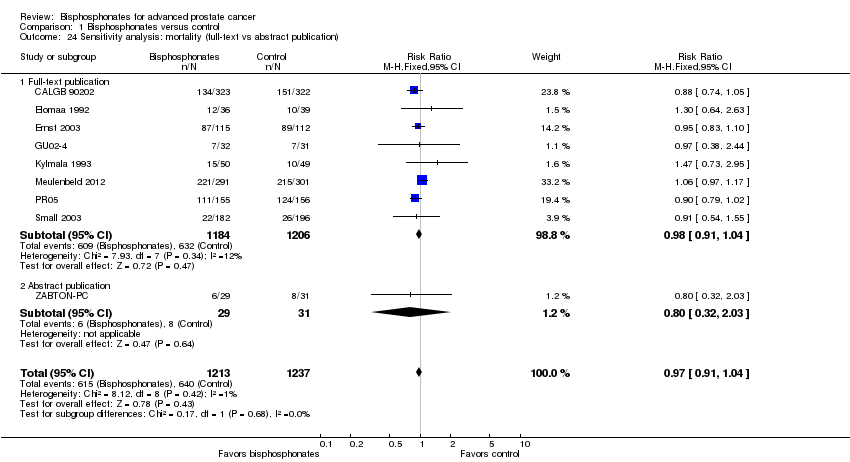
Comparison 1 Bisphosphonates versus control, Outcome 24 Sensitivity analysis: mortality (full‐text vs abstract publication).
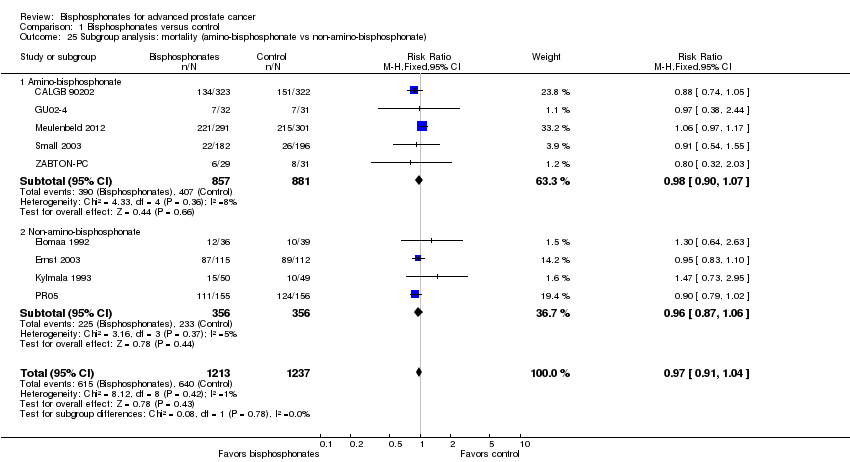
Comparison 1 Bisphosphonates versus control, Outcome 25 Subgroup analysis: mortality (amino‐bisphosphonate vs non‐amino‐bisphosphonate).
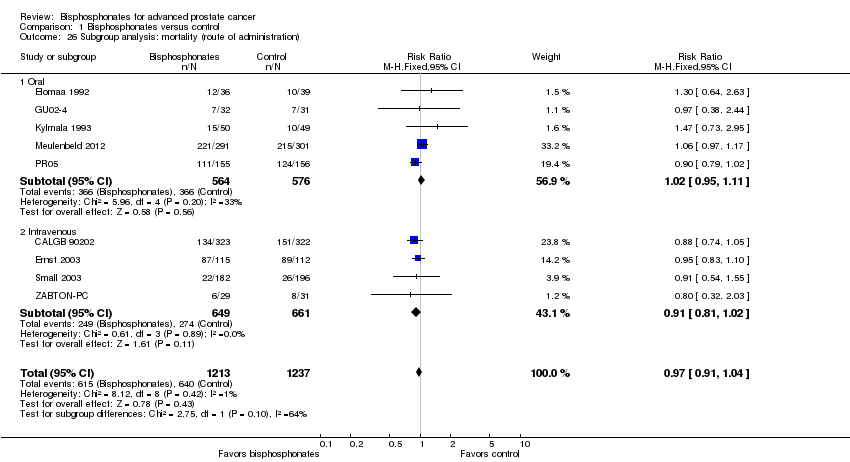
Comparison 1 Bisphosphonates versus control, Outcome 26 Subgroup analysis: mortality (route of administration).

Comparison 1 Bisphosphonates versus control, Outcome 27 Sensitivity analysis: adverse event: nausea (low risk of bias vs high risk of bias).
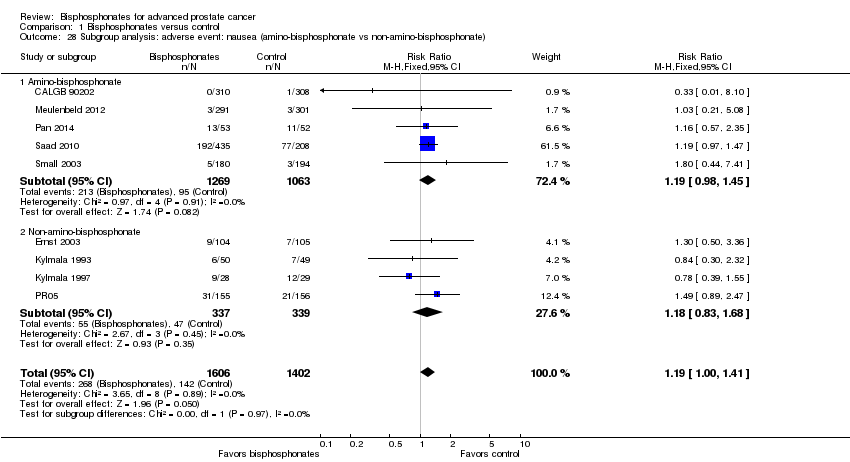
Comparison 1 Bisphosphonates versus control, Outcome 28 Subgroup analysis: adverse event: nausea (amino‐bisphosphonate vs non‐amino‐bisphosphonate).
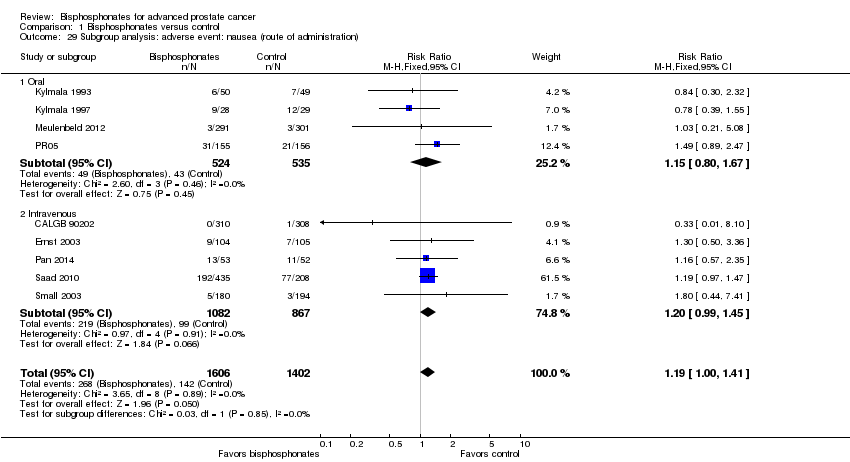
Comparison 1 Bisphosphonates versus control, Outcome 29 Subgroup analysis: adverse event: nausea (route of administration).

Comparison 1 Bisphosphonates versus control, Outcome 30 Sensitivity analysis: renal (low risk of bias vs high risk of bias).
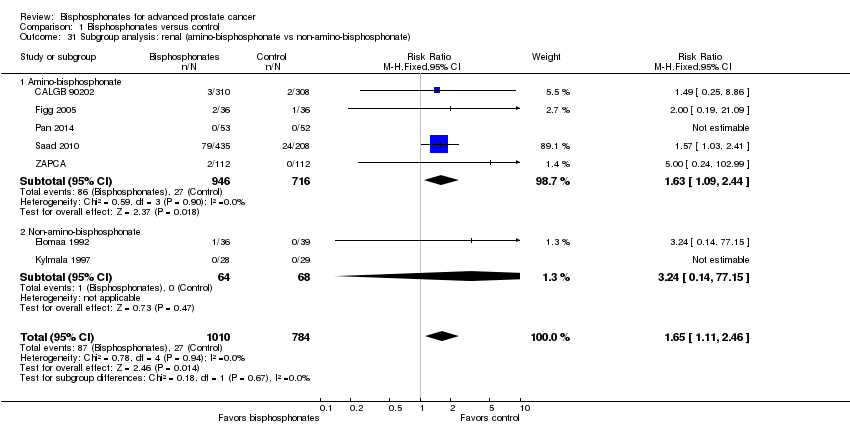
Comparison 1 Bisphosphonates versus control, Outcome 31 Subgroup analysis: renal (amino‐bisphosphonate vs non‐amino‐bisphosphonate).

Comparison 1 Bisphosphonates versus control, Outcome 32 Subgroup analysis: renal (route of administration).
| Bisphosphonates compared to control for advanced prostate cancer | |||||
| Patient or population: men with advanced prostate cancer Settings: ‐ Intervention: bisphosphonate Comparison: control | |||||
| Outcomes | No of participants | Quality of the evidence | Relative effect | Anticipated absolute effects* (95% CI) | |
| Risk with control | Risk difference with bisphosphonates | ||||
| Proportion of participants with pain response Follow‐up: 5‐12 months | 876 | ⊕⊕⊝⊝ | RR 1.15 | Study population | |
| 265 per 1000 | 40 more per 1000 | ||||
| Skeletal‐related events: any, composite outcome | 3153 | ⊕⊕⊕⊝ | RR 0.87 | Study population | |
| 448 per 1000 | 58 fewer per 1000 | ||||
| Mortality | 2450 | ⊕⊕⊕⊝ | RR 0.97 | Study population | |
| 517 per 1000 | 16 fewer per 1000 | ||||
| Quality of life | ‐ | ‐ | Not estimable | ‐ | |
| Adverse events: nausea | 3008 | ⊕⊕⊕⊝ | RR 1.19 | Study population | |
| 35 per 1000 | 7 more per 1000 | ||||
| Adverse events: renal Follow‐up: 5‐36 months | 1794 | ⊕⊕⊕⊝ | RR 1.65 | Study population | |
| 34 per 1000 | 22 more per 1000 | ||||
| Adverse events: osteonecrosis of the jaw | 1626 | ⊕⊝⊝⊝ | RR 1.92 | Study population | |
| 7 per 1000 | 7 more per 1000 | ||||
| Proportion of participants with disease progression | 2115 | ⊕⊕⊕⊝ | RR 0.95 | Study population | |
| 710 per 1000 | 36 fewer per 1000 | ||||
| *The risk in the intervention group (and its 95% confidence interval) is based on the assumed risk in the comparison group and the relative effect of the intervention (and its 95% CI). CI: confidence interval; RCT: randomized controlled trial; RR: risk ratio. | |||||
| GRADE Working Group grades of evidence | |||||
| 1Potential risk of performance, detection and attrition bias leading to downgrading (one point). 2Small number of events leading to downgrading (one point). 3Potential risk of performance and attrition bias leading to downgrading (one point). 4Very small number of events leading to downgrading (two points). | |||||
| Outcome or subgroup title | No. of studies | No. of participants | Statistical method | Effect size |
| 1 Proportion of participants with pain response Show forest plot | 3 | 876 | Risk Ratio (M‐H, Fixed, 95% CI) | 1.15 [0.93, 1.43] |
| 2 Skeletal‐related events: any Show forest plot | 9 | 3153 | Risk Ratio (M‐H, Fixed, 95% CI) | 0.87 [0.81, 0.94] |
| 3 Skeletal‐related events: pathologic fracture Show forest plot | 6 | 2226 | Risk Ratio (M‐H, Fixed, 95% CI) | 0.68 [0.53, 0.87] |
| 4 Skeletal‐related events: pathologic fractures: vertebral fracture Show forest plot | 2 | 993 | Risk Ratio (M‐H, Fixed, 95% CI) | 0.84 [0.52, 1.36] |
| 5 Skeletal‐related events: pathologic fractures: non‐vertebral fracture Show forest plot | 2 | 993 | Risk Ratio (M‐H, Fixed, 95% CI) | 0.76 [0.53, 1.10] |
| 6 Skeletal‐related events: spinal cord compression Show forest plot | 6 | 2226 | Risk Ratio (M‐H, Fixed, 95% CI) | 0.67 [0.50, 0.89] |
| 7 Skeletal‐related events: bone radiation therapy Show forest plot | 6 | 1696 | Risk Ratio (M‐H, Fixed, 95% CI) | 0.90 [0.77, 1.06] |
| 8 Skeletal‐related events: bone surgery Show forest plot | 5 | 1915 | Risk Ratio (M‐H, Fixed, 95% CI) | 0.50 [0.29, 0.86] |
| 9 Mortality Show forest plot | 9 | 2450 | Risk Ratio (M‐H, Fixed, 95% CI) | 0.97 [0.91, 1.04] |
| 10 Adverse events: nausea Show forest plot | 9 | 3008 | Risk Ratio (M‐H, Fixed, 95% CI) | 1.19 [1.00, 1.41] |
| 11 Adverse events: renal Show forest plot | 7 | 1794 | Risk Ratio (M‐H, Fixed, 95% CI) | 1.65 [1.11, 2.46] |
| 12 Adverse events: bone pain Show forest plot | 5 | 1445 | Risk Ratio (M‐H, Fixed, 95% CI) | 0.93 [0.81, 1.06] |
| 13 Adverse events: osteonecrosis of the jaw Show forest plot | 5 | 1626 | Risk Ratio (M‐H, Fixed, 95% CI) | 1.92 [0.75, 4.90] |
| 14 Proportion of participants with decreased analgesic consumption Show forest plot | 4 | 416 | Risk Ratio (M‐H, Fixed, 95% CI) | 1.19 [0.87, 1.63] |
| 15 Proportion of participants with disease progression Show forest plot | 7 | 2115 | Risk Ratio (M‐H, Fixed, 95% CI) | 0.94 [0.90, 0.98] |
| 16 Sensitivity analysis: pain response (low risk of bias vs high risk of bias) Show forest plot | 3 | 876 | Risk Ratio (M‐H, Fixed, 95% CI) | 1.15 [0.93, 1.43] |
| 16.1 Low risk of bias | 1 | 227 | Risk Ratio (M‐H, Fixed, 95% CI) | 1.23 [0.80, 1.89] |
| 16.2 High risk of bias | 2 | 649 | Risk Ratio (M‐H, Fixed, 95% CI) | 1.13 [0.88, 1.44] |
| 17 Subgroup analysis: pain response (amino‐bisphosphonate vs non‐amino‐bisphosphonate) Show forest plot | 3 | 876 | Risk Ratio (M‐H, Fixed, 95% CI) | 1.15 [0.93, 1.43] |
| 17.1 Amino‐bisphosphonate | 1 | 592 | Risk Ratio (M‐H, Fixed, 95% CI) | 1.12 [0.87, 1.44] |
| 17.2 Non‐amino‐bisphosphonate | 2 | 284 | Risk Ratio (M‐H, Fixed, 95% CI) | 1.23 [0.81, 1.87] |
| 18 Subgroup analysis: pain response (route of administration) Show forest plot | 3 | 876 | Risk Ratio (M‐H, Fixed, 95% CI) | 1.15 [0.93, 1.43] |
| 18.1 Oral | 1 | 592 | Risk Ratio (M‐H, Fixed, 95% CI) | 1.12 [0.87, 1.44] |
| 18.2 Intravenous | 2 | 284 | Risk Ratio (M‐H, Fixed, 95% CI) | 1.23 [0.81, 1.87] |
| 19 Sensitivity analysis: skeletal‐related events (low risk of bias vs high risk of bias) Show forest plot | 9 | 3153 | Risk Ratio (M‐H, Fixed, 95% CI) | 0.87 [0.81, 0.94] |
| 19.1 Low risk of bias | 5 | 1767 | Risk Ratio (M‐H, Fixed, 95% CI) | 0.90 [0.81, 0.99] |
| 19.2 High risk of bias | 4 | 1386 | Risk Ratio (M‐H, Fixed, 95% CI) | 0.84 [0.75, 0.94] |
| 20 Sensitivity analysis: skeletal‐related events (full‐text vs abstract publication) Show forest plot | 9 | 3153 | Risk Ratio (M‐H, Fixed, 95% CI) | 0.87 [0.81, 0.94] |
| 20.1 Full‐text publication | 8 | 3093 | Risk Ratio (M‐H, Fixed, 95% CI) | 0.88 [0.81, 0.95] |
| 20.2 Abstract publication | 1 | 60 | Risk Ratio (M‐H, Fixed, 95% CI) | 0.40 [0.12, 1.37] |
| 21 Subgroup analysis: skeletal‐related events (amino‐bisphosphonate versus non‐amino‐bisphosphonate) Show forest plot | 9 | 3153 | Risk Ratio (M‐H, Fixed, 95% CI) | 0.87 [0.81, 0.94] |
| 21.1 Amino‐bisphosphonate | 8 | 2842 | Risk Ratio (M‐H, Fixed, 95% CI) | 0.86 [0.79, 0.94] |
| 21.2 Non‐amino‐bisphosphonate | 1 | 311 | Risk Ratio (M‐H, Fixed, 95% CI) | 0.92 [0.78, 1.09] |
| 22 Subgroup analysis: skeletal‐related events (route of administration) Show forest plot | 9 | 3153 | Risk Ratio (M‐H, Fixed, 95% CI) | 0.87 [0.81, 0.94] |
| 22.1 Oral | 2 | 374 | Risk Ratio (M‐H, Fixed, 95% CI) | 0.92 [0.78, 1.09] |
| 22.2 Intravenous | 7 | 2779 | Risk Ratio (M‐H, Fixed, 95% CI) | 0.86 [0.79, 0.94] |
| 23 Sensitivity analysis: mortality (low risk of bias vs high risk of bias)) Show forest plot | 9 | 2450 | Risk Ratio (M‐H, Fixed, 95% CI) | 0.97 [0.91, 1.04] |
| 23.1 Low risk of bias | 6 | 1420 | Risk Ratio (M‐H, Fixed, 95% CI) | 0.93 [0.85, 1.02] |
| 23.2 High risk of bias | 3 | 1030 | Risk Ratio (M‐H, Fixed, 95% CI) | 1.04 [0.94, 1.15] |
| 24 Sensitivity analysis: mortality (full‐text vs abstract publication) Show forest plot | 9 | 2450 | Risk Ratio (M‐H, Fixed, 95% CI) | 0.97 [0.91, 1.04] |
| 24.1 Full‐text publication | 8 | 2390 | Risk Ratio (M‐H, Fixed, 95% CI) | 0.98 [0.91, 1.04] |
| 24.2 Abstract publication | 1 | 60 | Risk Ratio (M‐H, Fixed, 95% CI) | 0.80 [0.32, 2.03] |
| 25 Subgroup analysis: mortality (amino‐bisphosphonate vs non‐amino‐bisphosphonate) Show forest plot | 9 | 2450 | Risk Ratio (M‐H, Fixed, 95% CI) | 0.97 [0.91, 1.04] |
| 25.1 Amino‐bisphosphonate | 5 | 1738 | Risk Ratio (M‐H, Fixed, 95% CI) | 0.98 [0.90, 1.07] |
| 25.2 Non‐amino‐bisphosphonate | 4 | 712 | Risk Ratio (M‐H, Fixed, 95% CI) | 0.96 [0.87, 1.06] |
| 26 Subgroup analysis: mortality (route of administration) Show forest plot | 9 | 2450 | Risk Ratio (M‐H, Fixed, 95% CI) | 0.97 [0.91, 1.04] |
| 26.1 Oral | 5 | 1140 | Risk Ratio (M‐H, Fixed, 95% CI) | 1.02 [0.95, 1.11] |
| 26.2 Intravenous | 4 | 1310 | Risk Ratio (M‐H, Fixed, 95% CI) | 0.91 [0.81, 1.02] |
| 27 Sensitivity analysis: adverse event: nausea (low risk of bias vs high risk of bias) Show forest plot | 9 | 3008 | Risk Ratio (M‐H, Fixed, 95% CI) | 1.19 [1.00, 1.41] |
| 27.1 Low risk of bias | 7 | 2042 | Risk Ratio (M‐H, Fixed, 95% CI) | 1.18 [0.99, 1.40] |
| 27.2 High risk of bias | 2 | 966 | Risk Ratio (M‐H, Fixed, 95% CI) | 1.41 [0.49, 4.03] |
| 28 Subgroup analysis: adverse event: nausea (amino‐bisphosphonate vs non‐amino‐bisphosphonate) Show forest plot | 9 | 3008 | Risk Ratio (M‐H, Fixed, 95% CI) | 1.19 [1.00, 1.41] |
| 28.1 Amino‐bisphosphonate | 5 | 2332 | Risk Ratio (M‐H, Fixed, 95% CI) | 1.19 [0.98, 1.45] |
| 28.2 Non‐amino‐bisphosphonate | 4 | 676 | Risk Ratio (M‐H, Fixed, 95% CI) | 1.18 [0.83, 1.68] |
| 29 Subgroup analysis: adverse event: nausea (route of administration) Show forest plot | 9 | 3008 | Risk Ratio (M‐H, Fixed, 95% CI) | 1.19 [1.00, 1.41] |
| 29.1 Oral | 4 | 1059 | Risk Ratio (M‐H, Fixed, 95% CI) | 1.15 [0.80, 1.67] |
| 29.2 Intravenous | 5 | 1949 | Risk Ratio (M‐H, Fixed, 95% CI) | 1.20 [0.99, 1.45] |
| 30 Sensitivity analysis: renal (low risk of bias vs high risk of bias) Show forest plot | 7 | 1794 | Risk Ratio (M‐H, Fixed, 95% CI) | 1.65 [1.11, 2.46] |
| 30.1 Low risk of bias | 5 | 1498 | Risk Ratio (M‐H, Fixed, 95% CI) | 1.59 [1.06, 2.40] |
| 30.2 High risk of bias | 2 | 296 | Risk Ratio (M‐H, Fixed, 95% CI) | 3.0 [0.48, 18.65] |
| 31 Subgroup analysis: renal (amino‐bisphosphonate vs non‐amino‐bisphosphonate) Show forest plot | 7 | 1794 | Risk Ratio (M‐H, Fixed, 95% CI) | 1.65 [1.11, 2.46] |
| 31.1 Amino‐bisphosphonate | 5 | 1662 | Risk Ratio (M‐H, Fixed, 95% CI) | 1.63 [1.09, 2.44] |
| 31.2 Non‐amino‐bisphosphonate | 2 | 132 | Risk Ratio (M‐H, Fixed, 95% CI) | 3.24 [0.14, 77.15] |
| 32 Subgroup analysis: renal (route of administration) Show forest plot | 7 | 1794 | Risk Ratio (M‐H, Fixed, 95% CI) | 1.65 [1.11, 2.46] |
| 32.1 Oral | 3 | 204 | Risk Ratio (M‐H, Fixed, 95% CI) | 2.40 [0.37, 15.75] |
| 32.2 Intravenous | 4 | 1590 | Risk Ratio (M‐H, Fixed, 95% CI) | 1.62 [1.07, 2.44] |