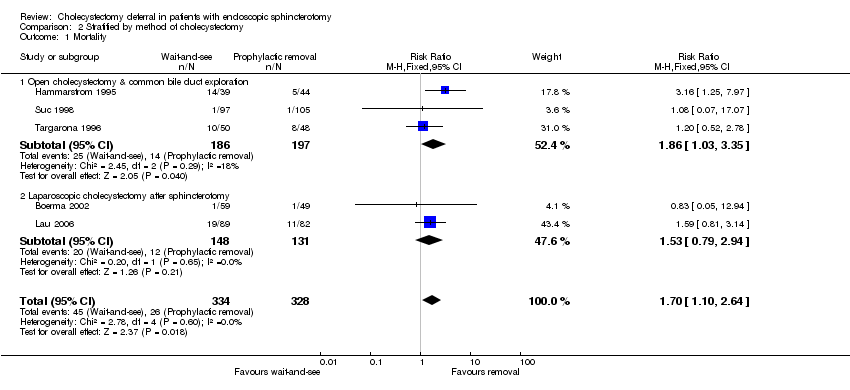
Scolaris Content Display Scolaris Content Display

Comparison 1 Wait‐and‐see versus prophylactic cholecystectomy, Outcome 1 Mortality.
Figuras y tablas -
Analysis 1.1

Comparison 1 Wait‐and‐see versus prophylactic cholecystectomy, Outcome 1 Mortality.

Comparison 1 Wait‐and‐see versus prophylactic cholecystectomy, Outcome 2 Biliary pain or cholecystitis.
Figuras y tablas -
Analysis 1.2

Comparison 1 Wait‐and‐see versus prophylactic cholecystectomy, Outcome 2 Biliary pain or cholecystitis.

Comparison 1 Wait‐and‐see versus prophylactic cholecystectomy, Outcome 3 Pancreatitis.
Figuras y tablas -
Analysis 1.3

Comparison 1 Wait‐and‐see versus prophylactic cholecystectomy, Outcome 3 Pancreatitis.

Comparison 1 Wait‐and‐see versus prophylactic cholecystectomy, Outcome 4 Recurrent jaundice or cholangitis.
Figuras y tablas -
Analysis 1.4

Comparison 1 Wait‐and‐see versus prophylactic cholecystectomy, Outcome 4 Recurrent jaundice or cholangitis.

Comparison 1 Wait‐and‐see versus prophylactic cholecystectomy, Outcome 5 Major adverse events.
Figuras y tablas -
Analysis 1.5

Comparison 1 Wait‐and‐see versus prophylactic cholecystectomy, Outcome 5 Major adverse events.

Comparison 1 Wait‐and‐see versus prophylactic cholecystectomy, Outcome 6 Minor adverse events.
Figuras y tablas -
Analysis 1.6

Comparison 1 Wait‐and‐see versus prophylactic cholecystectomy, Outcome 6 Minor adverse events.

Comparison 1 Wait‐and‐see versus prophylactic cholecystectomy, Outcome 7 Additional cholangiography (ERCP or PTC).
Figuras y tablas -
Analysis 1.7

Comparison 1 Wait‐and‐see versus prophylactic cholecystectomy, Outcome 7 Additional cholangiography (ERCP or PTC).

Comparison 1 Wait‐and‐see versus prophylactic cholecystectomy, Outcome 8 Difficult cholecystectomy.
Figuras y tablas -
Analysis 1.8

Comparison 1 Wait‐and‐see versus prophylactic cholecystectomy, Outcome 8 Difficult cholecystectomy.

Comparison 2 Stratified by method of cholecystectomy, Outcome 1 Mortality.
Figuras y tablas -
Analysis 2.1

Comparison 2 Stratified by method of cholecystectomy, Outcome 1 Mortality.

Comparison 2 Stratified by method of cholecystectomy, Outcome 2 Biliary pain or cholecystitis.
Figuras y tablas -
Analysis 2.2

Comparison 2 Stratified by method of cholecystectomy, Outcome 2 Biliary pain or cholecystitis.

Comparison 2 Stratified by method of cholecystectomy, Outcome 3 Pancreatitis.
Figuras y tablas -
Analysis 2.3

Comparison 2 Stratified by method of cholecystectomy, Outcome 3 Pancreatitis.

Comparison 2 Stratified by method of cholecystectomy, Outcome 4 Recurrent jaundice or cholangitis.
Figuras y tablas -
Analysis 2.4

Comparison 2 Stratified by method of cholecystectomy, Outcome 4 Recurrent jaundice or cholangitis.

Comparison 2 Stratified by method of cholecystectomy, Outcome 5 Major adverse events.
Figuras y tablas -
Analysis 2.5

Comparison 2 Stratified by method of cholecystectomy, Outcome 5 Major adverse events.

Comparison 2 Stratified by method of cholecystectomy, Outcome 6 Minor adverse events.
Figuras y tablas -
Analysis 2.6

Comparison 2 Stratified by method of cholecystectomy, Outcome 6 Minor adverse events.

Comparison 2 Stratified by method of cholecystectomy, Outcome 7 Additional cholangiography (ERCP or PTC).
Figuras y tablas -
Analysis 2.7

Comparison 2 Stratified by method of cholecystectomy, Outcome 7 Additional cholangiography (ERCP or PTC).

Comparison 2 Stratified by method of cholecystectomy, Outcome 8 Difficult cholecystectomy.
Figuras y tablas -
Analysis 2.8

Comparison 2 Stratified by method of cholecystectomy, Outcome 8 Difficult cholecystectomy.

Comparison 3 Stratified by patient ASA class, Outcome 1 Mortality.
Figuras y tablas -
Analysis 3.1

Comparison 3 Stratified by patient ASA class, Outcome 1 Mortality.

Comparison 3 Stratified by patient ASA class, Outcome 2 Biliary pain or cholecystitis.
Figuras y tablas -
Analysis 3.2

Comparison 3 Stratified by patient ASA class, Outcome 2 Biliary pain or cholecystitis.

Comparison 3 Stratified by patient ASA class, Outcome 3 Pancreatitis.
Figuras y tablas -
Analysis 3.3

Comparison 3 Stratified by patient ASA class, Outcome 3 Pancreatitis.

Comparison 3 Stratified by patient ASA class, Outcome 4 Recurrent jaundice or cholangitis.
Figuras y tablas -
Analysis 3.4

Comparison 3 Stratified by patient ASA class, Outcome 4 Recurrent jaundice or cholangitis.

Comparison 3 Stratified by patient ASA class, Outcome 5 Major adverse events.
Figuras y tablas -
Analysis 3.5

Comparison 3 Stratified by patient ASA class, Outcome 5 Major adverse events.

Comparison 3 Stratified by patient ASA class, Outcome 6 Minor adverse events.
Figuras y tablas -
Analysis 3.6

Comparison 3 Stratified by patient ASA class, Outcome 6 Minor adverse events.

Comparison 3 Stratified by patient ASA class, Outcome 7 Additional cholangiography (ERCP or PTC).
Figuras y tablas -
Analysis 3.7

Comparison 3 Stratified by patient ASA class, Outcome 7 Additional cholangiography (ERCP or PTC).

Comparison 3 Stratified by patient ASA class, Outcome 8 Difficult cholecystectomy.
Figuras y tablas -
Analysis 3.8

Comparison 3 Stratified by patient ASA class, Outcome 8 Difficult cholecystectomy.

Table 1. Actual cholecystectomy rate (prophylactic and therapeutic)

Trial

Wait‐and‐see: n/N

Prohylactic: n/N

Hammarstrom 1995

14/39

41/44

Targarona 1996

11/50

48/48

Suc 1998

56/92

102/102

Boerma 2002

22/59

44/49

Lau 2006

12/89

82/82

TOTAL

115/329

317/325

Figuras y tablas -
Table 1. Actual cholecystectomy rate (prophylactic and therapeutic)
Comparison 1. Wait‐and‐see versus prophylactic cholecystectomy

Outcome or subgroup title

No. of studies

No. of participants

Statistical method

Effect size

1 Mortality Show forest plot

5

662

Risk Ratio (M‐H, Fixed, 95% CI)

1.78 [1.15, 2.75]

2 Biliary pain or cholecystitis Show forest plot

5

654

Risk Ratio (M‐H, Fixed, 95% CI)

14.56 [4.95, 42.78]

3 Pancreatitis Show forest plot

5

662

Risk Ratio (M‐H, Fixed, 95% CI)

2.11 [0.39, 11.43]

4 Recurrent jaundice or cholangitis Show forest plot

5

662

Risk Ratio (M‐H, Fixed, 95% CI)

2.53 [1.09, 5.87]

5 Major adverse events Show forest plot

5

662

Risk Ratio (M‐H, Fixed, 95% CI)

0.60 [0.35, 1.02]

6 Minor adverse events Show forest plot

5

662

Risk Ratio (M‐H, Fixed, 95% CI)

0.45 [0.22, 0.91]

7 Additional cholangiography (ERCP or PTC) Show forest plot

5

662

Risk Ratio (M‐H, Fixed, 95% CI)

2.36 [1.29, 4.32]

8 Difficult cholecystectomy Show forest plot

5

654

Risk Ratio (M‐H, Fixed, 95% CI)

0.68 [0.39, 1.17]

Figuras y tablas -
Comparison 1. Wait‐and‐see versus prophylactic cholecystectomy
Comparison 2. Stratified by method of cholecystectomy

Outcome or subgroup title

No. of studies

No. of participants

Statistical method

Effect size

1 Mortality Show forest plot

5

662

Risk Ratio (M‐H, Fixed, 95% CI)

1.70 [1.10, 2.64]

1.1 Open cholecystectomy & common bile duct exploration

3

383

Risk Ratio (M‐H, Fixed, 95% CI)

1.86 [1.03, 3.35]

1.2 Laparoscopic cholecystectomy after sphincterotomy

2

279

Risk Ratio (M‐H, Fixed, 95% CI)

1.53 [0.79, 2.94]

2 Biliary pain or cholecystitis Show forest plot

5

654

Risk Ratio (M‐H, Fixed, 95% CI)

14.56 [4.95, 42.78]

2.1 Open cholecystectomy & common bile duct exploration

3

375

Risk Ratio (M‐H, Fixed, 95% CI)

11.09 [2.69, 45.79]

2.2 Laparoscopic cholecystectomy after spincterotomy

2

279

Risk Ratio (M‐H, Fixed, 95% CI)

18.84 [3.66, 97.00]

3 Pancreatitis Show forest plot

5

662

Risk Ratio (M‐H, Fixed, 95% CI)

2.11 [0.39, 11.43]

3.1 Open cholecystectomy & common bile duct exploration

3

383

Risk Ratio (M‐H, Fixed, 95% CI)

2.11 [0.39, 11.43]

3.2 Laparoscopic cholecystectomy after sphincterotomy

2

279

Risk Ratio (M‐H, Fixed, 95% CI)

0.0 [0.0, 0.0]

4 Recurrent jaundice or cholangitis Show forest plot

5

662

Risk Ratio (M‐H, Fixed, 95% CI)

2.53 [1.09, 5.87]

4.1 Open cholecystectomy & common bile duct exploration

3

383

Risk Ratio (M‐H, Fixed, 95% CI)

3.04 [0.47, 19.49]

4.2 Laparoscopic cholecystectomy after sphincterotomy

2

279

Risk Ratio (M‐H, Fixed, 95% CI)

2.41 [0.94, 6.18]

5 Major adverse events Show forest plot

5

662

Risk Ratio (M‐H, Fixed, 95% CI)

0.60 [0.35, 1.02]

5.1 Open cholecystectomy & common bile duct exploration

3

383

Risk Ratio (M‐H, Fixed, 95% CI)

0.73 [0.35, 1.53]

5.2 Laparoscopic cholecystectomy after sphincterotomy

2

279

Risk Ratio (M‐H, Fixed, 95% CI)

0.47 [0.21, 1.04]

6 Minor adverse events Show forest plot

5

662

Risk Ratio (M‐H, Fixed, 95% CI)

0.45 [0.22, 0.91]

6.1 Open cholecystectomy & common bile duct exploration

3

383

Risk Ratio (M‐H, Fixed, 95% CI)

0.28 [0.11, 0.73]

6.2 Laparoscopic cholecystectomy after sphincterotomy

2

279

Risk Ratio (M‐H, Fixed, 95% CI)

1.03 [0.32, 3.27]

7 Additional cholangiography (ERCP or PTC) Show forest plot

5

662

Risk Ratio (M‐H, Fixed, 95% CI)

2.36 [1.29, 4.32]

7.1 Open cholecystectomy & common bile duct exploration

3

383

Risk Ratio (M‐H, Fixed, 95% CI)

0.93 [0.45, 1.94]

7.2 Laparoscopic cholecystectomy after sphincterotomy

2

279

Risk Ratio (M‐H, Fixed, 95% CI)

20.40 [2.82, 147.51]

8 Difficult cholecystectomy Show forest plot

5

654

Risk Ratio (M‐H, Fixed, 95% CI)

0.68 [0.39, 1.17]

8.1 Open cholecystectomy & common bile duct exploration

3

375

Risk Ratio (M‐H, Fixed, 95% CI)

3.38 [0.14, 80.52]

8.2 Laparoscopic cholecystectomy after sphincterotomy

2

279

Risk Ratio (M‐H, Fixed, 95% CI)

0.63 [0.36, 1.10]

Figuras y tablas -
Comparison 2. Stratified by method of cholecystectomy
Comparison 3. Stratified by patient ASA class

Outcome or subgroup title

No. of studies

No. of participants

Statistical method

Effect size

1 Mortality Show forest plot

5

662

Risk Ratio (M‐H, Fixed, 95% CI)

1.70 [1.10, 2.64]

1.1 Studies with inclusion of high‐risk patients (ASA IV or V)

3

383

Risk Ratio (M‐H, Fixed, 95% CI)

1.86 [1.03, 3.35]

1.2 Studies with exclusion of high‐risk patients (ASA IV or V)

2

279

Risk Ratio (M‐H, Fixed, 95% CI)

1.53 [0.79, 2.94]

2 Biliary pain or cholecystitis Show forest plot

5

654

Risk Ratio (M‐H, Fixed, 95% CI)

14.56 [4.95, 42.78]

2.1 Studies with inclusion of high‐risk patients (ASA IV or V)

3

375

Risk Ratio (M‐H, Fixed, 95% CI)

11.09 [2.69, 45.79]

2.2 Studies with exclusion of high‐risk patients (ASA IV or V)

2

279

Risk Ratio (M‐H, Fixed, 95% CI)

18.84 [3.66, 97.00]

3 Pancreatitis Show forest plot

5

662

Risk Ratio (M‐H, Fixed, 95% CI)

2.11 [0.39, 11.43]

3.1 Studies with inclusion of high‐risk patients (ASA IV or V)

3

383

Risk Ratio (M‐H, Fixed, 95% CI)

2.11 [0.39, 11.43]

3.2 Studies with exclusion of high‐risk patients (ASA IV or V)

2

279

Risk Ratio (M‐H, Fixed, 95% CI)

0.0 [0.0, 0.0]

4 Recurrent jaundice or cholangitis Show forest plot

5

662

Risk Ratio (M‐H, Fixed, 95% CI)

2.53 [1.09, 5.87]

4.1 Studies with inclusion of high‐risk patients (ASA IV or V)

3

383

Risk Ratio (M‐H, Fixed, 95% CI)

3.04 [0.47, 19.49]

4.2 Studies with exclusion of high‐risk patients (ASA IV or V)

2

279

Risk Ratio (M‐H, Fixed, 95% CI)

2.41 [0.94, 6.18]

5 Major adverse events Show forest plot

5

662

Risk Ratio (M‐H, Fixed, 95% CI)

0.60 [0.35, 1.02]

5.1 Studies with inclusion of high‐risk patients (ASA IV or V)

3

383

Risk Ratio (M‐H, Fixed, 95% CI)

0.73 [0.35, 1.53]

5.2 Studies with exclusion of high‐risk patients (ASA IV or V)

2

279

Risk Ratio (M‐H, Fixed, 95% CI)

0.47 [0.21, 1.04]

6 Minor adverse events Show forest plot

5

662

Risk Ratio (M‐H, Fixed, 95% CI)

0.45 [0.22, 0.91]

6.1 Studies with inclusion of high‐risk patients (ASA IV or V)

3

383

Risk Ratio (M‐H, Fixed, 95% CI)

0.28 [0.11, 0.73]

6.2 Studies with exclusion of high‐risk patients (ASA IV or V)

2

279

Risk Ratio (M‐H, Fixed, 95% CI)

1.03 [0.32, 3.27]

7 Additional cholangiography (ERCP or PTC) Show forest plot

5

662

Risk Ratio (M‐H, Fixed, 95% CI)

2.36 [1.29, 4.32]

7.1 Studies with inclusion of high‐risk patients (ASA IV or V)

3

383

Risk Ratio (M‐H, Fixed, 95% CI)

0.93 [0.45, 1.94]

7.2 Studies with exclusion of high‐risk patients (ASA IV or V)

2

279

Risk Ratio (M‐H, Fixed, 95% CI)

20.40 [2.82, 147.51]

8 Difficult cholecystectomy Show forest plot

5

654

Risk Ratio (M‐H, Fixed, 95% CI)

0.68 [0.39, 1.17]

8.1 Studies with inclusion of high‐risk patients (ASA IV or V)

3

375

Risk Ratio (M‐H, Fixed, 95% CI)

3.38 [0.14, 80.52]

8.2 Studies with exclusion of high‐risk patients (ASA IV or V)

2

279

Risk Ratio (M‐H, Fixed, 95% CI)

0.63 [0.36, 1.10]

Figuras y tablas -
Comparison 3. Stratified by patient ASA class