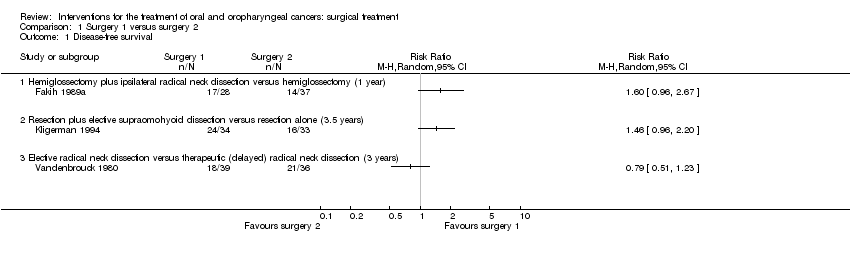
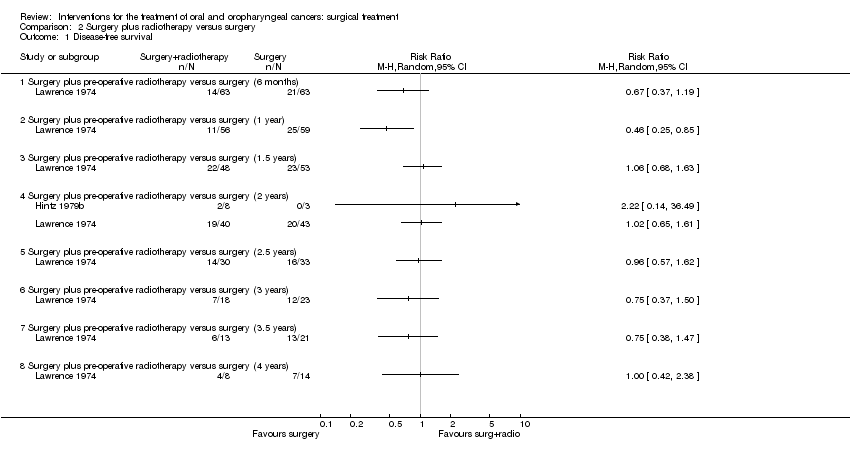
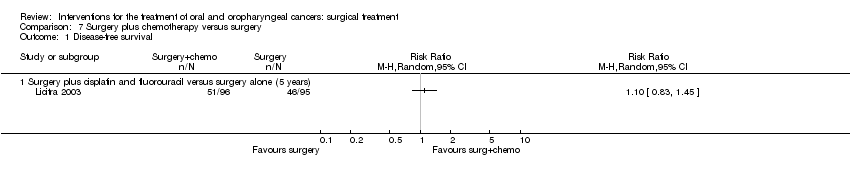
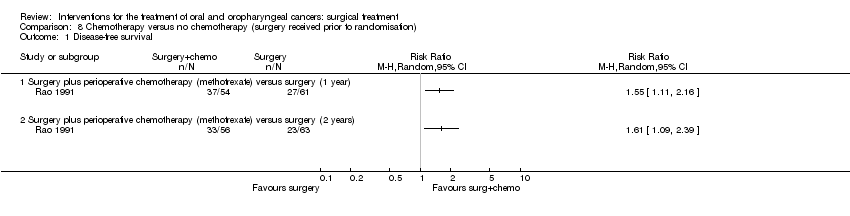
| 1 Disease‐free survival Show forest plot | 1 | | Risk Ratio (M‐H, Random, 95% CI) | Totals not selected |
|
| 1.1 Surgery plus perioperative chemotherapy (methotrexate) versus surgery (1 year) | 1 | | Risk Ratio (M‐H, Random, 95% CI) | 0.0 [0.0, 0.0] |
| 1.2 Surgery plus perioperative chemotherapy (methotrexate) versus surgery (2 years) | 1 | | Risk Ratio (M‐H, Random, 95% CI) | 0.0 [0.0, 0.0] |
| 2 Total mortality Show forest plot | 1 | | Risk Ratio (M‐H, Random, 95% CI) | Totals not selected |
|
| 2.1 Surgery plus perioperative chemotherapy (methotrexate) versus surgery (1 year) | 1 | | Risk Ratio (M‐H, Random, 95% CI) | 0.0 [0.0, 0.0] |
| 2.2 Surgery plus perioperative chemotherapy (methotrexate) versus surgery (2 years) | 1 | | Risk Ratio (M‐H, Random, 95% CI) | 0.0 [0.0, 0.0] |
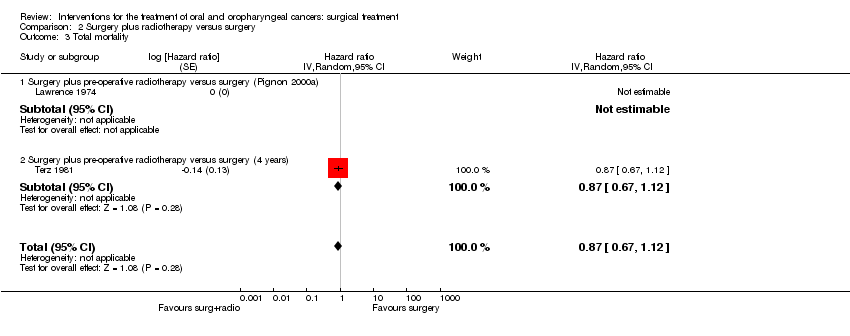
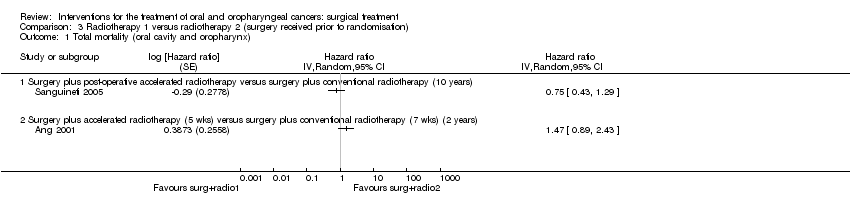
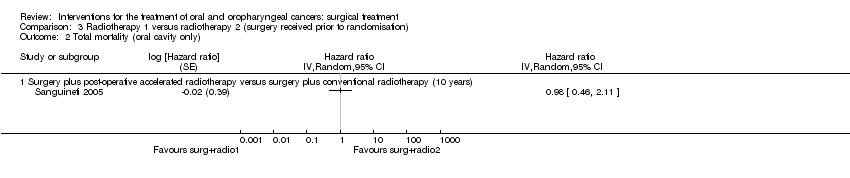
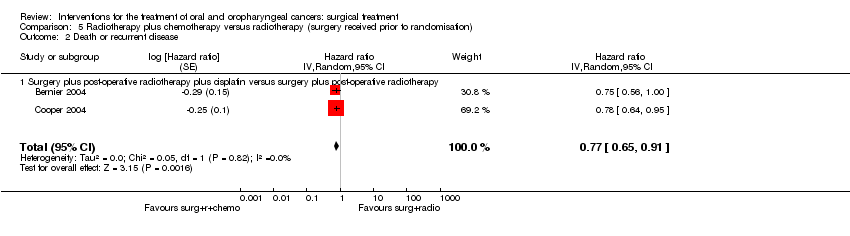
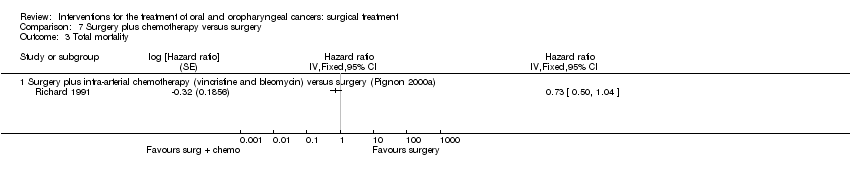
| 3 Total mortality Show forest plot | 2 | | Hazard ratio (Random, 95% CI) | Totals not selected |
|
| 3.1 Surgery plus perioperative chemotherapy (methotrexate) versus surgery (Pignon 2000a) | 1 | | Hazard ratio (Random, 95% CI) | 0.0 [0.0, 0.0] |
| 3.2 Locoregional+chemotherapy(methotrexate/citrvorum factor/bleomycin) vs locoregional no chemo (Pignon 2000a) | 1 | | Hazard ratio (Random, 95% CI) | 0.0 [0.0, 0.0] |
| 4 Disease‐related mortality Show forest plot | 1 | | Risk Ratio (M‐H, Random, 95% CI) | Totals not selected |
|
| 4.1 Surgery plus perioperative chemotherapy (methotrexate) versus surgery (2 years) | 1 | | Risk Ratio (M‐H, Random, 95% CI) | 0.0 [0.0, 0.0] |
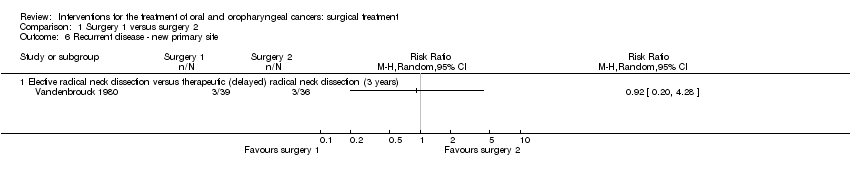
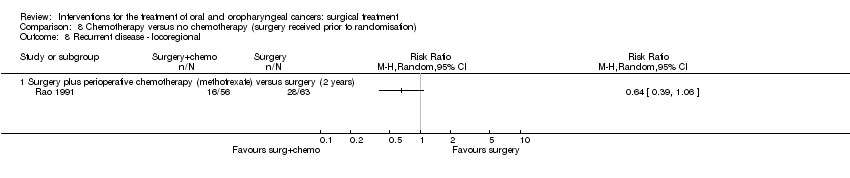
| 5 Recurrent disease ‐ total Show forest plot | 1 | | Risk Ratio (M‐H, Random, 95% CI) | Totals not selected |
|
| 5.1 Surgery plus perioperative chemotherapy (methotrexate) versus surgery (1 year) | 1 | | Risk Ratio (M‐H, Random, 95% CI) | 0.0 [0.0, 0.0] |
| 5.2 Surgery plus perioperative chemotherapy (methotrexate) versus surgery (2 years) | 1 | | Risk Ratio (M‐H, Random, 95% CI) | 0.0 [0.0, 0.0] |
| 6 Recurrent disease ‐ at primary site Show forest plot | 1 | | Risk Ratio (M‐H, Random, 95% CI) | Totals not selected |
|
| 6.1 Surgery plus perioperative chemotherapy (methotrexate) versus surgery (1 year) | 1 | | Risk Ratio (M‐H, Random, 95% CI) | 0.0 [0.0, 0.0] |
| 6.2 Surgery plus perioperative chemotherapy (methotrexate) versus surgery (2 years) | 1 | | Risk Ratio (M‐H, Random, 95% CI) | 0.0 [0.0, 0.0] |
| 7 Recurrent disease ‐ neck nodes (regional nodes) Show forest plot | 1 | | Risk Ratio (M‐H, Random, 95% CI) | Totals not selected |
|
| 7.1 Surgery plus perioperative chemotherapy (methotrexate) versus surgery (1 year) | 1 | | Risk Ratio (M‐H, Random, 95% CI) | 0.0 [0.0, 0.0] |
| 7.2 Surgery plus perioperative chemotherapy (methotrexate) versus surgery (2 years) | 1 | | Risk Ratio (M‐H, Random, 95% CI) | 0.0 [0.0, 0.0] |
| 8 Recurrent disease ‐ locoregional Show forest plot | 1 | | Risk Ratio (M‐H, Random, 95% CI) | Totals not selected |
|
| 8.1 Surgery plus perioperative chemotherapy (methotrexate) versus surgery (2 years) | 1 | | Risk Ratio (M‐H, Random, 95% CI) | 0.0 [0.0, 0.0] |
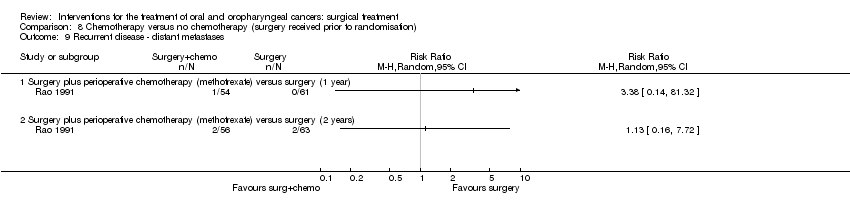
| 9 Recurrent disease ‐ distant metastases Show forest plot | 1 | | Risk Ratio (M‐H, Random, 95% CI) | Totals not selected |
|
| 9.1 Surgery plus perioperative chemotherapy (methotrexate) versus surgery (1 year) | 1 | | Risk Ratio (M‐H, Random, 95% CI) | 0.0 [0.0, 0.0] |
| 9.2 Surgery plus perioperative chemotherapy (methotrexate) versus surgery (2 years) | 1 | | Risk Ratio (M‐H, Random, 95% CI) | 0.0 [0.0, 0.0] |
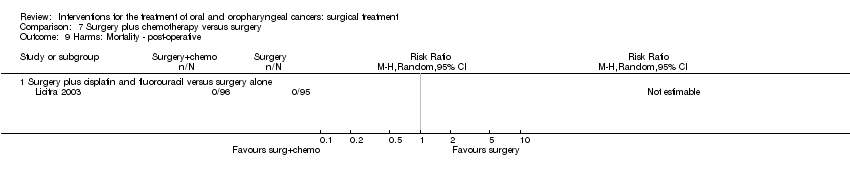
| 10 Harms: Morbidity ‐ post‐operative Show forest plot | 1 | | Risk Ratio (M‐H, Random, 95% CI) | Totals not selected |
|
| 10.1 Surgery plus perioperative chemotherapy (methotrexate) versus surgery | 1 | | Risk Ratio (M‐H, Random, 95% CI) | 0.0 [0.0, 0.0] |
| 11 Harms: Mortality ‐ post‐operative Show forest plot | 1 | | Risk Ratio (M‐H, Random, 95% CI) | Totals not selected |
|
| 11.1 Surgery plus perioperative chemotherapy (methotrexate) versus surgery | 1 | | Risk Ratio (M‐H, Random, 95% CI) | 0.0 [0.0, 0.0] |