L'entraînement avec assistance électromécanique pour la marche suite à un accident vasculaire cérébral (AVC)
Résumé scientifique
Contexte
Les dispositifs automatisés d'assistance à la marche électromécaniques et robotiques sont utilisés dans le cadre de la rééducation et pourraient permettre d'améliorer la marche suite à un AVC. Cet article est une mise à jour d'une revue Cochrane publiée pour la première fois en 2007.
Objectifs
Étudier les effets des dispositifs d'assistance à la marche électromécaniques et robotiques pour améliorer la marche suite à un AVC.
Stratégie de recherche documentaire
Nous avons effectué des recherches dans le registre des essais du groupe Cochrane sur les accidents vasculaires cérébraux (dernière recherche le 9 août 2016), le registre Cochrane des essais contrôlés (CENTRAL) (la bibliothèque Cochrane 2016, numéro 8), Ovid MEDLINE (de 1950 au 15 août 2016), Embase (de 1980 au 15 août 2016), CINAHL (de 1982 au 15 août 2016), AMED (de 1985 au 15 août 2016), Web of Science (de 1899 au 16 août 2016), SPORTDiscus (de 1949 au 15 septembre 2012), la Physiotherapy Evidence Database (PEDro) (recherche effectuée le 16 août 2016), et les bases de données d'ingénierie COMPENDEX (de 1972 au 16 novembre 2012) et Inspec (de 1969 au 26 août 2016). Nous avons effectué une recherche manuelle dans les actes de conférence pertinents, consulté les registres d'essais et de recherches, vérifié les références bibliographiques et contacté les auteurs en vue d'identifier d'autres essais publiés, non publiés, et en cours.
Critères de sélection
Nous avons inclus tous les essais contrôlés randomisés et les essais contrôlés randomisés croisés portant sur des personnes de plus de 18 ans présentant un diagnostic d'AVC de n'importe quelle gravité, à n'importe quel stade, dans n'importe quel environnement et comparant des dispositifs d'assistance à la marche électromécaniques et robotiques à la marche aux soins standard.
Recueil et analyse des données
Deux auteurs de la revue ont indépendamment sélectionné les essais à inclure, évalué la qualité méthodologique et le risque de biais et extrait les données. Le critère de jugement principal était la proportion de participants marchant de manière indépendante lors du suivi.
Résultats principaux
Nous avons inclus 36 essais portant sur 1472 participants dans cette revue mise à jour. L'entraînement à la marche avec assistance électromécanique en association avec la physiothérapie augmentait les chances que les participants marchent de manière indépendante (rapport des cotes (effets aléatoires) 1,94, intervalle de confiance à 95 % (IC) 1,39 à 2,71 ; P < 0,001 ; I² = 8 % ; preuves de qualité modérée), mais n'a pas augmenté significativement la vitesse de marche (différence moyenne (DM) 0,04 m / s, IC à 95 % 0,00 à 0,09 ; P = 0,08 ; I² = 65 % ; preuves de faible qualité) ou la capacité de marche (DM 5,84 mètres parcourus en 6 minutes, IC à 95 % ‐16,73 à 28,40 ; P = 0,61 ; I² = 53 % ; preuves de très faible qualité). Les résultats doivent être interprétés avec prudence car 1) certains essais étudiaient des personnes marchant de manière indépendante au début de l'étude ; 2), nous avons trouvé des variations entre les essais en termes de dispositifs utilisés et de durée et de fréquence du traitement ; et 3) certains essais incluaient des dispositifs de stimulation électrique fonctionnelle. Notre analyse en sous‐groupe planifiée a suggéré que les personnes dans la phase aiguë peuvent en obtenir des effets bénéfiques, mais que pour les personnes dans la phase chronique l'entraînement à la marche avec assistance électromécanique ne semble pas apporter de bénéfice. Une analyse post hoc a montré que les personnes incapables de marcher au début de l'intervention pourraient obtenir des effets bénéfiques de ce type d'entraînement, mais pas celles déjà capables de marcher. Une analyse post hoc n'a révélé aucune différence entre les types de dispositifs utilisés dans les études concernant la capacité à marcher, mais des différences significatives ont été observées entre les dispositifs en termes de vitesse de marche.
Conclusions des auteurs
Les personnes recevant un entraînement à la marche avec assistance électromécanique en association avec de la physiothérapie suite à un accident vasculaire cérébral (AVC) sont plus susceptibles de marcher indépendamment que les personnes qui reçoivent un entraînement à la marche sans ces dispositifs. Nous avons conclu que sept personnes devraient être traitées pour prévenir une dépendance pour la marche. Plus spécifiquement, les personnes dans les trois premiers mois après un accident vasculaire cérébral et celles n'étant pas capables de marcher semblent bénéficier le plus de ce type d'intervention. Le rôle du type de dispositif reste mal établi. De futurs essais cliniques pragmatiques de phase III et à large échelle devraient être effectués afin de répondre à des questions précises concernant la fréquence et la durée d'entraînement à la marche avec assistance électromécanique la plus efficace ainsi que la durée pendant laquelle les bénéfices persistent.
PICO
Résumé simplifié
Les dispositifs d'entraînement automatisés pour améliorer la marche suite à un accident vasculaire cérébral (AVC)
Question de la revue
Est‐ce que les dispositifs ou les machines automatisés d'entraînement à la marche permettent d'améliorer la capacité à marcher suite à un accident vasculaire cérébral (AVC) ?
Contexte
De nombreuses personnes ayant eu un AVC ont des difficultés à marcher et améliorer la marche est l'un des principaux objectifs de la rééducation. Les dispositifs d'entraînement automatisés facilitent l'entraînement à la marche.
Date de la recherche
La revue est à jour jusqu'en août 2016.
Caractéristiques de l'étude
Nous avons inclus 36 études portant sur un total de 1472 participants âgés de plus de 18 ans ayant développé un accident vasculaire cérébrale ischémique ou hémorragique de brève ou plus longue durée. L'âge moyen dans les études incluses variait de 48 à 76 ans. La majorité des études ont été réalisées dans le cadre des soins en milieu hospitalier.
Principaux résultats
Nous avons trouvé des preuves de qualité modérée indiquant que l'entraînement à la marche avec assistance électromécanique associé à la physiothérapie par rapport à la physiothérapie seule pourrait améliorer la récupération de la capacité à marcher de manière indépendante chez les personnes ayant eu un accident vasculaire cérébral (AVC).
Nous avons déterminé que pour sept personnes traitées avec des dispositifs d'assistance à l'entraînement à la marche électromécaniques et robotiques, un cas de personne ayant besoin d'aide pour marcher serait évité.
Plus spécifiquement, les personnes dans les trois premiers mois après un accident vasculaire cérébral n'étant pas capables de marcher semblent tirer le plus grand bénéfice de ce type d'intervention. L'importance du type de dispositif reste difficile à établir. De futures recherches devraient s'intéresser à quelle fréquence ou durée de marche pourrait être le plus efficace et pendant combien de temps les bénéfices sont préservés. Il reste également à déterminer comment ces dispositifs devraient être inclus dans la routine des services de rééducation.
Qualité des preuves
La qualité des preuves concernant les dispositifs automatisés d'assistance à la marche pour améliorer la marche suite à un accident vasculaire cérébral (AVC) était modérée. La qualité des preuves était faible concernant la vitesse de marche, très faible pour la capacité de marche, et faible pour les événements indésirables et les personnes ayant décidé d'interrompre le traitement.
Authors' conclusions
Summary of findings
| Electromechanical‐ and robotic‐assisted gait training plus physiotherapy compared to physiotherapy (or usual care) for walking after stroke | ||||||
| Patient or population: walking after stroke | ||||||
| Outcomes | Anticipated absolute effects* (95% CI) | Relative effect | № of participants | Quality of the evidence | Comments | |
| Risk with physiotherapy (or usual care) | Risk with electromechanical‐ and robotic‐assisted gait training plus physiotherapy | |||||
| Independent walking at the end of intervention phase, all electromechanical devices used | Study population | OR 1.94 | 1472 | ⊕⊕⊕⊝ | ||
| 457 per 1000 | 615 per 1000 | |||||
| Recovery of independent walking at follow‐up after study end | Study population | OR 1.93 | 496 | ⊕⊕⊕⊝ | ||
| 551 per 1000 | 703 per 1000 | |||||
| Walking velocity (metres per second) at the end of intervention phase | The mean walking velocity (metres per second) at the end of intervention phase was 0. | MD 0.04 higher | ‐ | 985 | ⊕⊕⊝⊝ | |
| Walking velocity (metres per second) at follow‐up | The mean walking velocity (metres per second) at follow‐up was 0. | MD 0.07 higher | ‐ | 578 | ⊕⊕⊕⊝ | |
| Walking capacity (metres walked in 6 minutes) at the end of intervention phase | The mean walking capacity (metres walked in 6 minutes) at the end of intervention phase was 0. | MD 5.84 higher | ‐ | 594 | ⊕⊝⊝⊝ | |
| Walking capacity (metres walked in 6 minutes) at follow‐up | The mean walking capacity (metres walked in 6 minutes) at follow‐up was 0. | MD 0.82 lower | ‐ | 463 | ⊕⊝⊝⊝ | |
| Acceptability of electromechanical‐assisted gait‐training devices during intervention phase | Study population | OR 0.67 | 1472 | ⊕⊕⊝⊝ | ||
| 131 per 1000 | 92 per 1000 | |||||
| *The risk in the intervention group (and its 95% confidence interval) is based on the assumed risk in the comparison group and the relative effect of the intervention (and its 95% CI). | ||||||
| GRADE Working Group grades of evidence | ||||||
| 1Downgraded due to several ratings of 'unclear' and 'high' risk of bias. | ||||||
Background
Description of the condition
A stroke is a sudden, non‐convulsive loss of neurological function due to an ischaemic or haemorrhagic intracranial vascular event (WHO 2006). In general, cerebrovascular accidents are classified by anatomic location in the brain, vascular distribution, aetiology, age of the affected individual, and haemorrhagic versus non‐haemorrhagic nature (Adams 1993). Stroke is a leading cause of death and serious long‐term disability in adults. Three months after stroke, 20% of people remain wheelchair bound, and approximately 70% walk at a reduced velocity and capacity (Jorgensen 1995). Restoration of walking ability and gait rehabilitation are therefore highly relevant for people who are unable to walk independently after stroke (Bohannon 1991), as well as for their relatives. To restore gait, modern concepts of rehabilitation favour a repetitive task‐specific approach (Carr 2003; French 2007). In recent years it has also been shown that higher intensities of walking practice (resulting in more repetitions trained) resulted in better outcomes for people after stroke (Kwakkel 1999; Van Peppen 2004).
Description of the intervention
As an adjunct to overground gait training (States 2009), in recent years treadmill training has been introduced for the rehabilitation of people after stroke (Mehrholz 2014). Treadmill training with and without partial body weight support enables the repetitive practice of complex gait cycles for these people. However, one disadvantage of treadmill training might be the effort required by therapists to set the paretic limbs and to control weight shift, thereby possibly limiting the intensity of therapy, especially in more severely disabled people. Automated electromechanical gait machines were developed to reduce dependence on therapists. They consist of either a robot‐driven exoskeleton orthosis or an electromechanical solution, with two driven foot plates simulating the phases of gait (Colombo 2000; Hesse 1999).
One example of automated electromechanical gait rehabilitation is the Lokomat (Colombo 2000). A robotic gait orthosis combined with a harness‐supported body weight system is used together with a treadmill. The main difference from treadmill training is that the patient's legs are guided by the robotic device according to a preprogrammed gait pattern. A computer‐controlled robotic gait orthosis guides the patient, and the process of gait training is automated.
A second example is the Gait Trainer GT I, which is based on a double crank and rocker gear system (Hesse 1999). In contrast to a treadmill, the electromechanical Gait Trainer GT I consists of two foot plates positioned on two bars, two rockers, and two cranks, which provide the propulsion. The harness‐secured patient is positioned on the foot plates, which symmetrically simulate the stance and swing phases of walking (Hesse 1999). A servo‐controlled motor guides the patient during walking exercise. Vertical and horizontal movements of the trunk are controlled in a phase‐dependent manner. Again, the main difference from treadmill training is that the process of gait training is automated and is supported by an electromechanical solution.
Other similar electromechanical devices that have been developed in recent years include the Haptic Walker (Schmidt 2005), the Anklebot (MIT 2005), and the LOPES (Lower Extremity Powered Exoskeleton) (Veneman 2005). More recently, new so‐called powered mobile solutions, Buesing 2015, Stein 2014, Watanabe 2014, and ankle robots, Forrester 2014, Waldman 2013, to improve walking have been described in the literature.
How the intervention might work
Electromechanical devices (such as those previously described) can be used to give non‐ambulatory patients intensive practice (in terms of high repetitions) of complex gait cycles. The advantage of these electromechanical devices compared with treadmill training with partial body weight support may be the reduced effort required of therapists, as they no longer need to set the paretic limbs or assist trunk movements (Hesse 2003).
Why it is important to do this review
Scientific evidence for the benefits of the above‐mentioned technologies may have changed since our Cochrane Review was first published in 2007 (Mehrholz 2007), and so an update of the review was required to justify the large equipment and human resource costs needed to implement electromechanical‐assisted gait devices, as well as to confirm the safety and acceptance of this method of training. The aim of this review was therefore to provide an update of the best available evidence about the above‐mentioned approach.
Objectives
To investigate the effects of automated electromechanical‐ and robotic‐assisted gait‐training devices for improving walking after stroke.
Methods
Criteria for considering studies for this review
Types of studies
We searched for all randomised controlled trials and randomised controlled cross‐over trials for inclusion in this review. If we included randomised controlled cross‐over trials, we planned to analyse only the first period as a parallel‐group trial.
Types of participants
We included studies with participants of any gender over 18 years of age after stroke, using the World Health Organization (WHO) definition of stroke or a clinical definition of stroke if the WHO definition was not specifically stated (WHO 2006).
Types of interventions
We included all trials that evaluated electromechanical‐ and robotic‐assisted gait training plus physiotherapy versus physiotherapy (or usual care) for regaining and improving walking after stroke. We also included automated electromechanical devices that were used in combination with therapies such as functional electrical stimulation applied to the legs during gait training (compared with therapies not using electromechanical devices). We defined an automated electromechanical device as any device with an electromechanical solution designed to assist stepping cycles by supporting body weight and automating the walking therapy process in people after stroke. This category included any mechanical or computerised device designed to improve walking function. We also searched for electromechanical devices such as robots for gait training after stroke (MIT 2005; Schmidt 2005; Veneman 2005).
Electromechanical devices can principally be differentiated into end‐effector and exoskeleton devices. Examples of end‐effector devices are the LokoHelp (Freivogel 2009), the Haptic Walker (Schmidt 2005), and the Gait Trainer GT I (Hesse 1999). The definition of an end‐effector principle is that a patient's feet are placed on foot plates, whose trajectories simulate the stance and swing phases during gait training (Hesse 2010). An example of exoskeleton devices is the Lokomat (Colombo 2000). Such exoskeletons are outfitted with programmable drives or passive elements, which move the knees and hips during the phases of gait (Hesse 2010).
We did not include non‐weight‐bearing interventions such as non‐interactive devices that deliver continuous passive motion only (Nuyens 2002). We excluded trials testing the effectiveness of treadmill training or other approaches such as repetitive task training in physiotherapy or electrical stimulation alone (French 2016; Pollock 2014), to prevent duplication with other Cochrane Reviews and protocols (e.g. Mehrholz 2014).
Types of outcome measures
Primary outcomes
Regaining the ability to walk is a very important goal for people after stroke (Bohannon 1988). We therefore defined the primary outcome as the ability to walk independently. We measured the ability to walk with the Functional Ambulation Category (FAC) (Holden 1984). A FAC score of 4 or 5 indicated independent walking over a 15‐metre surface, irrespective of aids used such as a cane. A FAC score of less than 4 indicates dependency in walking (supervision or assistance, or both must be given in performing walking).
If the included studies did not report FAC scores, we used alternative indicators of independent walking, such as:
-
a score of 3 on the ambulation item of the Barthel Index (Wade 1988); or
-
a score of 6 or 7 for the walking item of the Functional Independence Measure (Hamilton 1994); or
-
a 'yes' response to the item 'walking inside, with an aid if necessary (but with no standby help)' or 'yes' to 'walking on uneven ground' in the Rivermead Mobility Index (Collen 1991).
Secondary outcomes
We defined secondary outcomes as measures of activity limitations. We used walking speed (in metres per second), walking capacity (metres walked in 6 minutes), and the Rivermead Mobility Index score as relevant measures of activity limitations, if stated by the trialists. Additionally, we used death from all causes as a secondary outcome.
Adverse outcomes
We investigated the safety of electromechanical‐assisted gait‐training devices with the incidence of adverse outcomes such as thrombosis, major cardiovascular events, injuries, pain, and any other reported adverse events. To measure the acceptance of electromechanical‐assisted gait‐training devices in walking therapies, we used visual analogue scales or withdrawal from the study for any reason (dropout rates), or both during the study period, depending on data provided by the study authors.
Depending on the above‐stated categories and the availability of variables used in the included trials, we discussed and reached consensus on which outcome measures should be included in the analysis.
Search methods for identification of studies
See the 'Specialized register' section in the Cochrane Stroke Group module. We searched for trials in all languages and arranged for translation of relevant papers published in languages other than English.
Electronic searches
We searched the Cochrane Stroke Group Trials Register (last searched August 2016) and the following electronic bibliographic databases:
-
The Cochrane Central Register of Controlled Trials (CENTRAL) (the Cochrane Library, Issue 8, 2016) (Appendix 1);
-
MEDLINE in Ovid (1950 to 15 August 2016) (Appendix 2);
-
Embase (1980 to 15 August 2016) (Appendix 3);
-
CINAHL (Cumulative Index to Nursing and Allied Health Literature) in EBSCO (1982 to 15 August 2016) (Appendix 4);
-
AMED (Allied and Complementary Medicine Database) (1985 to 15 August 2016) (Appendix 5);
-
Web of Science (Science Citation Index Expanded, Social Sciences Citation Index, Arts and Humanities Citation Index) (1899 to 16 August 2016) (Appendix 6);
-
PEDro (Physiotherapy Evidence Database) (searched 16 August 2016) (Appendix 7);
-
COMPENDEX (1972 to 16 November 2012) (Appendix 8);
-
SPORTDiscus (1949 to 15 September 2012) (Appendix 9); and
-
Inspec (1969 to 26 August 2016) (Appendix 10).
We developed the search strategies with the help of the Cochrane Stroke Group Information Specialist and adapted the MEDLINE search strategy for the other databases.
We identified and searched the following ongoing trials and research registers:
-
International Standard Randomised Controlled Trial Number Register at www.isrctn.com/ (searched August 2016);
-
ClinicalTrials.gov at www.clinicaltrials.gov (searched 27 August 2016);
-
Stroke Trials Register at www.strokecenter.org (searched 27 August 2016); and
-
World Health Organization International Clinical Trials Registry Platform (WHO ICTRP) at apps.who.int/trialsearch/ (searched 27 August 2016) (Appendix 11).
Searching other resources
We also:
-
handsearched the following relevant conference proceedings:
-
World Congress of NeuroRehabilitation (2002, 2006, 2008, 2010, 2012, 2014, and 2016);
-
World Congress of Physical Medicine and Rehabilitation (2001, 2003, 2005, 2007, 2009, 2011, 2013, and 2015);
-
World Congress of Physical Therapy (2003, 2007, 2011, and 2015);
-
Deutsche Gesellschaft für Neurotraumatologie und Klinische Neurorehabilitation (2001 to 2015);
-
Deutsche Gesellschaft für Neurologie (2000 to 2016);
-
Deutsche Gesellschaft für Neurorehabilitation (1999 to 2016); and
-
Asia‐Oceanian Conference of Physical & Rehabilitation Medicine (2008 to 2016).
-
-
screened reference lists of all relevant articles; and
-
contacted trialists, experts, and researchers in our field of study.
Data collection and analysis
Selection of studies
Two review authors (JM, BE) independently read the titles and abstracts of the identified references and eliminated obviously irrelevant studies. We obtained the full text for the remaining studies. Based on our inclusion criteria (types of studies, participants, aims of interventions, outcome measures), the same two review authors independently ranked these studies as relevant, irrelevant, or possibly relevant. We excluded all trials ranked initially as irrelevant but included all other trials at this stage. We excluded all trials of specific treatment components, such as electrical stimulation as stand‐alone treatment, treadmill training, and continuous passive motion treatment, because these have been the subject of other Cochrane Reviews (e.g. Mehrholz 2014). We resolved any disagreements through discussion between all four review authors. If we required further information to reach consensus, we contacted trialists in an attempt to obtain the missing information. We recorded the selection process in sufficient detail to complete a PRISMA flow diagram, and listed all studies that did not match our inclusion criteria regarding types of studies, participants, and aims of interventions in the Characteristics of excluded studies table.
Data extraction and management
Two review authors (JM, BE) independently extracted trial and outcome data from the selected trials. We established the characteristics of unpublished trials through correspondence with the trial co‐ordinator or principal investigator. If any review author was involved in any of the selected studies, another review author not involved in the study extracted the study information. If there was any doubt as to whether a study should be excluded, we retrieved the full text of the article. In cases of disagreement between the two review authors, a third review author (JK) reviewed the information to decide on inclusion or exclusion of a study. We used checklists to independently record the following details.
-
Methods of generating the randomisation schedule.
-
Method of concealment of allocation.
-
Blinding of assessors.
-
Use of an intention‐to‐treat analysis (all participants initially randomly assigned were included in the analyses as allocated to groups).
-
Adverse events and dropouts for all reasons.
-
Important imbalance in prognostic factors.
-
Participants (country, number of participants, age, gender, type of stroke, time from stroke onset to entry to the study, inclusion and exclusion criteria).
-
Comparison (details of the intervention in treatment and control groups, details of co‐intervention(s) in both groups, duration of treatment).
-
Outcomes and time points of measures (number of participants in each group and outcome, regardless of compliance).
The two review authors checked all of the extracted data for agreement, with a third review author (JK) arbitrating any items for which consensus could not be reached. If necessary, we contacted trialists to request more information, clarification, and missing data.
Assessment of risk of bias in included studies
Two review authors (JM, MP) independently evaluated the methodological quality of the included trials using the Cochrane 'Risk of bias' tool, as described in Chapter 8 of the Cochrane Handbook for Systematic Reviews of Interventions (Higgins 2011a).
We checked all methodological quality assessments for agreement between review authors. We resolved disagreements by discussion. If one of the review authors was a co‐author of an included trial, another review author (BE or JK) conducted the methodological quality assessment for this trial in this case.
Measures of treatment effect
We planned to compare electromechanical‐ and robotic‐assisted gait training plus physiotherapy versus physiotherapy (or usual care) for primary and secondary outcome parameters. We used the effect measures odds ratio (OR) or mean difference (MD) in the meta‐analyses.
Unit of analysis issues
We analysed binary (dichotomous) outcomes with an OR, random‐effects model with 95% confidence intervals (CIs). We analysed continuous outcomes with MDs, using the same outcome scale. We used a random‐effects model for all analyses. We used Cochrane Review Manager 5 software for all statistical comparisons, (RevMan 2014).
Dealing with missing data
In the case of missing outcome data, we attempted to analyse data according to the intention‐to‐treat approach. We contacted the trial co‐ordinator or principal investigator if data were missing.
Assessment of heterogeneity
We used the I² statistic to assess heterogeneity. We used a random‐effects model, regardless of the level of heterogeneity.
Assessment of reporting biases
We inspected funnel plots to assess the risk of publication bias.
Data synthesis
GRADE and 'Summary of findings' table
We created two 'Summary of findings' tables using the following outcomes.
-
Primary outcome measure: Independent walking at the end of intervention phase, all electromechanical devices used. Scale from 0 to infinity.
-
Primary outcome measure: Recovery of independent walking at follow‐up after study end. Scale from 0 to infinity.
-
Primary outcome measure: Walking velocity (metres per second) at the end of intervention phase. Scale from 0 to infinity.
-
Secondary outcome measure: Walking velocity (metres per second) at follow‐up. Scale from 0 to infinity.
-
Secondary outcome measure: Walking capacity (metres walked in 6 minutes) at the end of intervention phase. Scale from 0 to infinity.
-
Secondary outcome measure: Walking capacity (metres walked in 6 minutes) at follow‐up. Scale from 0 to infinity.
-
Secondary outcome measure: Acceptability of electromechanical‐assisted gait‐training devices during intervention phase: number of dropouts.
We used the five GRADE considerations (study limitations, consistency of effect, imprecision, indirectness, and publication bias) to assess the quality of a body of evidence as it relates to the studies that contribute data to the meta‐analyses for the prespecified outcomes (Atkins 2004). We used methods and recommendations described in Section 8.5 and Chapter 12 of the Cochrane Handbook for Systematic Reviews of Interventions (Higgins 2011b), employing GRADEpro GDT software (GRADEpro GDT). We justified all decisions to down‐ or upgrade the quality of studies using footnotes, and made comments to aid the reader's understanding of the review where necessary.
Subgroup analysis and investigation of heterogeneity
As planned in our protocol (Mehrholz 2006), we performed a formal subgroup analysis following the guidance in the Cochrane Handbook for Systematic Reviews of Interventions (Deeks 2011), comparing participants treated in the acute and subacute phases of their stroke (within three months) with participants treated in the chronic phase (longer than three months).
Sensitivity analysis
As planned in our protocol, we performed a sensitivity analysis of methodological quality for each included study.
We carried out the following sensitivity analyses by including only those studies:
-
with an adequate sequence generation process;
-
with adequate concealed allocation;
-
with blinded assessors for the primary outcome; and
-
without incomplete outcome data.
We considered it necessary to do a further sensitivity analysis by removing the largest study, Pohl 2007, because some of the review authors (JM, MP, and CW) were investigators in this large trial. We carried out this sensitivity analysis by including all studies without the largest study (Pohl 2007).
We performed two further (post hoc) sensitivity analyses.
-
Ambulatory status at start of study (including only studies that included an independent walker; including only studies that included dependent and independent walkers; and including only studies that included a dependent walker).
-
Type of device used in trials (including only studies that used end‐effector devices and including only studies that used exoskeleton devices).
Results
Description of studies
See the Characteristics of included studies, Characteristics of excluded studies, and Characteristics of ongoing studies tables.
Results of the search
Figure 1 shows the flow diagram of the selection of studies for this update.

Study flow diagram.
Searches of the electronic databases and trials registers generated 7083 new unique references for screening. After excluding non‐relevant citations, we obtained the full text of 55 new papers, and from these identified and included 13 new trials in the review.
Included studies
We included 36 trials involving a total of 1472 participants (see the Characteristics of included studies, Figure 1, Table 1, and Table 2). All included studies investigated the effects of electromechanical‐ or robotic‐assisted gait‐training devices in improving walking after stroke.
| Study ID | Experimental: age, mean (SD) | Control: age, mean (SD) | Experimental: time poststroke | Control: time poststroke | Experimental: sex | Control: sex | Experimental: side paresis | Control: side paresis |
| 57 years | 65 years | ≤ 3 months | ≤ 3 months | 2 female | 4 female | Not stated | Not stated | |
| 54 years | 54 years | 12 months | 13 months | 5 male, 4 female | 4 male, 5 female | 4 right, 5 left | 4 right, 5 left | |
| 61 (median) years | 59 (median) years | 56 (median) days | 21 (median) days | 5 male, 2 female | 4 male, 2 female | 5 right, 2 left | 1 right, 5 left | |
| 60 years | 62 years | 7 years | 5 years | 17 male, 8 female | 16 male, 9 female | 13 right, 12 left | 12 right, 13 left | |
| 56 (12) years | 60 (12) years | 16 (5) days | 18 (5) days | 13 male, 7 female | 10 male, 7 female | 6 right, 14 left | 6 right, 11 left | |
| 55 (12) years | 55 (15) years | 15 months | 13 months | Not stated | Not stated | 6 right, 4 left (4 both) | 3 right, 1 left (3 both) | |
| 62 (10) years | 61 (11) years | 27 (11) days | 30 (14) days | 35 male, 18 female | 40 male, 13 female | 24 right, 29 left | 21 right, 32 left | |
| 70 (7) years | 68 (11) years | 47 (64) months | 48 (30) months | 16 male, 4 female | 14 male, 6 female | Not stated | Not stated | |
| Not stated | Not stated | Less than 12 months | Less than 12 months | Not stated | Not stated | Not stated | Not stated | |
| 63 years | 60 years | 12 days | 11 days | Not stated | Not stated | 9 right, 9 left | 7 right, 9 left | |
| 63 (7) years | 61 (6) years | 26 (6) months | 27 (6) months | 14 male, 6 female | 9 male, 1 female | Not stated | Not stated | |
| 68 (15) years | 63 (11) years | 22 (8) days | 18 (10) days | Not stated | Not stated | 20 right, 10 left | 14 right, 12 left | |
| 60 (11) years | 55 (9) years | 111 (63) days | 139 (61) days | 21 male, 12 female | 18 male, 12 female | 22 right, 11 left | 13 right, 17 left | |
| 57 (10) years | 57 (11) years | 50 (51) months | 73 (87) months | 15 male, 9 female | 15 male, 9 female | 16 right, 8 left | 16 right, 8 left | |
| 60 (13) years | 57 (11) years | 79 (56) days | 89 (61) days | 11 male, 5 female | 10 male, 4 female | 12 right, 4 left | 11 right, 3 left | |
| 54 (13) years | 50 (16) years | 80 (60) days | 120 (84) days | 9 male, 4 female | 10 male, 3 female | 8 right, 5 left | 10 right, 3 left | |
| 48 (8) years | 55 (16) years | 22 (23) months | 29 (12) months | 9 male, 8 female | 4 male, 4 female | 9 right, 8 left | 4 right, 4 left | |
| Not stated | Not stated | Between 10 days and 6 months | Between 10 days and 6 months | Not stated | Not stated | Not stated | Not stated | |
| 62 (11) years | 62 (14) years | 19 (11) days | 20 (14) days | 15 male, 9 female | 13 male, 11 female | 13 right, 11 left | 15 right, 9 left | |
| 67 (9) years | 64 (11) years | 1354 days | 525 days | 7 male, 4 female | 6 male, 4 female | Not stated | Not stated | |
| 62 (8) years | 66 (12) years | 23 (7) days | 26 (8) days | 11 male, 2 female | 9 male, 4 female | 6 right, 7 left | 5 right, 8 left | |
| 52 (8) years | 52 (7) years | 2.5 (2.5) years | 4.0 (5.8) years | 26 male, 4 female | 11 male, 4 female | 13 right, 17 left | 10 right, 5 left | |
| 67 (9) years | 68 (10) years | 8 (3) days | 8 (3) days | 11 male, 11 female | 18 male, 16 female | 11 right, 11 left | 14 right, 20 left | |
| 62 (10) years | 65 (3) years | 6 (4) years | 6 (4) years | 7 male, 4 female | 9 male, 2 female | Not stated | Not stated | |
| 62 (12) years | 64 (11) years | 4.2 (1.8) weeks | 4.5 (1.9) weeks | 50 male, 27 female | 54 male, 24 female | 36 right, 41 left | 33 right, 45 left | |
| 62 (13) years | 60 (19) years | 3.6 (4.6) months | 1.9 (0.8) months | 4 male, 4 female | 2 male, 6 female | Not stated | Not stated | |
| 62 (9) years | 65 (8) years | 22 (9) days | 24 (10) days | 21 male, 16 female | 20 male, 10 female | 17 right, 20 left | 8 right, 22 left | |
| 58 (11) years | 57 (15) years | 49 (39) months | 89 (153) months | Not stated | Not stated | Not stated | Not stated | |
| 63 (10) years | 60 (9) years | 55 (37) months | 65 (67) months | 10 male, 2 female | 9 right, 3 left | |||
| 71 (14) years | 64 (10) years | 2.5 (1.2) weeks | 2.7 (1.2) weeks | 19 male, 11 female | 12 male, 8 female | 13 right, 17 left | 7 right, 13 left | |
| 56 years | 62 years | Not stated | Not stated | Not stated | Not stated | Not stated | Not stated | |
| 53 (10) years | 2.1 (1.3) months | 16 male, 14 female | Not stated | Not stated | ||||
| 51 (8) years | 53 (7) years | 41 (20) months | 30 (22) months | Not stated | Not stated | Not stated | Not stated | |
| 67 (17) years | 76 (14) years | 59 (47) days | 51 (34) days | 7 male, 4 female | 4 male, 7 female | 6 right, 5 left | 5 right, 6 left | |
| 60 (9) years | 60 (9) years | 7.4 (2.0) weeks | 6.9 (2.1) weeks | 8 male, 7 female | 5 male, 10 female | 8 right, 7 left | 8 right, 7 left | |
| 59 (17) years | 55 (14) years | 44 (27) months | 37 (20) months | 6 male, 2 female | 7 male, 1 female | 4 right, 4 left | 3 right, 5 left | |
SD: standard deviation
| Criteria | Stroke severity | Electromechanical device used | Duration of study intervention | Aetiology (ischaemic/haemorrhage) | Intensity of treatment per day | Description of the control intervention | Dropouts | Reasons for dropout and adverse events in the experimental group | Reasons for dropout and adverse events in the control group | Source of information |
| Not stated | Lokomat | 3 weeks | Not stated | 30 minutes, 5 times a week | Described as task‐oriented physiotherapy, 5 times a week for 3 weeks (2.5 hours a week) | 4 of 23 | Not stated | Not stated | Unpublished information in the form of a conference presentation | |
| Unclear | Lokomat | 4 weeks | 13/5 | 60 minutes, 5 times a week (20 sessions) | Described as treadmill training without body weight support | 0 of 18 | ‐ | ‐ | Published information | |
| Mean FIM, 92 of 126 points | Lokomat | 3 weeks | Not stated | Not stated | Physiotherapy | 0 of 13 | ‐ | ‐ | Unpublished and published information provided by the authors. | |
| Unclear | Wearable exoskeleton Stride Management Assist system (SMA) | 6 to 8 weeks | Unclear | 3 times per week for a maximum of 18 sessions | Functional task‐specific training (intensive overground training and mobility training) | 0 of 50 | ‐ | ‐ | Published information | |
| Not stated | Lokomat | 10 days | Not stated | 30 minutes daily for 10 days | Conventional gait training by physical therapists (with equal therapy time and same amount of sessions as experimental group) | 3 of 40 | Not described by group (3 participants dropped out: 1 due to aspiration pneumonia, and 2 were unable to co‐operate fully with the experimental procedure) | Unpublished and published information provided by the authors. | ||
| Mean Modified Barthel Index, 36 points | Lokomat | 8 weeks (2 phases, cross‐over after 4 weeks) | 4/14 (2 both) | 30 minutes, 3 times a week for 4 weeks | Bobath (neurophysiological exercises, inhibition of spasticity and synergy pattern) | 0 of 20 | ‐ | ‐ | Published information | |
| Mean Barthel Index, 49 points | Gait Trainer | 8 weeks | Not stated | Not stated | Physiotherapy including 25 minutes of stance/gait, 10 minutes cycling, 10 minutes tilt table standing | 20 of 106 | 2 death, 3 refusal, 1 medical problem, 1 transport problem (1 pain as adverse event) | 1 death, 6 refusal, 3 medical problem, 1 administrative problem (no adverse events) | Published information | |
| Mean Barthel Index, 75 points | Gait Trainer | 4 weeks | Not stated | 40 minutes, 5 times a week | Bobath method, 5 times a week for 5 weeks | 0 of 40 | ‐ | ‐ | Unpublished and published information provided by the authors. | |
| Not stated | AutoAmbulator | 24 sessions | Not stated | Minimum of 3 sessions a week up to 5 sessions; number of minutes in each session unclear | "Standard" physical therapy, 3 to 5 times a week for 24 consecutive sessions | 0 of 20 | 14 adverse events, no details provided | 11 adverse events, no details provided | Unpublished and published information provided by the authors. | |
| Mean FIM walk 1 point | Anklebot | 8 to 10 sessions (with ca. 200 repetitions) | Not stated | 60 minutes, 8 to 10 sessions | Stretching of the paretic ankle | 5 of 34 | Total of 5 dropouts in both groups (1 medical complication, 1 discharge prior study end, 2 time poststroke > 49 days, 1 non‐compliance) | Published information provided by the authors. | ||
| Mean European Stroke Scale, 80 points | Gait Trainer | 2 weeks | Not stated | 50 minutes, 5 times a week | Walking exercises according to the Bobath approach | 0 of 30 | ‐ | ‐ | Unpublished and published information provided by the authors. | |
| Not stated | Lokomat | 4 weeks | 33/23 | 30 minutes, 5 times a week | Neurodevelopmental techniques for balance and mobility | 4 0f 60 | ‐ | 4 unclear reasons | Published information provided by the authors. | |
| Not stated | Lokomat | 8 to 10 weeks (24 sessions) | 47/16 | 45 minutes, 3 days a week | Conventional gait training, 3 times a week for 8 to 10 weeks (24 sessions), each session lasted 1.5 hours | 9 of 72 | Not described by group (9 withdrew or were removed because of poor attendance or a decline in health, including 1 death, which according to the authors was unrelated to study) | Unpublished and published information provided by the authors. | ||
| Not stated | Lokomat | 12 sessions | 22/26 | 30 minutes, 12 sessions | Therapist‐assisted gait training, 12 sessions, each session lasted 30 minutes | 14 of 62 | 4 participants dropped out (2 discontinued secondary to leg pain during training, 1 experienced pitting oedema, and 1 had travel limitations) | 10 participants dropped out (4 discontinued secondary to leg pain, 1 experienced an injury outside therapy, 1 reported fear of falling during training, 1 presented with significant hypertension, 1 had travel limitations, and 2 experienced subjective exercise intolerance) | Published information provided by the authors. | |
| Median Barthel Index, 35 points | Lokomat | 4 weeks | 22/8 | 30 minutes, 5 times a week | Conventional physiotherapy, 30 minutes per day for 4 weeks | 2 of 32 | 1 participant enteritis | 1 participant pulmonary embolism | Information as provided by the authors | |
| Mean Barthel Index, 20 points | Walkbot | 4 weeks | 13/13 | 30 minutes, 5 times a week | Conventional physiotherapy (bed mobility, stretching, balance training, strengthening, symmetry training, treadmill training) | 4 of 30 | 1 rib fracture, 3 decline in health condition | Information as provided by the authors | ||
| Not stated | Lokomat | 4 weeks | 18/7 | 45 minutes, 3 days a week | Conventional physiotherapy, received equal time and sessions of conventional gait training | 10 of 35 | 1 participant dropped out for private reasons (travelling); adverse events not described | 9 participants refused after randomisation (reasons not provided); adverse events not described | Unpublished and published information provided by the authors. | |
| Not stated | Lokomat | 8 weeks | Not stated | Not stated | Add‐on conventional physiotherapy, received equal time and sessions of conventional gait training | 13 of 74 | 4 participants dropped out (reasons not provided); adverse events not described | 9 participants dropped out (reasons not provided) | Unpublished and published information provided by the authors. | |
| Canadian Neurological Scale, 6 points | Gait Trainer | 4 weeks | 41/7 | 40 minutes, 5 times a week | Focused on trunk stabilisation, weight transfer to the paretic leg, and walking between parallel | 21 of 48 | 12 (hypotension, referred weakness, knee pain, urinary infection, uncontrolled blood pressure, fever, absence of physiotherapist) | 9 (hypotension, referred weakness, knee pain, ankle pain, uncontrolled blood pressure, fever, absence of physiotherapist) | Information as provided by the authors | |
| Not stated | Lokomat | Unclear | Not stated | Not stated | Not stated | 1 of 21 | No dropouts; 2 serious adverse events (1 skin breakdown as a result of therapy, 1 second stroke during the post‐treatment phase) | 1 dropout due to protocol violation; 2 serious adverse events (1 sudden drop in blood pressure at participant's home leading to brief hospitalisation, 1 sudden chest pain before therapy leading to brief hospitalisation) | Information as provided by the authors | |
| Not stated | Gait‐assistance robot (consisting of 4 robotic arms for the thighs and legs, thigh cuffs, leg apparatuses, and a treadmill) | 4 weeks | 10/16 | 20 minutes, 5 times a week for 4 weeks, in addition to rehabilitation treatment | Range‐of‐motion exercises, muscle strengthening, rolling over and sit‐to‐stand and activity and gait exercises | 0 of 26 | ‐ | ‐ | Published information | |
| Scandinavian Stroke Scale, 42 points | Gait Trainer | 3 weeks | 25/20 | 20 minutes, 5 times a week for 3 weeks, in addition to rehabilitation treatment | Walking overground; all participants practised gait for 15 sessions over 3 weeks (each session lasting 20 minutes) | 0 of 45 | ‐ | ‐ | Published information | |
| Not stated | Gait Trainer | 3 weeks | 42/14 | 20 minutes, 5 times a week for 3 weeks, in addition to rehabilitation treatment | Overground walking training; in the other control group, 1 or 2 physiotherapy sessions daily but not at the same intensity as in the other groups | 9 of 56 | 5 dropouts (2 situation worsened after 1 to 2 treatment days; 1 had 2 unsuccessful attempts in device; 1 had scheduling problems; 1 felt protocol too demanding) | 4 dropouts (1 felt protocol too demanding; 2 situation worsened after 1 to 2 treatment days; 1 death) | Published information | |
| Not stated | G‐EO System Evolution | Experimental group (G‐EO) 30 minutes a day for 5 consecutive days | Not stated | 5 days in addition to botulinum toxin injection of calf muscles | None | 0 of 22 | ‐ | ‐ | Published information | |
| Mean Barthel Index, 37 points | Gait Trainer | 4 weeks | 124/31 | 20 minutes, 5 times a week | Physiotherapy every weekday for 4 weeks | 11 of 155 | 2 participants refused therapy, 1 increased cranial pressure, 1 relapsing pancreas tumour, 1 cardiovascular unstable | 4 participants refused therapy, 1 participant died, 1 myocardial infarction | Published information | |
| Not stated | Lokomat | 2 weeks | 13/3 | A‐B‐A study: in phase A, 30 minutes, 5 days a week | Physiotherapy every weekday for 3 weeks (phase B) | 0 of 16 | None | None | Unpublished and published information provided by the authors. | |
| Mean NIHSS, 11 points | Lokomat | 6 weeks | 49/67 | 30 minutes, 3 times a week | Physiotherapy with additional gait training 3 times a week for 6 weeks | 6 of 46 | 2 participants with leg wounds, 1 participant with recurrent stroke, 1 refused therapy | 1 participant with recurrent stroke, 1 with pulmonary embolism | Unpublished and published information provided by the authors. | |
| Not stated | Bionic leg device (AlterG) | 6 weeks | Not stated | 1 hour, 3 times a week for 6 weeks | Group exercises | 0 of 24 | ‐ | ‐ | Published information | |
| Mean FIM, 79 points | Gait Master4 | 4 weeks | Not stated | 20 minutes, 2 or 3 times a week (12 sessions) | Non‐intervention (non‐training) | 0 of 12 | ‐ | ‐ | Published information | |
| Mean Barthel Index, 51 points | Gait Trainer | 4 weeks | 39/11 | 20 minutes, 5 times a week | Conventional physiotherapy alone, based on Bobath concept | 4 of 50 | None | 2 participants discharged before study end, 1 participant readmitted to an acute ward, 1 participant deteriorating condition | Published information | |
| Not stated | Lokomat | 2 weeks | Not stated | 30 minutes, 5 times a week | Conventional physiotherapy at home (focused on gait) | 0 of 22 | ‐ | ‐ | Published information | |
| Not stated | Lokomat | 8 weeks | Not stated | 30 minutes, twice a week | Overground therapy | 0 of 30 | ‐ | ‐ | Unpublished and published information provided by the author. | |
| Not stated | Portable rehab robot (ankle device) | 6 weeks | Not stated | 3 times a week, 18 sessions | Stretching the plantar flexors and active exercises for ankle mobility and strength | 0 of 24 | ‐ | ‐ | Published information | |
| Not stated | Single‐leg version of the Hybrid Assistive Limb (HAL) | 4 weeks | 11/11 | 20 minutes, 12 sessions | Aimed to improve walking speed, endurance, balance, postural stability, and symmetry | 10 of 32 | 4 withdrew, 1 epilepsy, 1 technical reasons | 2 pneumonia, 2 discharged | Published information | |
| Mean Barthel Index, 38 points | Gait Trainer | 2 weeks | 13/12 | 20 minutes, 5 times a week | Gait therapy including treadmill training with body weight support | 0 of 30 | None | None | Published information | |
| Not stated | Lokomat | 4 weeks (12 sessions) | 8/8 | 30 minutes, 3 times a week | 12 physiotherapy sessions including manually guided gait training (3 times a week over 4 weeks) | 0 of 16 | None | None | Published information | |
FIM: Functional Independence Measure
NIHSS: National Institutes of Health Stroke Scale
For one of the included studies published only as an abstract we obtained at least some results through correspondence with the trial co‐ordinator or principal investigator (Mayr 2008). Another study was not yet published, but the results of the trial were presented orally, and we were able to obtain a handout with information about the study from the principal investigator (Aschbacher 2006).
A detailed description of all participant characteristics can be found in Table 1 and Table 2 (see also the Characteristics of included studies). The mean age in the included studies ranged from 48 years, in Kyung 2008, to 76 years, in Watanabe 2014 (Table 1). More males than females were included the studies (approximately 60% males). More participants with ischaemic stroke than haemorrhagic stroke lesions (approximately 70% ischaemic stroke) were included, and almost as many participants with left‐sided hemiparesis compared with participants with right‐sided hemiparesis (approximately 50% left‐sided) were included in the studies (see Table 1 and Table 2).
Twelve studies provided information about baseline stroke severity (Table 2), of which seven used the Barthel Index score, ranging from 20 Barthel Index points, in Kim 2015, to 75 of 100 Barthel Index points, in Dias 2006 (Table 2). Details of all inclusion and exclusion criteria used in the studies can be found in the Characteristics of included studies table.
The duration of study intervention (time frame during which experimental interventions were applied) was heterogeneous, ranging from 10 days, in Chang 2012, to eight weeks, in Mayr 2008. The study intervention period for most studies was three or four weeks (Table 2). Fifteen of the 36 studies included participants who could walk independently at the start of the study; a further nine studies included participants who were dependent and independent walkers (Analysis 4.1); and 12 studies included only non‐ambulatory participants (Analysis 4.1). The experimental intervention in 17 studies was the robotic‐assisted device Lokomat, and the experimental intervention in nine studies was the electromechanical‐assisted device Gait Trainer; a detailed description of devices used in studies can be found in Table 2.
Frequency (in terms of therapy provided per week) of treatment ranged from two or three times a week, in Tanaka 2012, to five times a week (Table 2). Intensity (in terms of duration of experimental therapy provided) of treatment ranged from 20 minutes, in Werner 2002, to 60 minutes, in Forrester 2014. In many studies, details of the interventions were unclear or incomplete, for example details about the intensity of the experimental treatment were unclear in some studies (Table 2). Except for Tanaka 2012 and Picelli 2016, the gait training time did not differ between control and experimental groups in the included studies. Eleven included studies used a follow‐up assessment after the study ended (Buesing 2015; Chua 2016; Dias 2006; Hidler 2009; Hornby 2008; Peurala 2005; Peurala 2009; Pohl 2007; Schwartz 2006; Stein 2014; Waldman 2013). Most studies investigated improvement in walking function as a primary outcome for analysis and used the Functional Ambulation Category (FAC) or comparable scales to assess independent walking. Furthermore, frequently investigated outcomes included assessment of walking function using gait velocity in metres per second. A more detailed description of the primary and secondary outcomes for each trial can be found in the Characteristics of included studies table.
We found the highest dropout rates for all reasons at the end of the treatment phase to be 23%, in Hornby 2008, and 29%, in Kyung 2008. Seventeen trialists reported no dropouts at scheduled follow‐up (Analysis 1.7; Table 2).
Excluded studies
We excluded 24 studies (see Characteristics of excluded studies and Figure 1 for further information).
Ongoing studies and studies awaiting assessment
We identified 16 ongoing studies (see Characteristics of ongoing studies). Thirteen studies for which we were unable to make contact with the trialists are still awaiting assessment (see Characteristics of studies awaiting classification).
Risk of bias in included studies
The risk of bias in included studies is described in greater detail in Characteristics of included studies and Figure 2.
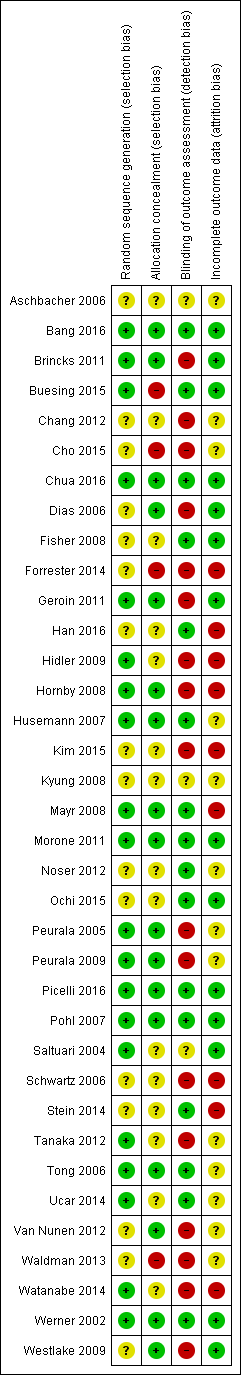
Risk of bias summary: review authors' judgements about each risk of bias item for each included study.
We wrote to the trialists of all included studies and studies awaiting assessment to request clarification of design features or for missing information to complete the quality ratings. We sent the correspondence via email or letter, followed by reminders every month if we received no response. Most trialists provided at least some of the requested data, but we were not able to obtain all of the required data.
Two review authors (JM, MP) used the 'Risk of bias' assessment tool to independently assess the methodological quality of the studies for the domains random sequence generation, allocation concealment, blinding of outcome assessment, and incomplete outcome data for all of the included trials except two (Pohl 2007; Werner 2002), which two other review authors (BE, JK) rated in an interview with the trialists. The review authors discussed all disagreements and sought arbitration by another review author (JK or BE) if necessary.
Allocation
Of the 36 included studies, 20 described adequate random sequence generation, and 17 described adequate allocation concealment.
Blinding
Of the 36 included studies, 6 reported blinding of the primary outcome assessment.
Incomplete outcome data
Of the 36 included studies, 14 reported incomplete outcome data (attrition bias).
Selective reporting
For the majority of studies, particularly the older trials, we did not find study protocols. Where study protocols were available, there was no evidence of selective reporting of outcomes relevant to this review.
Other potential sources of bias
Five out of 36 included trials used a cross‐over design with random allocation to the order of treatment sequences (Brincks 2011; Cho 2015; Saltuari 2004; Tanaka 2012; Werner 2002). We analysed only the first intervention period as a parallel‐group trial in this review. All other included studies used a parallel‐group design with true randomisation to group allocation.
Three studies used two experimental groups and one control group (Geroin 2011; Peurala 2005; Tong 2006), and one study used one experimental group and two control groups (Peurala 2009). In the former three studies (Geroin 2011; Peurala 2005; Tong 2006), additional functional electrical stimulation of leg muscles (or transcranial stimulation of the brain in Geroin 2011) during gait training was applied in one of the treatment groups. Because functional electrical stimulation or transcranial stimulation of the brain was done as an adjunct during electromechanical‐assisted gait training, and because the results in these experimental groups did not differ significantly, we combined the results of both experimental groups into one (collapsed) group and compared this with the results from the control group. In one study, an electromechanical‐assisted device was used in the experimental group and was compared with two control groups that did not use a device (Peurala 2009). Because we were interested in the effects of electromechanical‐ and robotic‐assisted gait‐training devices for improving walking after stroke, we combined the results of both control groups without devices into one (collapsed control) group and compared this with results of the one experimental group.
Effects of interventions
Independent walking at the end of the intervention phase, all electromechanical devices used
Thrity‐six trials with a total of 1472 participants measured independent walking at study end, but for 21 included trials, no effect estimate (odds ratio (OR)) was feasible because no events (e.g. no participant reached the ability to walk) or only events (e.g. all participants regained walking) were reported (Analysis 1.1) (Deeks 2011).
The use of electromechanical devices in gait rehabilitation for people after stroke increased the chance of walking independently (OR 1.94, 95% confidence interval (CI) 1.39 to 2.71; P < 0.001; level of heterogeneity I² = 8%; moderate‐quality evidence; summary of findings Table for the main comparison). However, 15 out of 36 studies investigated at least some participants who were already independent in walking at the start of the study. A further nine studies included participants who were dependent and independent walkers, and 12 studies included only non‐ambulatory participants (Analysis 4.1). Of the total population of 1472 participants, approximately 39% were independent and approximately 59% were dependent walkers at the start of the study.
Recovery of independent walking at follow‐up after study end
Six trials with a total of 496 participants measured recovery of independent walking with follow‐up after the study end (Chua 2016; Hidler 2009; Hornby 2008; Peurala 2009; Pohl 2007; Tong 2006), but for two included trials (with 125 participants), no effect estimate (OR) was feasible because no events (e.g. no participant reached ability to walk) or only events (e.g. all participants regained walking) were reported (Analysis 1.2). The use of electromechanical devices for gait rehabilitation of people after stroke did not increase the chance of walking independently at follow‐up after study end (OR 1.93, 95% CI 0.72 to 5.13; P = 0.19; level of heterogeneity I² = 79%; moderate‐quality evidence). However, some included trials investigated participants who were already independent in walking at the start of the study. We could draw no definitive conclusion regarding a longer‐lasting effect of the use of electromechanical devices.
Walking velocity (metres per second) at the end of the intervention phase
Twenty‐four trials with a total of 985 participants provided data for walking velocity (m/s) at study end (Analysis 1.3). The use of electromechanical devices for gait rehabilitation did not significantly increase walking velocity. The pooled mean difference (MD) (random‐effects model) for walking velocity was 0.04 m/s (95% CI 0.00 to 0.09; P = 0.08; level of heterogeneity I² = 65%; low‐quality evidence). Participants who were unable to walk were regarded as having a walking velocity of zero metres per second.
Walking velocity (metres per second) at follow‐up
Nine trials with a total of 578 participants provided data for walking velocity (m/s) at follow‐up after study end (Buesing 2015; Chua 2016; Hidler 2009; Hornby 2008; Kyung 2008; Noser 2012; Pohl 2007; Stein 2014; Tong 2006). The use of electromechanical devices for gait rehabilitation did not significantly increase the walking velocity at follow‐up after study end. The pooled MD (random‐effects model) for walking velocity was 0.07 m/s (95% CI ‐0.05 to 0.19; P = 0.26; level of heterogeneity I² = 80%; moderate‐quality evidence; Analysis 1.4). Participants who were unable to walk were regarded as having a walking velocity of zero metres per second. We could draw no definitive conclusion regarding a longer‐lasting effect of the use of electromechanical devices for walking velocity.
Walking capacity (metres walked in 6 minutes) at the end of the intervention phase
Twelve trials with a total of 594 participants provided data for walking capacity (metres walked in 6 minutes) at study end (Chua 2016; Hidler 2009; Hornby 2008; Noser 2012; Peurala 2005; Picelli 2016; Pohl 2007; Saltuari 2004; Stein 2014; Waldman 2013; Watanabe 2014; Westlake 2009). The use of electromechanical devices in gait rehabilitation did not increase the walking capacity of people after stroke. The pooled MD (random‐effects model) for walking capacity was 5.84 metres walked in 6 minutes (95% CI ‐16.73 to 28.40; P = 0.61; level of heterogeneity I² = 53%; very low‐quality evidence; Analysis 1.5).
Walking capacity (metres walked in 6 minutes) at follow‐up
Seven trials with a total of 463 participants provided data for walking capacity (metres walked in 6 minutes) at follow‐up after study end (Chua 2016; Hidler 2009; Hornby 2008; Noser 2012; Pohl 2007; Stein 2014; Waldman 2013). The use of electromechanical devices for gait rehabilitation did not increase walking capacity at follow‐up after study end. The pooled MD (random‐effects model) for walking capacity was ‐0.82 metres walked in 6 minutes (95% CI ‐32.17 to 30.53; P = 0.96; level of heterogeneity I² = 58%; very low‐quality evidence; Analysis 1.6).
Death from all causes until the end of the intervention phase
Only three larger trials reported any deaths during the intervention period (Chua 2016; Hidler 2009; Pohl 2007). In Pohl 2007 one participant in the control group died as the result of aspiration pneumonia, and one participant in the treatment group died due to recurrent stroke. In Hidler 2009, the group in which the death occurred was not stated. We therefore used a worst‐case (conservative) scenario and counted the one death for the experimental group. In the study of Chua 2016 the deaths occurred after the treatment period. The use of electromechanical devices for gait rehabilitation of non‐ambulatory people after stroke did not increase the risk of participants dying during the intervention period (risk difference (random‐effects model) 0.00, 95% CI ‐0.01 to 0.02; P = 0.77; level of heterogeneity I² = 0%; moderate‐quality evidence; Analysis 1.8).
Adverse outcomes: acceptability of electromechanical‐assisted gait‐training devices during the intervention phase in terms of dropouts
All trialists provided information about participants who dropped out from all causes during the trial period, but for 17 of the 36 included trials, no events/dropouts were reported (Analysis 1.7). The use of electromechanical devices for gait rehabilitation of non‐ambulatory people after stroke did not increase the risk of participants dropping out (OR (random‐effects model) 0.67, 95% CI 0.43 to 1.05; P = 0.08; level of heterogeneity I² = 24%; low‐quality evidence). The reasons for dropouts and all adverse events are described in detail for each trial in Table 2.
Regaining independent walking ability: planned sensitivity analysis by trial methodology
To examine the robustness of the results, we specified variables in a sensitivity analysis that we believed could influence the size of the observed effect (adequate sequence generation process, adequate concealed allocation, blinded assessors for the primary outcome, incomplete outcome data, and excluding the largest study). As stated above, for some of the included trials, no effect estimate (OR) was feasible (Analysis 2.1).
Studies with adequate sequence generation process
We included 20 trials with a total of 949 participants with an adequate sequence generation process (Figure 2). The use of electromechanical devices for gait rehabilitation of people after stroke increased the chance of walking independently (OR (random‐effects model) 1.80, 95% CI 1.06 to 3.08; P = 0.03; level of heterogeneity I² = 38%).
Studies with adequate concealed allocation
We included 17 trials with a total of 831 participants with adequate concealed allocation (Figure 2). The use of electromechanical devices for gait rehabilitation of people after stroke increased the chance of walking independently (OR (random‐effects model) 1.87, 95% CI 1.12 to 3.12; P = 0.02; level of heterogeneity I² = 37%).
Studies with blinded assessors for the primary outcome
Sixteen trials with a total of 762 participants had blinded assessors for the primary outcome (Figure 2). The use of electromechanical devices for gait rehabilitation of people after stroke increased the chance of walking independently (OR (random‐effects model) 1.81, 95% CI 1.10 to 2.98; P = 0.02; level of heterogeneity I² = 31%).
Studies with complete outcome data
Fourteen trials with a total of 590 participants adequately described complete outcome data (Figure 2). The use of electromechanical devices for gait rehabilitation of people after stroke increased the chance of walking independently (OR (random‐effects model) 2.23, 95% CI 1.16 to 4.29; P = 0.02; level of heterogeneity I² = 29%).
Excluding the largest study (Pohl 2007)
After excluding the largest study (Pohl 2007), 35 trials with a total of 1317 participants remained in this analysis. The use of electromechanical devices for gait rehabilitation of people after stroke increased the chance of walking independently (OR (random‐effects model) 1.65, 95% CI 1.17 to 2.34; P = 0.005; level of heterogeneity I² = 0%).
Subgroup analysis comparing participants in the acute and chronic phases of stroke
Independent walking at the end of the intervention phase, all electromechanical devices used
In our planned subgroup analysis comparing independent walking at the end of the intervention phase in people in the acute and chronic phases of stroke, we attempted to assign all included studies to one of two subgroups (acute and chronic phases).
Twenty trials with a total of 1143 participants investigated people in the acute or subacute phase, defined as less than or equal to three months after stroke (Analysis 3.1). As stated in the comparisons above, for some of the included trials no effect estimate (OR) was feasible (Analysis 3.1). The use of electromechanical devices for gait rehabilitation of people after stroke increased the chance of walking independently (OR (random‐effects model) 1.90, 95% CI 1.38 to 2.63; P < 0.001; level of heterogeneity I² = 5%).
Sixteen trials with a total of 461 participants investigated people in the chronic phase, defined as more than three months after stroke (Analysis 3.1). The use of electromechanical devices for gait rehabilitation of people after stroke did not increase the chance of walking independently (OR (random‐effects model) 1.20, 95% CI 0.40 to 3.65; P = 0.74; level of heterogeneity I² = 29%).
In a formal subgroup analysis, we did not find statistically significant differences in regaining independent walking between participants treated in the acute/subacute phase compared with participants treated in the chronic phase after stroke (Chi² = 0.61, df = 1; P = 0.44).
Post hoc sensitivity analysis by ambulatory status at study onset
Independent walking at the end of the intervention phase
To examine the robustness of the results and to explore the relationship between the main effect and walking status at the start of the study, we compared independent walking rates at the end of the intervention phase by ambulatory status at start of study.
Ambulatory participants at start of study
Fifteen trials with a total of 500 participants investigated independent walkers (Analysis 4.1). As stated in the comparisons above, for some of the included trials, no effect estimate (OR) was feasible; the conclusions are therefore based on one trial. The use of electromechanical devices for gait rehabilitation of people after stroke did not increase the chance of walking independently (OR (random‐effects model) 1.38, 95% CI 0.45 to 4.20; P = 0.57; level of heterogeneity I² = not applicable).
Ambulatory and non‐ambulatory participants at start of study
Nine trials with a total of 340 participants investigated a mixed population of dependent and independent walkers (Analysis 4.1). The use of electromechanical devices for gait rehabilitation of people after stroke increased the chance of walking independently (OR (random‐effects model) 1.90, 95% CI 1.11 to 3.25; P = 0.02; level of heterogeneity I² = 0%).
Non‐ambulatory participants at start of study
Twelve trials with a total of 632 participants investigated dependent walkers (Analysis 4.1). The use of electromechanical devices for gait rehabilitation of people after stroke increased the chance of walking independently (OR (random‐effects model) 1.90, 95% CI 1.04 to 3.48; P = 0.04; level of heterogeneity I² = 45%).
In a subgroup analysis, we did not find statistically significant differences between people who were dependent or independent walkers at the start of the study in regaining independent walking (Chi² = 0.28, df = 2; P = 0.87).
Walking speed at the end of the intervention phase
To examine the robustness of the results and to explore the relationship between walking velocity and ambulatory status at the start of the study, we compared achieved walking velocity at the end of the intervention phase by ambulatory status at the start of the study.
Ambulatory participants at start of study
Ten trials with a total of 317 participants investigated independent walkers at the start of the study and provided data for walking velocity (m/s) at study end (Analysis 4.2). The use of electromechanical devices for gait rehabilitation did not significantly increase walking velocity. The pooled MD (random‐effects model) for walking velocity was ‐0.02 m/s (95% CI ‐0.10 to 0.06; P = 0.66; level of heterogeneity I² = 59%).
Ambulatory and non‐ambulatory participants at start of study
Five trials with a total of 146 participants investigated dependent and independent walkers at the start of the study and provided data for walking velocity (m/s) at study end (Analysis 4.2). The use of electromechanical devices for gait rehabilitation did not significantly increase walking velocity. The pooled MD (random‐effects model) for walking velocity was 0.03 m/s (95% CI ‐0.05 to 0.11; P = 0.44; level of heterogeneity I² = 0%).
Non‐ambulatory participants at start of study
Nine trials with a total of 522 participants investigated dependent walkers at the start of the study and provided data for walking velocity (m/s) at study end (Analysis 4.2). The use of electromechanical devices for gait rehabilitation significantly increased walking velocity. The pooled MD (random‐effects model) for walking velocity was 0.10 m/s (95% CI 0.03 to 0.17; P = 0.006; level of heterogeneity I² = 73%).
In a subgroup analysis, we did not find statistically significant differences in regaining independent walking between participants who were dependent or independent walkers at the start of the study (Chi² = 4.55, df = 2; P = 0.10).
Post hoc sensitivity analysis by type of electromechanical device
Independent walking at the end of the intervention phase
To examine the robustness of the results and to explore the relationship between independent walking and type of electromechanical device, we compared achieved independent walking rates at the end of the intervention phase by type of electromechanical device.
End‐effector devices
Eleven trials with a total of 598 participants used an end‐effector device as the experimental intervention (Table 2). As stated in the comparisons above, for some of the included trials, no effect estimate (OR) was feasible (Analysis 5.1). The use of electromechanical devices for gait rehabilitation of people after stroke did not increase the chance of walking independently (OR (random‐effects model) 1.90, 95% CI 0.99 to 3.63; P = 0.05; level of heterogeneity I² = 50%).
Exoskeleton devices
Sixteen trials with a total of 585 participants used an exoskeleton device as the experimental intervention (Table 2). The use of electromechanical devices for gait rehabilitation of people after stroke increased the chance of walking independently (OR (random‐effects model) 2.05, 95% CI 1.21 to 3.50; P = 0.008; level of heterogeneity I² = 0%).
We did not find statistically significant differences in regaining independent walking between participants treated with end‐effector or exoskeleton devices (Chi² = 0.04, df = 1; P = 0.85).
Mobile devices
Three trials with a total of 106 participants used powered mobile devices as the experimental intervention (Table 2), but the effects on walking ability were not estimable.
Ankle devices
Two trials with a total of 63 participants used ankle devices while sitting as the experimental intervention (Table 2), but the effects on walking ability were not estimable.
We did not find statistically significant differences in regaining independent walking by type of electromechanical device (end‐effector, exoskeleton, mobile or ankle device)(Chi² = 0.04, df = 1; P = 0.85).
Walking speed at the end of the intervention phase
To examine the robustness of the results and to explore the relationship between independent walking and type of electromechanical device, we compared the walking speed at the end of the intervention phase by type of electromechanical device.
End‐effector devices
Nine trials with a total of 519 participants used an end‐effector device as the experimental intervention and provided data for walking velocity (m/s) at study end (Analysis 5.2). The use of electromechanical devices for gait rehabilitation significantly increased walking velocity. The pooled MD (random‐effects model) for walking velocity was 0.11 m/s (95% CI 0.04 to 0.18; P = 0.003; level of heterogeneity I² = 73%).
Exoskeleton devices
Twelve trials with a total of 360 participants used an exoskeleton device as the experimental intervention and provided data for walking velocity (m/s) at study end (Analysis 5.2). The use of electromechanical devices for gait rehabilitation did not increase walking velocity. The pooled MD (random‐effects model) for walking velocity was ‐0.02 m/s (95% CI ‐0.08 to 0.04; P = 0.60; level of heterogeneity I² = 44%).
In a formal subgroup analysis, we found statistically significant differences in improvement in walking velocity between participants treated with an end‐effector device or an exoskeleton device (Chi² = 6.79, df = 1; P = 0.009; I² = 85.3%).
Mobile devices
Three trials with a total of 106 participants used powered mobile devices as the experimental intervention and provided data for walking velocity (m/s) at study end (Analysis 5.2). The use of electromechanical devices for gait rehabilitation did not increase walking velocity. The pooled MD (random‐effects model) for walking velocity was 0.02 m/s (95% CI ‐0.11 to 0.15; P = 0.78; level of heterogeneity I² = 0%).
Ankle devices
One trial with 39 participants used an ankle mobile device as the experimental intervention and provided data for walking velocity (m/s) at study end (Analysis 5.2). The use of electromechanical devices for gait rehabilitation increased walking velocity. The MD (random‐effects model) for walking velocity was 0.04 m/s (95% CI 0.01 to 0.07; P = 0.02; level of heterogeneity not applicable).
In a subgroup analysis, we did not find statistically significant differences in improvement in walking velocity by type of electromechanical device (end‐effector, exoskeleton, mobile or ankle device)(Chi² = 6.56, df = 3; P = 0.09; I² = 54.3%).
Walking capacity at the end of the intervention phase
To examine the robustness of the results and to explore the relationship between independent walking and type of electromechanical device, we compared the walking capacity at the end of the intervention phase by type of electromechanical device.
End‐effector devices
Four trials with a total of 328 participants used an end‐effector device as the experimental intervention and provided data for walking capacity (metres) at study end (Analysis 5.3). The use of electromechanical devices for gait rehabilitation significantly increased walking capacity. The pooled MD (random‐effects model) for walking capacity was 27.5 m (95% CI 3.63 to 51.36; P = 0.02; level of heterogeneity I² = 4%).
Exoskeleton devices
Five trials with a total of 186 participants used an exoskeleton device as the experimental intervention and provided data for walking capacity (metres) at study end (Analysis 5.3). The use of electromechanical devices for gait rehabilitation did not increase walking capacity. The pooled MD (random‐effects model) for walking capacity was ‐15.64 m (95% CI ‐46.34 to 15.05; P = 0.32; level of heterogeneity I² = 51%).
In a formal subgroup analysis, we found statistically significant differences in improvement in walking capacity between participants treated with an end‐effector device or an exoskeleton device (Chi² = 4.73, df = 1; P = 0.03; I² = 78.9%).
Mobile devices
Two trials with a total of 56 participants used powered mobile devices as the experimental intervention and provided data for walking capacity (metres) at study end (Analysis 5.3). The use of electromechanical devices for gait rehabilitation did not increase walking capacity. The pooled MD (random‐effects model) for walking capacity was 20.06 m (95% CI ‐39.52 to 79.63; P = 0.51; level of heterogeneity I² = 0%).
Ankle devices
One trial with 24 participants used an ankle mobile device as the experimental intervention and provided data for walking capacity (metres) at study end (Analysis 5.3). The use of electromechanical devices for gait rehabilitation did not increase walking capacity. The MD (random‐effects model) for walking capacity was 8.0 m (95% CI ‐83.03 to 99.03; P = 0.86; level of heterogeneity not applicable).
In a subgroup analysis, we did not find statistically significant differences in improvement in walking capacity between participants treated by type of electromechanical device (end‐effector, exoskeleton, mobile or ankle device) (Chi² = 4.81, df = 3; P = 0.19; I² = 37.7%).
Discussion
Summary of main results
The aim of this review was to evaluate the effects of electromechanical‐ and robotic‐assisted gait‐training devices (with body weight support) for improving walking after stroke. We sought to estimate the likelihood or chance of becoming independent in walking as a result of these interventions, which is a main rehabilitation goal for people who have had a stroke (Bohannon 1988; Bohannon 1991).
We included 36 trials with a total of 1472 participants and found evidence that the use of electromechanical‐assisted devices in combination with physiotherapy in rehabilitation settings may improve walking function after stroke.
Furthermore, adverse events, dropouts, and deaths do not appear to be more frequent in participants who received electromechanical‐ or robotic‐assisted gait training, which indicates that the use of electromechanical‐assisted gait‐training devices was safe and acceptable to most participants included in the trials analysed by this review.
The exclusion of certain patient groups, such as people over 80 years of age, people with unstable cardiovascular conditions, people with cognitive and communication deficits, and people with a limited range of motion in the lower limb joints at the start of the intervention, may limit the general applicability of the findings. However, using the results from the primary outcomes, it is possible to explore the apparent effectiveness of electromechanical‐assisted devices for regaining walking ability. Of 761 participants in the treatment group, 412 (54%) were walking independently at the end of the intervention phase. We used the primary outcome of independently walking at the end of the intervention phase for all included participants (OR 1.94) to calculate the number needed to treat for an additional beneficial outcome (NNTB). Together with our control event rate of 45% (325 out of 711 control participants were independently walking), we calculated an NNTB of 7 (95% CI 6 to 8) (Sackett 1996). This means that every seventh dependency in walking ability after stroke could be avoided with the use of electromechanical‐assisted devices. However, the optimum amount of electromechanical‐assisted gait training (optimal frequency, optimal duration in the use of assistive technologies and timing of application) remains unclear.
It appears that people in the acute and subacute phases after stroke profit more than people treated more than three months poststroke from this type of therapy (Analysis 3.1). This means that people may benefit more from electromechanical‐ and robotic‐assisted gait training in the first three months after stroke than after three months poststroke.
We argue that 582 (39%) of the 1472 included participants were independently walking at baseline (see Description of studies and the Characteristics of included studies table). Because people who are already ambulatory cannot regain or recover independent walking, our effect estimate could have been influenced by performance bias. We therefore performed two further sensitivity analyses by ambulatory status at the start of the study (Analysis 4.1 and Analysis 4.2).
We found that studies that included mainly dependent walkers (i.e. participants who were non‐ambulatory at the start of the study) were more likely to report that these participants were able to walk at study end and to reach greater walking velocities at the end of the intervention phase compared with participants who were already ambulatory at the start of the study (Analysis 4.1; Analysis 4.2). This means that ambulatory people do not benefit from electromechanical‐ and robotic‐assisted gait training.
We found that the ability to walk at study end was not dependent on the type of device used in the studies (Analysis 5.1). However, walking velocities at the end of the intervention phase were higher when end‐effector devices were used compared with participants who received training by an exoskeleton device (Analysis 5.2), meaning that the type of device used could play a role in improving walking function after stroke. This is in line with the former version of this review from 2013, Mehrholz 2013, and another review that compared the effects of different types of devices on walking ability after stroke (Mehrholz 2012a). However, in the absence of a direct empirical comparison between electromechanical‐assisted gait‐training devices, this point warrants further investigation.
Overall completeness and applicability of evidence
In all systematic reviews the risk of publication bias is present. However, we performed an extensive search for relevant literature in electronic databases and handsearched conference abstracts. Additionally, we contacted and asked authors, trialists, and experts in the field for other unpublished and ongoing trials.
Upon visual inspection, we did not detect graphical evidence of publication bias (see Figure 3 and Figure 4).

Funnel plot of comparison: 1 Electromechanical‐ and robotic‐assisted gait training plus physiotherapy versus physiotherapy (or usual care), outcome: 1.1 Independent walking at the end of intervention phase, all electromechanical devices used.

Funnel plot of comparison: 1 Electromechanical‐ and robotic‐assisted gait training plus physiotherapy versus physiotherapy (or usual care), outcome: 1.3 Walking velocity (metres per second) at the end of intervention phase.
Given that we found several ongoing studies of substantial size, it is possible that these ongoing studies could potentially impact our overall conclusion when they are included in the review (see Characteristics of ongoing studies).
It is not clear whether the observed differences between experimental and control groups depend on the intensity of therapy, in terms of repetitions of gait practice. Time devoted to therapy is a crude measure of intensity. A 30‐minute therapy session could include no walking practice or high‐intensity walking practice with many steps taken. Reviews of the effectiveness of arm robotic therapy suggest that the positive benefit of robotic therapy may be lost when the intensity of practice is matched between experimental and control groups (Mehrholz 2012b). However, the numbers of repetitions in the experimental and control groups were not exactly counted in any of the included studies. Further studies should therefore ascertain whether the benefits described here are still apparent when the intensity of gait practice (e.g. step repetitions) is exactly matched between groups.
It should be mentioned that we do not know yet whether these devices provide any cost benefit. Further studies should investigate, under the premise that gait practice is matched in terms of objective measures of intensity, the long‐term costs of regaining walking ability and the cost‐effectiveness of these devices.
Quality of the evidence
There was heterogeneity between the trials in terms of trial design (two arms, three arms, parallel‐group or cross‐over trial, duration of follow‐up, and selection criteria for participants), characteristics of the therapy interventions (especially duration of the intervention), and participant characteristics (length of time since stroke onset and stroke severity at baseline). We noted methodological differences in the mechanisms of randomisation and in the allocation concealment methods used, as well as in the blinding of primary outcomes and the presence or use of intention‐to‐treat analysis.
After examining the effects of methodological quality on the odds of independence in walking, we found that the benefits were relatively robust when we removed trials with an inadequate sequence generation process, inadequate concealed allocation, no blinded assessors for the primary outcome, and incomplete outcome data (Analysis 2.1). However, we found that the odds of independence in walking were slightly lower after the largest included study (Pohl 2007, N = 155) was removed, but a statistically significant and clinically relevant benefit for participants is still observed.
Although the methodological quality of the included trials seemed generally good to moderate (Figure 2), trials investigating electromechanical‐ and robotic‐assisted gait‐training devices are subject to potential methodological limitations. These include inability to blind the therapist and participants, so‐called contamination (provision of the intervention to the control group), and co‐intervention (when the same therapist unintentionally provides additional care to either treatment or comparison group). All these potential methodological limitations introduce the possibility of performance bias. However, as discussed previously, this was not supported in our sensitivity analyses by methodological quality.
The quality of the evidence for automated electromechanical‐ and robotic‐assisted gait‐training devices for improving walking after stroke was moderate. The quality of the evidence was low for walking speed, very low for walking capacity, and low for adverse events and people discontinuing treatment.
Potential biases in the review process
In all systematic reviews the risk of publication bias is present. However, we performed an extensive search for relevant literature in electronic databases and handsearched conference abstracts. Additionally, we contacted and asked authors, trialists, and experts in the field for other unpublished and ongoing trials.
Upon visual inspection, we did not detect graphical evidence of publication bias (see Figure 3 and Figure 4).
Given that we found several ongoing studies of substantial size, it is possible that these ongoing studies could potentially impact our overall conclusion (see Characteristics of ongoing studies).
Agreements and disagreements with other studies or reviews
The most recent and relevant review describes the effects of new so‐called powered mobile solutions (Louie 2016). We included three studies of mobile devices in this update. When pooling these results, we did not find significant improvements in walking speed and walking capacity; this result is in agreement with the recent review of Louie 2016. Additionally, there are two new studies describing the effects of ankle robots (Forrester 2014; Waldman 2013) to improve walking were described. When pooling these studies, we did not find significant improvements in walking speed and walking capacity. We are not aware of any systematic review about this type of devices so far.

Study flow diagram.

Risk of bias summary: review authors' judgements about each risk of bias item for each included study.
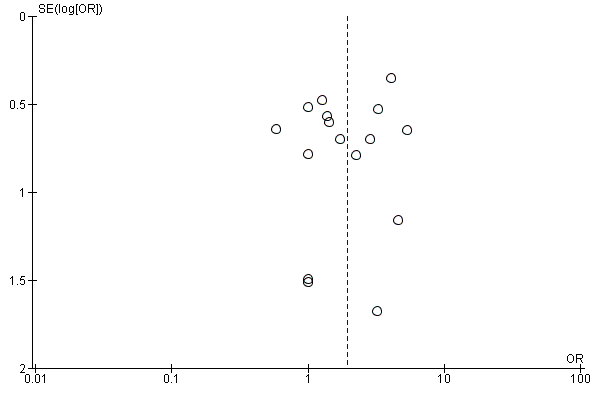
Funnel plot of comparison: 1 Electromechanical‐ and robotic‐assisted gait training plus physiotherapy versus physiotherapy (or usual care), outcome: 1.1 Independent walking at the end of intervention phase, all electromechanical devices used.

Funnel plot of comparison: 1 Electromechanical‐ and robotic‐assisted gait training plus physiotherapy versus physiotherapy (or usual care), outcome: 1.3 Walking velocity (metres per second) at the end of intervention phase.
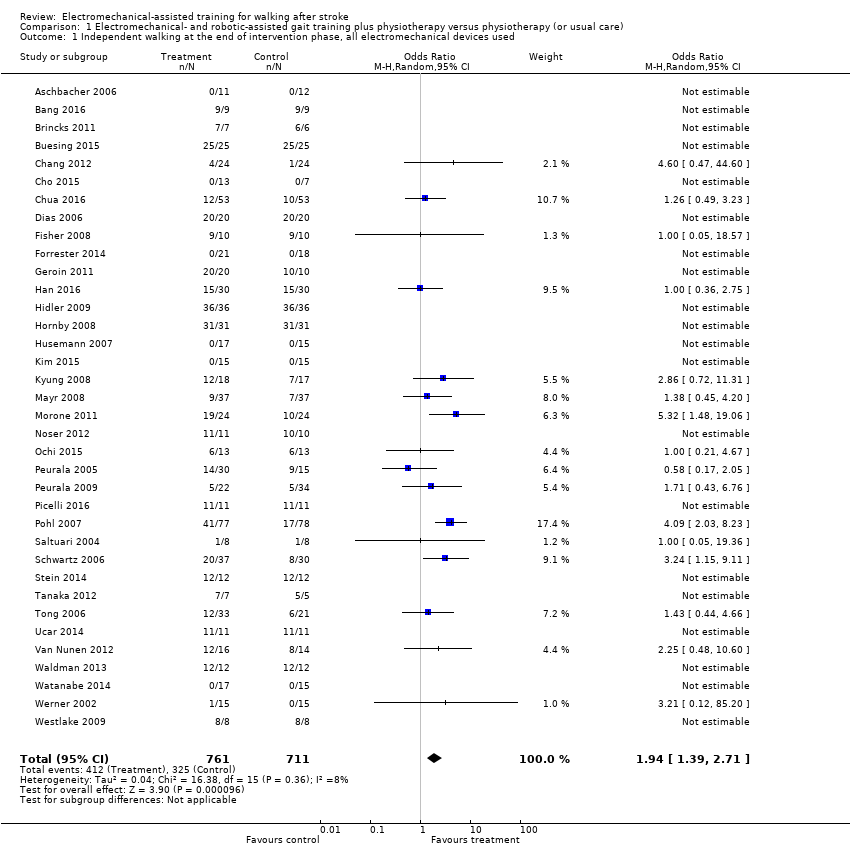
Comparison 1 Electromechanical‐ and robotic‐assisted gait training plus physiotherapy versus physiotherapy (or usual care), Outcome 1 Independent walking at the end of intervention phase, all electromechanical devices used.

Comparison 1 Electromechanical‐ and robotic‐assisted gait training plus physiotherapy versus physiotherapy (or usual care), Outcome 2 Recovery of independent walking at follow‐up after study end.

Comparison 1 Electromechanical‐ and robotic‐assisted gait training plus physiotherapy versus physiotherapy (or usual care), Outcome 3 Walking velocity (metres per second) at the end of intervention phase.
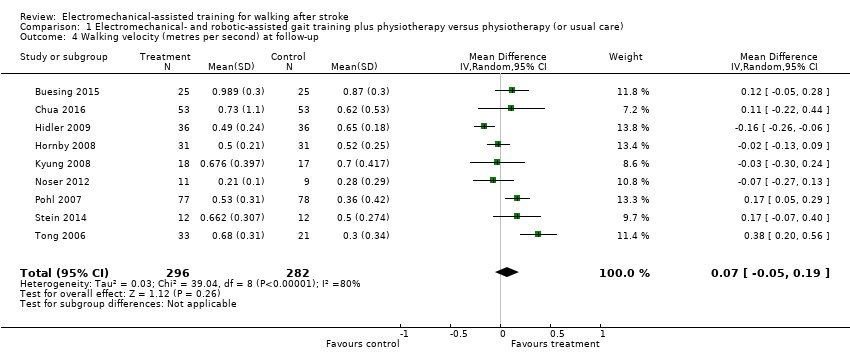
Comparison 1 Electromechanical‐ and robotic‐assisted gait training plus physiotherapy versus physiotherapy (or usual care), Outcome 4 Walking velocity (metres per second) at follow‐up.
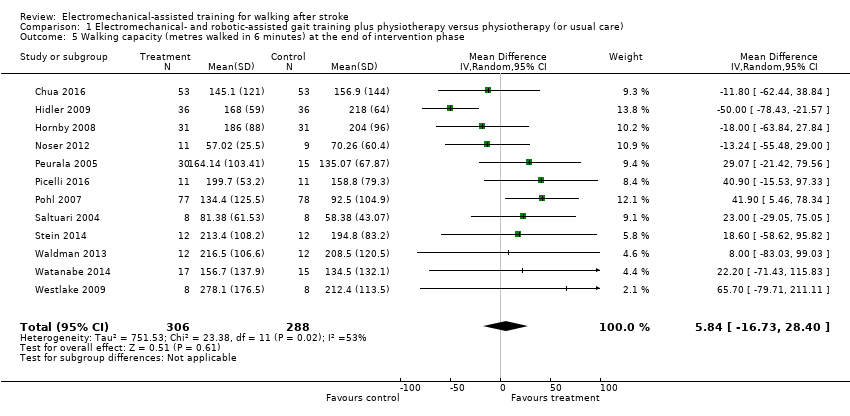
Comparison 1 Electromechanical‐ and robotic‐assisted gait training plus physiotherapy versus physiotherapy (or usual care), Outcome 5 Walking capacity (metres walked in 6 minutes) at the end of intervention phase.
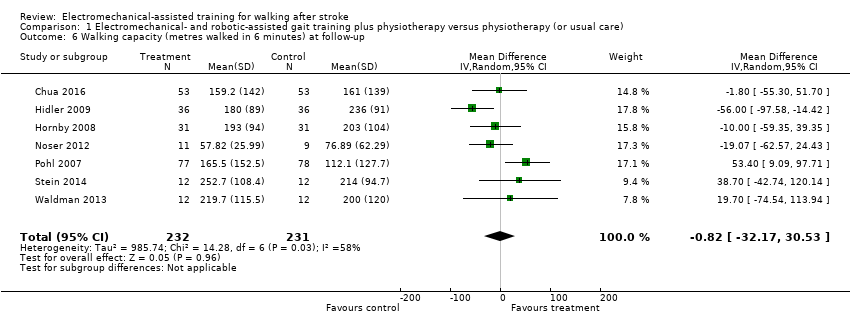
Comparison 1 Electromechanical‐ and robotic‐assisted gait training plus physiotherapy versus physiotherapy (or usual care), Outcome 6 Walking capacity (metres walked in 6 minutes) at follow‐up.

Comparison 1 Electromechanical‐ and robotic‐assisted gait training plus physiotherapy versus physiotherapy (or usual care), Outcome 7 Acceptability of electromechanical‐assisted gait training devices during intervention phase: dropouts.

Comparison 1 Electromechanical‐ and robotic‐assisted gait training plus physiotherapy versus physiotherapy (or usual care), Outcome 8 Death from all causes until the end of intervention phase.

Comparison 2 Planned sensitivity analysis by trial methodology, Outcome 1 Regaining independent walking ability.

Comparison 3 Subgroup analysis comparing participants in acute and chronic phases of stroke, Outcome 1 Independent walking at the end of intervention phase, all electromechanical devices used.

Comparison 4 Post hoc sensitivity analysis: ambulatory status at study onset, Outcome 1 Recovery of independent walking: ambulatory status at study onset.
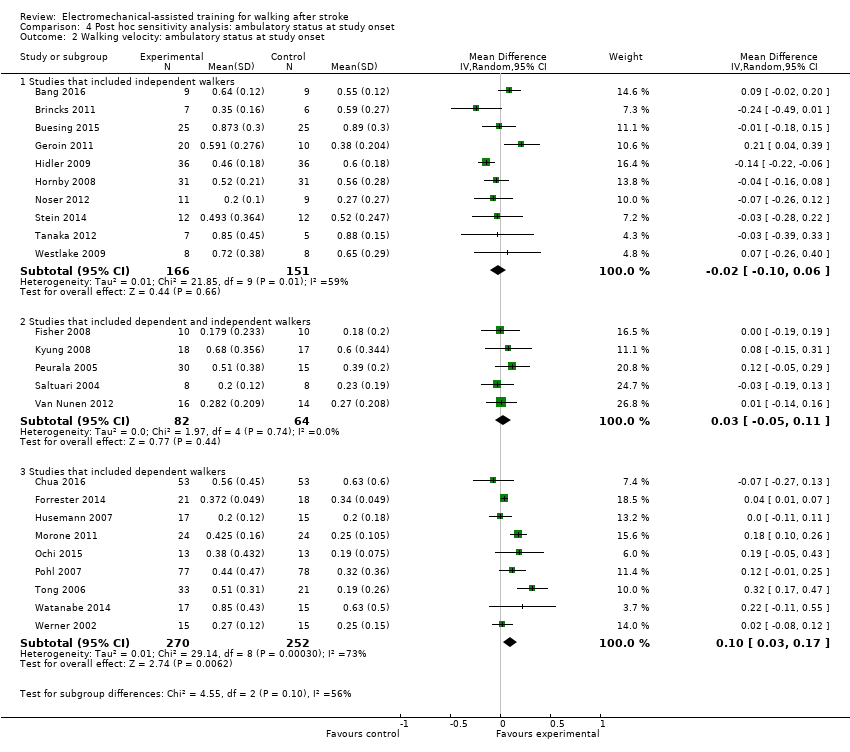
Comparison 4 Post hoc sensitivity analysis: ambulatory status at study onset, Outcome 2 Walking velocity: ambulatory status at study onset.
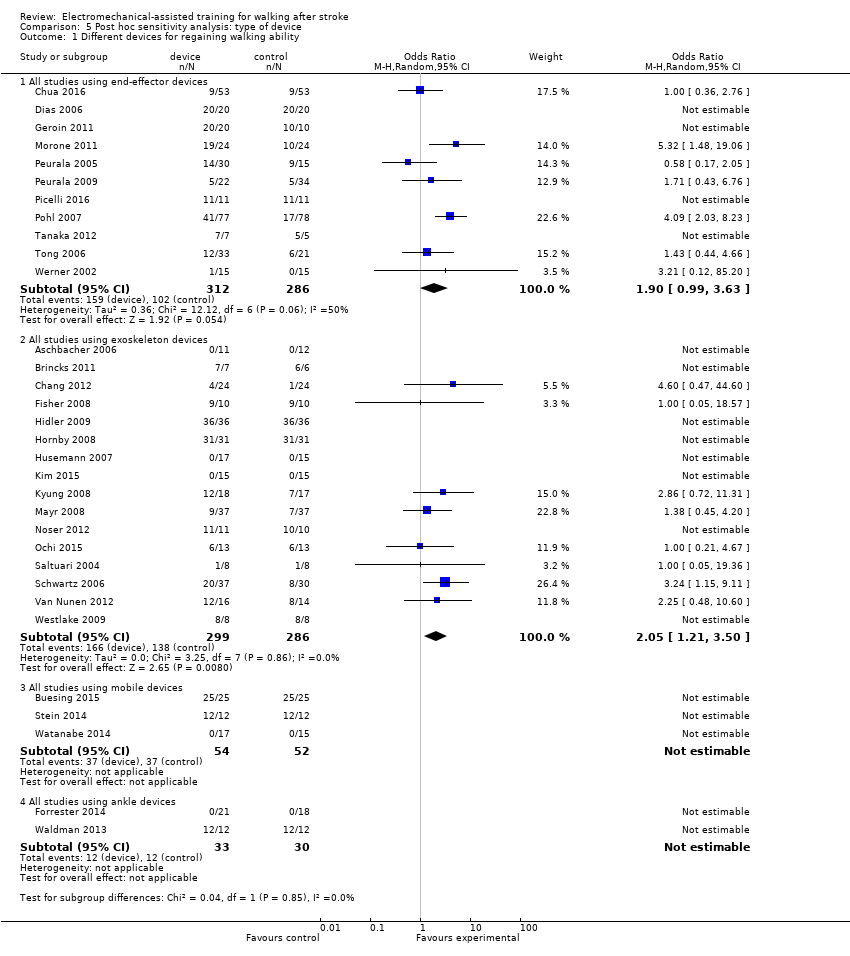
Comparison 5 Post hoc sensitivity analysis: type of device, Outcome 1 Different devices for regaining walking ability.

Comparison 5 Post hoc sensitivity analysis: type of device, Outcome 2 Different devices for regaining walking speed.

Comparison 5 Post hoc sensitivity analysis: type of device, Outcome 3 Different devices for regaining walking capacity.
| Electromechanical‐ and robotic‐assisted gait training plus physiotherapy compared to physiotherapy (or usual care) for walking after stroke | ||||||
| Patient or population: walking after stroke | ||||||
| Outcomes | Anticipated absolute effects* (95% CI) | Relative effect | № of participants | Quality of the evidence | Comments | |
| Risk with physiotherapy (or usual care) | Risk with electromechanical‐ and robotic‐assisted gait training plus physiotherapy | |||||
| Independent walking at the end of intervention phase, all electromechanical devices used | Study population | OR 1.94 | 1472 | ⊕⊕⊕⊝ | ||
| 457 per 1000 | 615 per 1000 | |||||
| Recovery of independent walking at follow‐up after study end | Study population | OR 1.93 | 496 | ⊕⊕⊕⊝ | ||
| 551 per 1000 | 703 per 1000 | |||||
| Walking velocity (metres per second) at the end of intervention phase | The mean walking velocity (metres per second) at the end of intervention phase was 0. | MD 0.04 higher | ‐ | 985 | ⊕⊕⊝⊝ | |
| Walking velocity (metres per second) at follow‐up | The mean walking velocity (metres per second) at follow‐up was 0. | MD 0.07 higher | ‐ | 578 | ⊕⊕⊕⊝ | |
| Walking capacity (metres walked in 6 minutes) at the end of intervention phase | The mean walking capacity (metres walked in 6 minutes) at the end of intervention phase was 0. | MD 5.84 higher | ‐ | 594 | ⊕⊝⊝⊝ | |
| Walking capacity (metres walked in 6 minutes) at follow‐up | The mean walking capacity (metres walked in 6 minutes) at follow‐up was 0. | MD 0.82 lower | ‐ | 463 | ⊕⊝⊝⊝ | |
| Acceptability of electromechanical‐assisted gait‐training devices during intervention phase | Study population | OR 0.67 | 1472 | ⊕⊕⊝⊝ | ||
| 131 per 1000 | 92 per 1000 | |||||
| *The risk in the intervention group (and its 95% confidence interval) is based on the assumed risk in the comparison group and the relative effect of the intervention (and its 95% CI). | ||||||
| GRADE Working Group grades of evidence | ||||||
| 1Downgraded due to several ratings of 'unclear' and 'high' risk of bias. | ||||||
| Study ID | Experimental: age, mean (SD) | Control: age, mean (SD) | Experimental: time poststroke | Control: time poststroke | Experimental: sex | Control: sex | Experimental: side paresis | Control: side paresis |
| 57 years | 65 years | ≤ 3 months | ≤ 3 months | 2 female | 4 female | Not stated | Not stated | |
| 54 years | 54 years | 12 months | 13 months | 5 male, 4 female | 4 male, 5 female | 4 right, 5 left | 4 right, 5 left | |
| 61 (median) years | 59 (median) years | 56 (median) days | 21 (median) days | 5 male, 2 female | 4 male, 2 female | 5 right, 2 left | 1 right, 5 left | |
| 60 years | 62 years | 7 years | 5 years | 17 male, 8 female | 16 male, 9 female | 13 right, 12 left | 12 right, 13 left | |
| 56 (12) years | 60 (12) years | 16 (5) days | 18 (5) days | 13 male, 7 female | 10 male, 7 female | 6 right, 14 left | 6 right, 11 left | |
| 55 (12) years | 55 (15) years | 15 months | 13 months | Not stated | Not stated | 6 right, 4 left (4 both) | 3 right, 1 left (3 both) | |
| 62 (10) years | 61 (11) years | 27 (11) days | 30 (14) days | 35 male, 18 female | 40 male, 13 female | 24 right, 29 left | 21 right, 32 left | |
| 70 (7) years | 68 (11) years | 47 (64) months | 48 (30) months | 16 male, 4 female | 14 male, 6 female | Not stated | Not stated | |
| Not stated | Not stated | Less than 12 months | Less than 12 months | Not stated | Not stated | Not stated | Not stated | |
| 63 years | 60 years | 12 days | 11 days | Not stated | Not stated | 9 right, 9 left | 7 right, 9 left | |
| 63 (7) years | 61 (6) years | 26 (6) months | 27 (6) months | 14 male, 6 female | 9 male, 1 female | Not stated | Not stated | |
| 68 (15) years | 63 (11) years | 22 (8) days | 18 (10) days | Not stated | Not stated | 20 right, 10 left | 14 right, 12 left | |
| 60 (11) years | 55 (9) years | 111 (63) days | 139 (61) days | 21 male, 12 female | 18 male, 12 female | 22 right, 11 left | 13 right, 17 left | |
| 57 (10) years | 57 (11) years | 50 (51) months | 73 (87) months | 15 male, 9 female | 15 male, 9 female | 16 right, 8 left | 16 right, 8 left | |
| 60 (13) years | 57 (11) years | 79 (56) days | 89 (61) days | 11 male, 5 female | 10 male, 4 female | 12 right, 4 left | 11 right, 3 left | |
| 54 (13) years | 50 (16) years | 80 (60) days | 120 (84) days | 9 male, 4 female | 10 male, 3 female | 8 right, 5 left | 10 right, 3 left | |
| 48 (8) years | 55 (16) years | 22 (23) months | 29 (12) months | 9 male, 8 female | 4 male, 4 female | 9 right, 8 left | 4 right, 4 left | |
| Not stated | Not stated | Between 10 days and 6 months | Between 10 days and 6 months | Not stated | Not stated | Not stated | Not stated | |
| 62 (11) years | 62 (14) years | 19 (11) days | 20 (14) days | 15 male, 9 female | 13 male, 11 female | 13 right, 11 left | 15 right, 9 left | |
| 67 (9) years | 64 (11) years | 1354 days | 525 days | 7 male, 4 female | 6 male, 4 female | Not stated | Not stated | |
| 62 (8) years | 66 (12) years | 23 (7) days | 26 (8) days | 11 male, 2 female | 9 male, 4 female | 6 right, 7 left | 5 right, 8 left | |
| 52 (8) years | 52 (7) years | 2.5 (2.5) years | 4.0 (5.8) years | 26 male, 4 female | 11 male, 4 female | 13 right, 17 left | 10 right, 5 left | |
| 67 (9) years | 68 (10) years | 8 (3) days | 8 (3) days | 11 male, 11 female | 18 male, 16 female | 11 right, 11 left | 14 right, 20 left | |
| 62 (10) years | 65 (3) years | 6 (4) years | 6 (4) years | 7 male, 4 female | 9 male, 2 female | Not stated | Not stated | |
| 62 (12) years | 64 (11) years | 4.2 (1.8) weeks | 4.5 (1.9) weeks | 50 male, 27 female | 54 male, 24 female | 36 right, 41 left | 33 right, 45 left | |
| 62 (13) years | 60 (19) years | 3.6 (4.6) months | 1.9 (0.8) months | 4 male, 4 female | 2 male, 6 female | Not stated | Not stated | |
| 62 (9) years | 65 (8) years | 22 (9) days | 24 (10) days | 21 male, 16 female | 20 male, 10 female | 17 right, 20 left | 8 right, 22 left | |
| 58 (11) years | 57 (15) years | 49 (39) months | 89 (153) months | Not stated | Not stated | Not stated | Not stated | |
| 63 (10) years | 60 (9) years | 55 (37) months | 65 (67) months | 10 male, 2 female | 9 right, 3 left | |||
| 71 (14) years | 64 (10) years | 2.5 (1.2) weeks | 2.7 (1.2) weeks | 19 male, 11 female | 12 male, 8 female | 13 right, 17 left | 7 right, 13 left | |
| 56 years | 62 years | Not stated | Not stated | Not stated | Not stated | Not stated | Not stated | |
| 53 (10) years | 2.1 (1.3) months | 16 male, 14 female | Not stated | Not stated | ||||
| 51 (8) years | 53 (7) years | 41 (20) months | 30 (22) months | Not stated | Not stated | Not stated | Not stated | |
| 67 (17) years | 76 (14) years | 59 (47) days | 51 (34) days | 7 male, 4 female | 4 male, 7 female | 6 right, 5 left | 5 right, 6 left | |
| 60 (9) years | 60 (9) years | 7.4 (2.0) weeks | 6.9 (2.1) weeks | 8 male, 7 female | 5 male, 10 female | 8 right, 7 left | 8 right, 7 left | |
| 59 (17) years | 55 (14) years | 44 (27) months | 37 (20) months | 6 male, 2 female | 7 male, 1 female | 4 right, 4 left | 3 right, 5 left | |
| SD: standard deviation | ||||||||
| Criteria | Stroke severity | Electromechanical device used | Duration of study intervention | Aetiology (ischaemic/haemorrhage) | Intensity of treatment per day | Description of the control intervention | Dropouts | Reasons for dropout and adverse events in the experimental group | Reasons for dropout and adverse events in the control group | Source of information |
| Not stated | Lokomat | 3 weeks | Not stated | 30 minutes, 5 times a week | Described as task‐oriented physiotherapy, 5 times a week for 3 weeks (2.5 hours a week) | 4 of 23 | Not stated | Not stated | Unpublished information in the form of a conference presentation | |
| Unclear | Lokomat | 4 weeks | 13/5 | 60 minutes, 5 times a week (20 sessions) | Described as treadmill training without body weight support | 0 of 18 | ‐ | ‐ | Published information | |
| Mean FIM, 92 of 126 points | Lokomat | 3 weeks | Not stated | Not stated | Physiotherapy | 0 of 13 | ‐ | ‐ | Unpublished and published information provided by the authors. | |
| Unclear | Wearable exoskeleton Stride Management Assist system (SMA) | 6 to 8 weeks | Unclear | 3 times per week for a maximum of 18 sessions | Functional task‐specific training (intensive overground training and mobility training) | 0 of 50 | ‐ | ‐ | Published information | |
| Not stated | Lokomat | 10 days | Not stated | 30 minutes daily for 10 days | Conventional gait training by physical therapists (with equal therapy time and same amount of sessions as experimental group) | 3 of 40 | Not described by group (3 participants dropped out: 1 due to aspiration pneumonia, and 2 were unable to co‐operate fully with the experimental procedure) | Unpublished and published information provided by the authors. | ||
| Mean Modified Barthel Index, 36 points | Lokomat | 8 weeks (2 phases, cross‐over after 4 weeks) | 4/14 (2 both) | 30 minutes, 3 times a week for 4 weeks | Bobath (neurophysiological exercises, inhibition of spasticity and synergy pattern) | 0 of 20 | ‐ | ‐ | Published information | |
| Mean Barthel Index, 49 points | Gait Trainer | 8 weeks | Not stated | Not stated | Physiotherapy including 25 minutes of stance/gait, 10 minutes cycling, 10 minutes tilt table standing | 20 of 106 | 2 death, 3 refusal, 1 medical problem, 1 transport problem (1 pain as adverse event) | 1 death, 6 refusal, 3 medical problem, 1 administrative problem (no adverse events) | Published information | |
| Mean Barthel Index, 75 points | Gait Trainer | 4 weeks | Not stated | 40 minutes, 5 times a week | Bobath method, 5 times a week for 5 weeks | 0 of 40 | ‐ | ‐ | Unpublished and published information provided by the authors. | |
| Not stated | AutoAmbulator | 24 sessions | Not stated | Minimum of 3 sessions a week up to 5 sessions; number of minutes in each session unclear | "Standard" physical therapy, 3 to 5 times a week for 24 consecutive sessions | 0 of 20 | 14 adverse events, no details provided | 11 adverse events, no details provided | Unpublished and published information provided by the authors. | |
| Mean FIM walk 1 point | Anklebot | 8 to 10 sessions (with ca. 200 repetitions) | Not stated | 60 minutes, 8 to 10 sessions | Stretching of the paretic ankle | 5 of 34 | Total of 5 dropouts in both groups (1 medical complication, 1 discharge prior study end, 2 time poststroke > 49 days, 1 non‐compliance) | Published information provided by the authors. | ||
| Mean European Stroke Scale, 80 points | Gait Trainer | 2 weeks | Not stated | 50 minutes, 5 times a week | Walking exercises according to the Bobath approach | 0 of 30 | ‐ | ‐ | Unpublished and published information provided by the authors. | |
| Not stated | Lokomat | 4 weeks | 33/23 | 30 minutes, 5 times a week | Neurodevelopmental techniques for balance and mobility | 4 0f 60 | ‐ | 4 unclear reasons | Published information provided by the authors. | |
| Not stated | Lokomat | 8 to 10 weeks (24 sessions) | 47/16 | 45 minutes, 3 days a week | Conventional gait training, 3 times a week for 8 to 10 weeks (24 sessions), each session lasted 1.5 hours | 9 of 72 | Not described by group (9 withdrew or were removed because of poor attendance or a decline in health, including 1 death, which according to the authors was unrelated to study) | Unpublished and published information provided by the authors. | ||
| Not stated | Lokomat | 12 sessions | 22/26 | 30 minutes, 12 sessions | Therapist‐assisted gait training, 12 sessions, each session lasted 30 minutes | 14 of 62 | 4 participants dropped out (2 discontinued secondary to leg pain during training, 1 experienced pitting oedema, and 1 had travel limitations) | 10 participants dropped out (4 discontinued secondary to leg pain, 1 experienced an injury outside therapy, 1 reported fear of falling during training, 1 presented with significant hypertension, 1 had travel limitations, and 2 experienced subjective exercise intolerance) | Published information provided by the authors. | |
| Median Barthel Index, 35 points | Lokomat | 4 weeks | 22/8 | 30 minutes, 5 times a week | Conventional physiotherapy, 30 minutes per day for 4 weeks | 2 of 32 | 1 participant enteritis | 1 participant pulmonary embolism | Information as provided by the authors | |
| Mean Barthel Index, 20 points | Walkbot | 4 weeks | 13/13 | 30 minutes, 5 times a week | Conventional physiotherapy (bed mobility, stretching, balance training, strengthening, symmetry training, treadmill training) | 4 of 30 | 1 rib fracture, 3 decline in health condition | Information as provided by the authors | ||
| Not stated | Lokomat | 4 weeks | 18/7 | 45 minutes, 3 days a week | Conventional physiotherapy, received equal time and sessions of conventional gait training | 10 of 35 | 1 participant dropped out for private reasons (travelling); adverse events not described | 9 participants refused after randomisation (reasons not provided); adverse events not described | Unpublished and published information provided by the authors. | |
| Not stated | Lokomat | 8 weeks | Not stated | Not stated | Add‐on conventional physiotherapy, received equal time and sessions of conventional gait training | 13 of 74 | 4 participants dropped out (reasons not provided); adverse events not described | 9 participants dropped out (reasons not provided) | Unpublished and published information provided by the authors. | |
| Canadian Neurological Scale, 6 points | Gait Trainer | 4 weeks | 41/7 | 40 minutes, 5 times a week | Focused on trunk stabilisation, weight transfer to the paretic leg, and walking between parallel | 21 of 48 | 12 (hypotension, referred weakness, knee pain, urinary infection, uncontrolled blood pressure, fever, absence of physiotherapist) | 9 (hypotension, referred weakness, knee pain, ankle pain, uncontrolled blood pressure, fever, absence of physiotherapist) | Information as provided by the authors | |
| Not stated | Lokomat | Unclear | Not stated | Not stated | Not stated | 1 of 21 | No dropouts; 2 serious adverse events (1 skin breakdown as a result of therapy, 1 second stroke during the post‐treatment phase) | 1 dropout due to protocol violation; 2 serious adverse events (1 sudden drop in blood pressure at participant's home leading to brief hospitalisation, 1 sudden chest pain before therapy leading to brief hospitalisation) | Information as provided by the authors | |
| Not stated | Gait‐assistance robot (consisting of 4 robotic arms for the thighs and legs, thigh cuffs, leg apparatuses, and a treadmill) | 4 weeks | 10/16 | 20 minutes, 5 times a week for 4 weeks, in addition to rehabilitation treatment | Range‐of‐motion exercises, muscle strengthening, rolling over and sit‐to‐stand and activity and gait exercises | 0 of 26 | ‐ | ‐ | Published information | |
| Scandinavian Stroke Scale, 42 points | Gait Trainer | 3 weeks | 25/20 | 20 minutes, 5 times a week for 3 weeks, in addition to rehabilitation treatment | Walking overground; all participants practised gait for 15 sessions over 3 weeks (each session lasting 20 minutes) | 0 of 45 | ‐ | ‐ | Published information | |
| Not stated | Gait Trainer | 3 weeks | 42/14 | 20 minutes, 5 times a week for 3 weeks, in addition to rehabilitation treatment | Overground walking training; in the other control group, 1 or 2 physiotherapy sessions daily but not at the same intensity as in the other groups | 9 of 56 | 5 dropouts (2 situation worsened after 1 to 2 treatment days; 1 had 2 unsuccessful attempts in device; 1 had scheduling problems; 1 felt protocol too demanding) | 4 dropouts (1 felt protocol too demanding; 2 situation worsened after 1 to 2 treatment days; 1 death) | Published information | |
| Not stated | G‐EO System Evolution | Experimental group (G‐EO) 30 minutes a day for 5 consecutive days | Not stated | 5 days in addition to botulinum toxin injection of calf muscles | None | 0 of 22 | ‐ | ‐ | Published information | |
| Mean Barthel Index, 37 points | Gait Trainer | 4 weeks | 124/31 | 20 minutes, 5 times a week | Physiotherapy every weekday for 4 weeks | 11 of 155 | 2 participants refused therapy, 1 increased cranial pressure, 1 relapsing pancreas tumour, 1 cardiovascular unstable | 4 participants refused therapy, 1 participant died, 1 myocardial infarction | Published information | |
| Not stated | Lokomat | 2 weeks | 13/3 | A‐B‐A study: in phase A, 30 minutes, 5 days a week | Physiotherapy every weekday for 3 weeks (phase B) | 0 of 16 | None | None | Unpublished and published information provided by the authors. | |
| Mean NIHSS, 11 points | Lokomat | 6 weeks | 49/67 | 30 minutes, 3 times a week | Physiotherapy with additional gait training 3 times a week for 6 weeks | 6 of 46 | 2 participants with leg wounds, 1 participant with recurrent stroke, 1 refused therapy | 1 participant with recurrent stroke, 1 with pulmonary embolism | Unpublished and published information provided by the authors. | |
| Not stated | Bionic leg device (AlterG) | 6 weeks | Not stated | 1 hour, 3 times a week for 6 weeks | Group exercises | 0 of 24 | ‐ | ‐ | Published information | |
| Mean FIM, 79 points | Gait Master4 | 4 weeks | Not stated | 20 minutes, 2 or 3 times a week (12 sessions) | Non‐intervention (non‐training) | 0 of 12 | ‐ | ‐ | Published information | |
| Mean Barthel Index, 51 points | Gait Trainer | 4 weeks | 39/11 | 20 minutes, 5 times a week | Conventional physiotherapy alone, based on Bobath concept | 4 of 50 | None | 2 participants discharged before study end, 1 participant readmitted to an acute ward, 1 participant deteriorating condition | Published information | |
| Not stated | Lokomat | 2 weeks | Not stated | 30 minutes, 5 times a week | Conventional physiotherapy at home (focused on gait) | 0 of 22 | ‐ | ‐ | Published information | |
| Not stated | Lokomat | 8 weeks | Not stated | 30 minutes, twice a week | Overground therapy | 0 of 30 | ‐ | ‐ | Unpublished and published information provided by the author. | |
| Not stated | Portable rehab robot (ankle device) | 6 weeks | Not stated | 3 times a week, 18 sessions | Stretching the plantar flexors and active exercises for ankle mobility and strength | 0 of 24 | ‐ | ‐ | Published information | |
| Not stated | Single‐leg version of the Hybrid Assistive Limb (HAL) | 4 weeks | 11/11 | 20 minutes, 12 sessions | Aimed to improve walking speed, endurance, balance, postural stability, and symmetry | 10 of 32 | 4 withdrew, 1 epilepsy, 1 technical reasons | 2 pneumonia, 2 discharged | Published information | |
| Mean Barthel Index, 38 points | Gait Trainer | 2 weeks | 13/12 | 20 minutes, 5 times a week | Gait therapy including treadmill training with body weight support | 0 of 30 | None | None | Published information | |
| Not stated | Lokomat | 4 weeks (12 sessions) | 8/8 | 30 minutes, 3 times a week | 12 physiotherapy sessions including manually guided gait training (3 times a week over 4 weeks) | 0 of 16 | None | None | Published information | |
| FIM: Functional Independence Measure | ||||||||||
| Outcome or subgroup title | No. of studies | No. of participants | Statistical method | Effect size |
| 1 Independent walking at the end of intervention phase, all electromechanical devices used Show forest plot | 36 | 1472 | Odds Ratio (M‐H, Random, 95% CI) | 1.94 [1.39, 2.71] |
| 2 Recovery of independent walking at follow‐up after study end Show forest plot | 6 | 496 | Odds Ratio (M‐H, Random, 95% CI) | 1.93 [0.72, 5.13] |
| 3 Walking velocity (metres per second) at the end of intervention phase Show forest plot | 24 | 985 | Mean Difference (IV, Random, 95% CI) | 0.04 [‐0.00, 0.09] |
| 4 Walking velocity (metres per second) at follow‐up Show forest plot | 9 | 578 | Mean Difference (IV, Random, 95% CI) | 0.07 [‐0.05, 0.19] |
| 5 Walking capacity (metres walked in 6 minutes) at the end of intervention phase Show forest plot | 12 | 594 | Mean Difference (IV, Random, 95% CI) | 5.84 [‐16.73, 28.40] |
| 6 Walking capacity (metres walked in 6 minutes) at follow‐up Show forest plot | 7 | 463 | Mean Difference (IV, Random, 95% CI) | ‐0.82 [‐32.17, 30.53] |
| 7 Acceptability of electromechanical‐assisted gait training devices during intervention phase: dropouts Show forest plot | 36 | 1472 | Odds Ratio (M‐H, Random, 95% CI) | 0.67 [0.43, 1.05] |
| 8 Death from all causes until the end of intervention phase Show forest plot | 36 | 1472 | Risk Difference (M‐H, Random, 95% CI) | 0.00 [‐0.01, 0.02] |
| Outcome or subgroup title | No. of studies | No. of participants | Statistical method | Effect size |
| 1 Regaining independent walking ability Show forest plot | 36 | Odds Ratio (M‐H, Random, 95% CI) | Subtotals only | |
| 1.1 All studies with adequate sequence generation process | 20 | 949 | Odds Ratio (M‐H, Random, 95% CI) | 1.80 [1.06, 3.08] |
| 1.2 All studies with adequate concealed allocation | 17 | 831 | Odds Ratio (M‐H, Random, 95% CI) | 1.87 [1.12, 3.12] |
| 1.3 All studies with blinded assessors for primary outcome | 16 | 762 | Odds Ratio (M‐H, Random, 95% CI) | 1.81 [1.10, 2.98] |
| 1.4 All studies without incomplete outcome data | 14 | 590 | Odds Ratio (M‐H, Random, 95% CI) | 2.23 [1.16, 4.29] |
| 1.5 All studies excluding the largest study Pohl 2007 | 35 | 1317 | Odds Ratio (M‐H, Random, 95% CI) | 1.65 [1.17, 2.34] |
| Outcome or subgroup title | No. of studies | No. of participants | Statistical method | Effect size |
| 1 Independent walking at the end of intervention phase, all electromechanical devices used Show forest plot | 36 | Odds Ratio (IV, Random, 95% CI) | Subtotals only | |
| 1.1 Acute phase: less than or equal to 3 months after stroke | 20 | 1143 | Odds Ratio (IV, Random, 95% CI) | 1.90 [1.38, 2.63] |
| 1.2 Chronic phase: more than 3 months after stroke | 16 | 461 | Odds Ratio (IV, Random, 95% CI) | 1.20 [0.40, 3.65] |
| Outcome or subgroup title | No. of studies | No. of participants | Statistical method | Effect size |
| 1 Recovery of independent walking: ambulatory status at study onset Show forest plot | 36 | Odds Ratio (M‐H, Random, 95% CI) | Subtotals only | |
| 1.1 Studies that included independent walkers | 15 | 500 | Odds Ratio (M‐H, Random, 95% CI) | 1.38 [0.45, 4.20] |
| 1.2 Studies that included dependent and independent walkers | 9 | 340 | Odds Ratio (M‐H, Random, 95% CI) | 1.90 [1.11, 3.25] |
| 1.3 Studies that included dependent walkers | 12 | 632 | Odds Ratio (M‐H, Random, 95% CI) | 1.90 [1.04, 3.48] |
| 2 Walking velocity: ambulatory status at study onset Show forest plot | 24 | Mean Difference (IV, Random, 95% CI) | Subtotals only | |
| 2.1 Studies that included independent walkers | 10 | 317 | Mean Difference (IV, Random, 95% CI) | ‐0.02 [‐0.10, 0.06] |
| 2.2 Studies that included dependent and independent walkers | 5 | 146 | Mean Difference (IV, Random, 95% CI) | 0.03 [‐0.05, 0.11] |
| 2.3 Studies that included dependent walkers | 9 | 522 | Mean Difference (IV, Random, 95% CI) | 0.10 [0.03, 0.17] |
| Outcome or subgroup title | No. of studies | No. of participants | Statistical method | Effect size |
| 1 Different devices for regaining walking ability Show forest plot | 32 | Odds Ratio (M‐H, Random, 95% CI) | Subtotals only | |
| 1.1 All studies using end‐effector devices | 11 | 598 | Odds Ratio (M‐H, Random, 95% CI) | 1.90 [0.99, 3.63] |
| 1.2 All studies using exoskeleton devices | 16 | 585 | Odds Ratio (M‐H, Random, 95% CI) | 2.05 [1.21, 3.50] |
| 1.3 All studies using mobile devices | 3 | 106 | Odds Ratio (M‐H, Random, 95% CI) | 0.0 [0.0, 0.0] |
| 1.4 All studies using ankle devices | 2 | 63 | Odds Ratio (M‐H, Random, 95% CI) | 0.0 [0.0, 0.0] |
| 2 Different devices for regaining walking speed Show forest plot | 24 | Mean Difference (IV, Random, 95% CI) | Subtotals only | |
| 2.1 All studies using end‐effector devices | 9 | 519 | Mean Difference (IV, Random, 95% CI) | 0.11 [0.04, 0.18] |
| 2.2 All studies using exoskeleton devices | 12 | 360 | Mean Difference (IV, Random, 95% CI) | ‐0.02 [‐0.08, 0.04] |
| 2.3 All studies using mobile devices | 3 | 106 | Mean Difference (IV, Random, 95% CI) | 0.02 [‐0.11, 0.15] |
| 2.4 All studies using ankle devices | 1 | 39 | Mean Difference (IV, Random, 95% CI) | 0.04 [0.01, 0.07] |
| 3 Different devices for regaining walking capacity Show forest plot | 12 | 594 | Mean Difference (IV, Random, 95% CI) | 5.84 [‐16.73, 28.40] |
| 3.1 All studies using end‐effector devices | 4 | 328 | Mean Difference (IV, Random, 95% CI) | 27.50 [3.64, 51.36] |
| 3.2 All studies using exoskeleton devices | 5 | 186 | Mean Difference (IV, Random, 95% CI) | ‐15.64 [‐46.34, 15.05] |
| 3.3 All studies using mobile devices | 2 | 56 | Mean Difference (IV, Random, 95% CI) | 20.06 [‐39.52, 79.63] |
| 3.4 All studies using ankle devices | 1 | 24 | Mean Difference (IV, Random, 95% CI) | 8.0 [‐83.03, 99.03] |