Antibióticos para recién nacidos con líquido amniótico teñido de meconio
Referencias
Referencias de los estudios incluidos en esta revisión
Referencias de los estudios excluidos de esta revisión
Referencias adicionales
Characteristics of studies
Characteristics of included studies [ordered by study ID]
Ir a:
| Methods | Randomised controlled trial 1. Masking of randomisation: yes 2. Masking of intervention: yes 3. Completeness of follow‐up: yes 4. Masking of outcome assessment: partial | |
| Participants | Location: India Inclusion criteria: diagnosis of MAS, must meet all 5 criteria: (1) delivery through MSAF; (2) retrieval of meconium from below the larynx on endotracheal tube suction; (3) development of respiratory distress within 4 hours of birth and persisting beyond 24 hours; (4) chest radiograph showing features of infiltration with or without hyperinflation and/or atelectasis; and (5) absence of any other explanation for respiratory distress Antibiotics group (N = 72) Male = 39/72 Median (IQR) BW (grams) = 2450 (2190‐2900) Median (IQR) GA (weeks) = 39.0 (37.0‐42.0) Control group (N = 74) Male = 39/74 Median (IQR) BW (grams) = 2450 (2170‐2700) Median (IQR) GA (weeks) = 39.0 (37.0‐41.52) Exclusion criteria: (1) sepsis; any maternal or fetal risk factor for sepsis (e.g. intrapartum fever > 37.5°C, chorioamnionitis and prolonged rupture of membrane, < 35 weeks' gestation, low birth weight ‐ < 2000 g); development of clinical signs of sepsis after birth (e.g. poor feeding, lethargy, temperature instability, sclerema, delayed capillary filling time (> 3 seconds) with a positive blood culture and/or any 2 laboratory criteria suggestive of sepsis (i.e. total leucocyte count < 5000/109 cells/L or > 30,000/109 cells/L; band/segmented neutrophils ratio above 0.2; raised micro‐ESR > 5 mm in 1st hour on 1st day of life or > 15 mm at any time; and raised C‐reactive protein (> 1000 pg/L)); (2) settling of respiratory distress within 24 hours of birth; and (3) presence of any congenital malformation | |
| Interventions | Antibiotics: 100 mg/kg/d ampicillin divided into 2 doses and 15 mg/kg/d amikacin divided into 2 doses for 7 days Control: No antibiotics | |
| Outcomes | Primary outcome: Sepsis; clinical signs suggestive of sepsis along with a positive blood culture or any 2 laboratory criteria suggestive of sepsis Secondary outcomes: Duration of respiratory distress Duration of oxygen requirement Duration of hospital stay Requirement of IV fluids Commencement and achievement of full feeds Clearing of chest radiograph | |
| Notes | No clinical trials registration number or funding source reported | |
| Risk of bias | ||
| Bias | Authors' judgement | Support for judgement |
| Random sequence generation (selection bias) | Low risk | Computer‐generated randomisation sequence |
| Allocation concealment (selection bias) | Low risk | Allocation concealed |
| Blinding of participants and personnel (performance bias) | Low risk | Parents/attendants, radiologists, and statisticians were blinded |
| Blinding of outcome assessment (detection bias) | Low risk | Radiologists were blinded. Clinicians could not be blinded, as 1 group received no treatment |
| Incomplete outcome data (attrition bias) | Low risk | All participants accounted for and the number of participants lost to follow‐up was similar in both groups (N = 4 in the antibiotics group; N = 5 in the control group). Two participants died ‐ 1 in each group ‐ and were removed from analysis following randomisation |
| Selective reporting (reporting bias) | Unclear risk | No access to protocol |
| Other bias | Low risk | |
| Methods | Open‐label randomised controlled trial 1. Masking of randomisation: yes 2. Masking of intervention: yes 3. Completeness of follow‐up: yes 4. Masking of outcome assessment: yes | |
| Participants | Location: India Inclusion criteria: all full‐term infants born as singleton cephalic presentation through MSAF Antibiotics group (N = 121) Male = 81/121 Mean (SD) BW (grams) = 2784.35 (447.19) Median (IQR) GA (weeks) = 39 (38‐40) Control group (N = 129) Male = 74/129 Mean (SD) BW = 2640.90 (427.5) Median (IQR) GA = 39 (38‐40) Exclusion criteria: major congenital malformation or refusal of consent by parents | |
| Interventions | Antibiotics: Prophylactic IV antibiotics, piperacillin‐tazobactam 100 mg/kd/d, and amikacin 15 mg/kg/d for 3 days Control: No antibiotics | |
| Outcomes | Primary outcome: Incidence of sepsis Secondary outcomes: Incidence of MAS Severity of MAS MAS complications HIE Duration of stay in hospital Mortality | |
| Notes | Registered with clinical trial registry (NCT01290003). This research received no specific grant from any funding agency in public, commercial, or not‐for‐profit sectors | |
| Risk of bias | ||
| Bias | Authors' judgement | Support for judgement |
| Random sequence generation (selection bias) | Low risk | Block‐randomised, computer‐generated |
| Allocation concealment (selection bias) | Low risk | Allocation concealed |
| Blinding of participants and personnel (performance bias) | Low risk | Treating clinician and nursery personnel were described as blinded; on‐duty physician completed randomisation assignment |
| Blinding of outcome assessment (detection bias) | Unclear risk | Treating clinician and nursery personnel were described as blinded. Unclear how treating clinician could be blinded, as control group received no intervention |
| Incomplete outcome data (attrition bias) | Low risk | All participants accounted for in analysis |
| Selective reporting (reporting bias) | Low risk | Reported outcomes match those prospectively registered with clinicaltrials.gov |
| Other bias | Low risk | |
| Methods | Randomised controlled trial 1. Masking of randomisation: unclear 2. Masking of intervention: unclear 3. Completeness of follow‐up: no 4. Masking of outcome assessment: unclear | |
| Participants | Location: Taiwan Inclusion criteria: MAS; diagnosed by presence of meconium below the vocal cord, accompanied by respiratory distress with tachypnoea, retraction, or cyanosis of the babies and an abnormal chest X‐ray (atelectasis, linear or patchy infiltration) Antibiotics group (N =132) Male = 72/132 Mean (SD) BW (grams) = 3280 (395) Mean (SD) GA (weeks) = 37.3 (3.9) Control group (N = 127) Male = 69/127 Mean (SD) BW (grams) = 3450 (320) Mean (SD) GA (weeks) = 38.5 (3.3) Exclusion criteria: congential malformation, obvious congential infection (signs or symptoms of TORCHS), cyanotic congenital heart disease, maternal fever, amnionitis, foetal tachycardia, prolonged rupture of membrane > 24 hours, respiratory failure requiring ventilation | |
| Interventions | Antibiotics: 100 mg/kg/d ampicillin and 5.0 mg/kg/d gentamicin for 3 days Control: No antibiotics | |
| Outcomes | Blood cultures for infection Mortality Tachypnoea Duration of oxygen therapy Duration of CPAP Incidence of nasal CPAP Incidence of pulmonary air leaks | |
| Notes | No clinical trial registration number or funding source reported. Corresponding study author contacted for comment but could not be reached | |
| Risk of bias | ||
| Bias | Authors' judgement | Support for judgement |
| Random sequence generation (selection bias) | Unclear risk | No data provided |
| Allocation concealment (selection bias) | Unclear risk | No data provided |
| Blinding of participants and personnel (performance bias) | Unclear risk | No data provided |
| Blinding of outcome assessment (detection bias) | Unclear risk | No data provided |
| Incomplete outcome data (attrition bias) | High risk | N = 158 (antibiotics), N = 148 (control) recruited, but only 132/158 and 127/148 followed until 2 months of age. Significant post‐randomisation exclusions |
| Selective reporting (reporting bias) | Unclear risk | No data provided on which outcomes were predesignated as primary or secondary. No access to protocol |
| Methods | Randomised controlled trial 1. Masking of randomisation: unclear 2. Masking of intervention: unclear 3. Completeness of follow‐up: yes 4. Masking of outcome assessment: no | |
| Participants | Location: India Inclusion criteria: MAS diagnosis if (1) born with meconium‐stained liquor, (2) born with respiratory distress lasting beyond 4 hours of age, and (3) documented presence of meconium in trachea at the time of tracheal suction or suggestive radiographic findings Antibiotics group (N = 20) Male = 12/20 Mean (SD) BW (grams) = 2650 (640) Mean (SD) GA (weeks) = 39.0 (1.95) Control group (N = 20) Male = 11/20 Mean (SD) BW (grams) = 3060 (600) Mean (SD) GA (weeks) = 38.8 (1.71) Exclusion criteria: maternal fever within 2 weeks before delivery, rupture of membranes of over 12 hours' duration, positive sepsis screen at time of enrolment | |
| Interventions | Antibiotics: IV gentamicin 6 mg/kg/d q 8 hours for 7 days Control: No antibiotics | |
| Outcomes | Duration of respiratory distress RDS score at 24 hours RDS score at 48 hours Incidence of mechanical ventilation Incidence of secondary infection Incidence of pulmonary air leaks Mortality | |
| Notes | Unclear which outcome was designated as primary. No sample size calculation or trial registration number or funding support reported. Corresponding study author contacted for comment but could not be reached | |
| Risk of bias | ||
| Bias | Authors' judgement | Support for judgement |
| Random sequence generation (selection bias) | Unclear risk | No data provided |
| Allocation concealment (selection bias) | Unclear risk | No data provided |
| Blinding of participants and personnel (performance bias) | High risk | Nursery staff was not blinded |
| Blinding of outcome assessment (detection bias) | Unclear risk | No data provided |
| Incomplete outcome data (attrition bias) | Low risk | Outcome data were reported for all 42 randomised neonates |
| Selective reporting (reporting bias) | Unclear risk | No data provided on which outcomes were predesignated as primary or secondary |
| Other bias | Unclear risk | No data provided |
BW: birth weight
CPAP: continuous positive airway pressure
ESR: erythrocyte sedimentation rate
GA: gestational age
HIE: hypoxic‐ischaemic encephalopathy
IQR: interquartile ratio
MAS: meconium aspiration syndrome
MSAF: meconium‐stained amniotic fluid
RDS: respiratory distress syndrome
SD: standard deviation
TORCHS: acronym for a group of in utero infections that may induce major foetal malformations
Characteristics of excluded studies [ordered by study ID]
Ir a:
| Study | Reason for exclusion |
| Antibiotics not administered to neonates | |
| Article not available in English | |
| Antibiotics not administered to neonates | |
| Not a randomised controlled trial | |
| Review; not a randomised controlled trial | |
| Review; not a randomised controlled trial | |
| Not a randomised controlled trial |
Data and analyses
| Outcome or subgroup title | No. of studies | No. of participants | Statistical method | Effect size |
| 1 Incidence of confirmed sepsis in first 28 days Show forest plot | 3 | 445 | Risk Difference (M‐H, Fixed, 95% CI) | 0.00 [‐0.02, 0.03] |
| Analysis 1.1  Comparison 1 Antibiotics versus control (no antibiotics) in symptomatic neonates, Outcome 1 Incidence of confirmed sepsis in first 28 days. | ||||
| 2 Mortality (before discharge) Show forest plot | 3 | 445 | Risk Difference (M‐H, Fixed, 95% CI) | 0.00 [‐0.01, 0.02] |
| Analysis 1.2  Comparison 1 Antibiotics versus control (no antibiotics) in symptomatic neonates, Outcome 2 Mortality (before discharge). | ||||
| 3 Duration of oxygen therapy, days Show forest plot | 2 | 405 | Mean Difference (IV, Fixed, 95% CI) | ‐0.85 [‐1.19, ‐0.52] |
| Analysis 1.3  Comparison 1 Antibiotics versus control (no antibiotics) in symptomatic neonates, Outcome 3 Duration of oxygen therapy, days. | ||||
| 4 Duration of hospital stay, days Show forest plot | 1 | 146 | Mean Difference (IV, Fixed, 95% CI) | 0.16 [‐1.15, 1.47] |
| Analysis 1.4 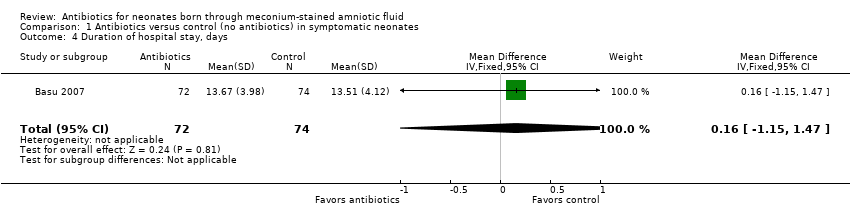 Comparison 1 Antibiotics versus control (no antibiotics) in symptomatic neonates, Outcome 4 Duration of hospital stay, days. | ||||
| 5 Incidence of pulmonary air leak syndrome Show forest plot | 3 | 445 | Risk Ratio (M‐H, Fixed, 95% CI) | 1.50 [0.62, 3.67] |
| Analysis 1.5 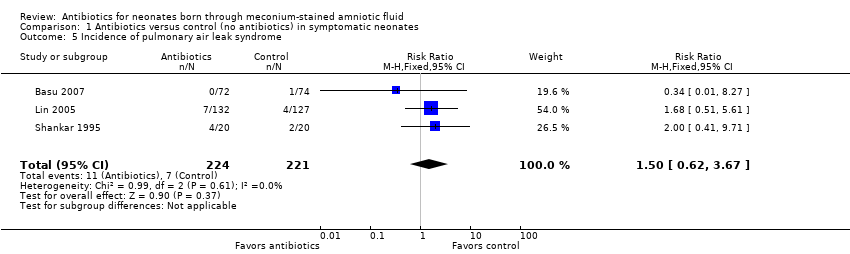 Comparison 1 Antibiotics versus control (no antibiotics) in symptomatic neonates, Outcome 5 Incidence of pulmonary air leak syndrome. | ||||
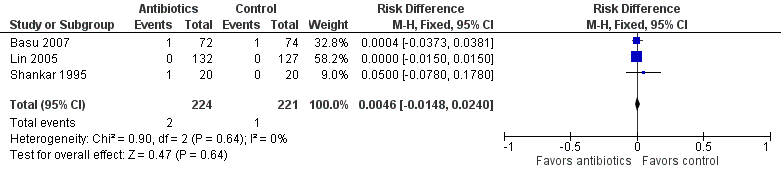
| 6 Incidence of mechanical ventilation Show forest plot | 3 | 445 | Risk Ratio (M‐H, Fixed, 95% CI) | 1.18 [0.52, 2.67] |
| Analysis 1.6  Comparison 1 Antibiotics versus control (no antibiotics) in symptomatic neonates, Outcome 6 Incidence of mechanical ventilation. | ||||
| 7 Time to clear chest radiograph, days Show forest plot | 1 | 146 | Mean Difference (IV, Fixed, 95% CI) | ‐1.31 [‐3.04, 0.42] |
| Analysis 1.7  Comparison 1 Antibiotics versus control (no antibiotics) in symptomatic neonates, Outcome 7 Time to clear chest radiograph, days. | ||||
| 8 Incidence of respiratory failure Show forest plot | 2 | 405 | Risk Difference (M‐H, Fixed, 95% CI) | 0.01 [‐0.03, 0.05] |
| Analysis 1.8 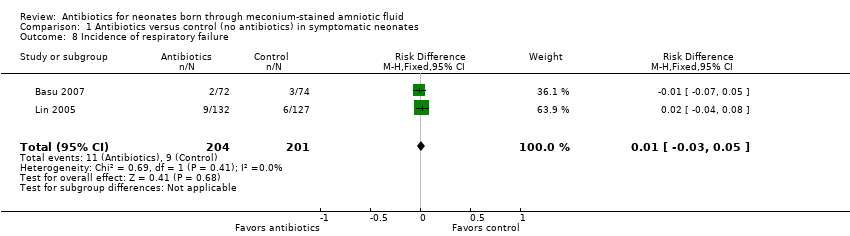 Comparison 1 Antibiotics versus control (no antibiotics) in symptomatic neonates, Outcome 8 Incidence of respiratory failure. | ||||
| 9 Duration of respiratory distress, hours Show forest plot | 1 | 40 | Mean Difference (IV, Random, 95% CI) | ‐1.20 [‐25.59, 23.19] |
| Analysis 1.9 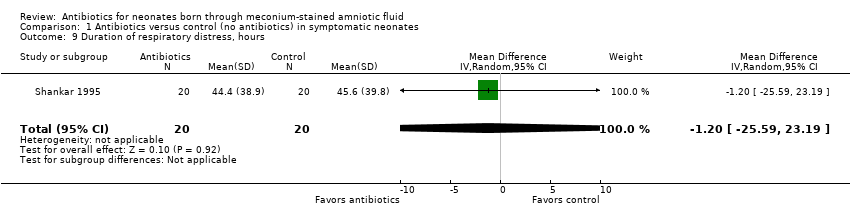 Comparison 1 Antibiotics versus control (no antibiotics) in symptomatic neonates, Outcome 9 Duration of respiratory distress, hours. | ||||
| Outcome or subgroup title | No. of studies | No. of participants | Statistical method | Effect size |
| 1 Incidence of confirmed sepsis in first 28 days Show forest plot | 1 | 250 | Risk Difference (M‐H, Fixed, 95% CI) | ‐0.01 [‐0.07, 0.04] |
| Analysis 2.1 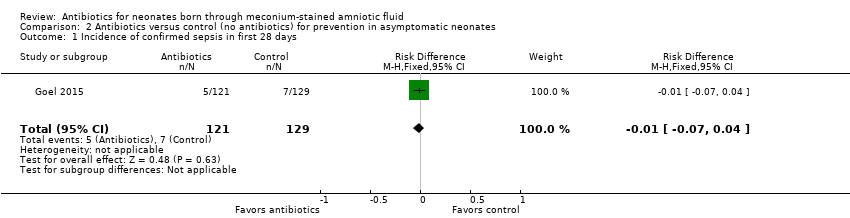 Comparison 2 Antibiotics versus control (no antibiotics) for prevention in asymptomatic neonates, Outcome 1 Incidence of confirmed sepsis in first 28 days. | ||||
| 2 Mortality (before discharge) Show forest plot | 1 | 250 | Risk Ratio (M‐H, Fixed, 95% CI) | 1.07 [0.22, 5.18] |
| Analysis 2.2  Comparison 2 Antibiotics versus control (no antibiotics) for prevention in asymptomatic neonates, Outcome 2 Mortality (before discharge). | ||||
| 3 Duration of mechanical ventilation, days Show forest plot | 1 | 250 | Mean Difference (IV, Fixed, 95% CI) | 0.26 [0.15, 0.37] |
| Analysis 2.3 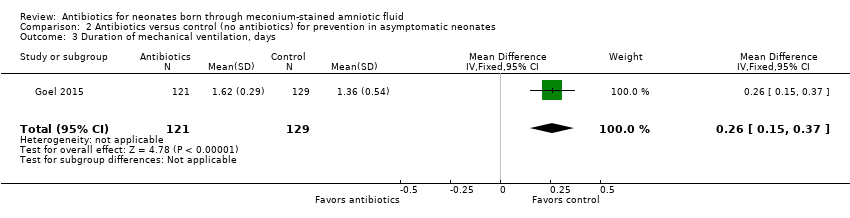 Comparison 2 Antibiotics versus control (no antibiotics) for prevention in asymptomatic neonates, Outcome 3 Duration of mechanical ventilation, days. | ||||
| 4 Duration of oxygen therapy, days Show forest plot | 1 | 250 | Mean Difference (IV, Fixed, 95% CI) | 0.43 [0.13, 0.73] |
| Analysis 2.4 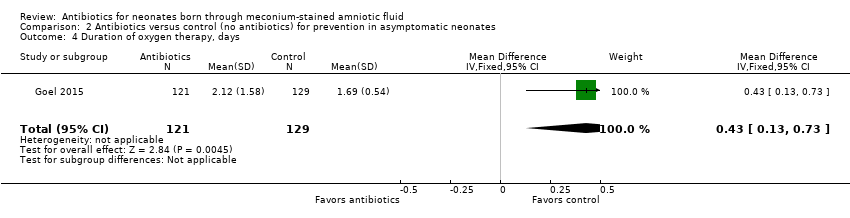 Comparison 2 Antibiotics versus control (no antibiotics) for prevention in asymptomatic neonates, Outcome 4 Duration of oxygen therapy, days. | ||||
| 5 Incidence of suspected sepsis Show forest plot | 1 | 250 | Risk Difference (M‐H, Fixed, 95% CI) | ‐0.03 [‐0.10, 0.05] |
| Analysis 2.5  Comparison 2 Antibiotics versus control (no antibiotics) for prevention in asymptomatic neonates, Outcome 5 Incidence of suspected sepsis. | ||||
| 6 Incidence of intracranial haemorrhage Show forest plot | 1 | 250 | Risk Ratio (M‐H, Fixed, 95% CI) | 0.36 [0.01, 8.64] |
| Analysis 2.6  Comparison 2 Antibiotics versus control (no antibiotics) for prevention in asymptomatic neonates, Outcome 6 Incidence of intracranial haemorrhage. | ||||
| 7 Incidence of azotaemia Show forest plot | 1 | 250 | Risk Ratio (M‐H, Fixed, 95% CI) | 3.20 [0.13, 77.73] |
| Analysis 2.7 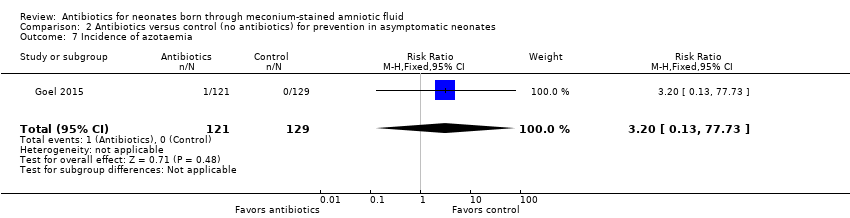 Comparison 2 Antibiotics versus control (no antibiotics) for prevention in asymptomatic neonates, Outcome 7 Incidence of azotaemia. | ||||
| 8 Incidence of oliguria Show forest plot | 1 | 250 | Risk Ratio (M‐H, Fixed, 95% CI) | 3.20 [0.13, 77.73] |
| Analysis 2.8  Comparison 2 Antibiotics versus control (no antibiotics) for prevention in asymptomatic neonates, Outcome 8 Incidence of oliguria. | ||||
| 9 Incidence of diarrhoea Show forest plot | 1 | 250 | Risk Ratio (M‐H, Fixed, 95% CI) | 0.12 [0.01, 2.18] |
| Analysis 2.9  Comparison 2 Antibiotics versus control (no antibiotics) for prevention in asymptomatic neonates, Outcome 9 Incidence of diarrhoea. | ||||
| 10 Incidence of mechanical ventilation Show forest plot | 1 | 250 | Risk Ratio (M‐H, Fixed, 95% CI) | 2.13 [0.55, 8.34] |
| Analysis 2.10 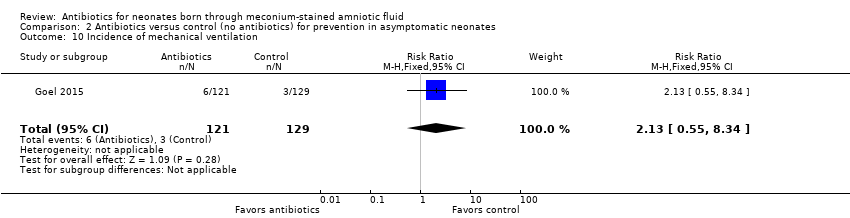 Comparison 2 Antibiotics versus control (no antibiotics) for prevention in asymptomatic neonates, Outcome 10 Incidence of mechanical ventilation. | ||||
| 11 Incidence of respiratory distress (Downe's score) Show forest plot | 1 | 250 | Risk Ratio (M‐H, Fixed, 95% CI) | 1.18 [0.81, 1.72] |
| Analysis 2.11  Comparison 2 Antibiotics versus control (no antibiotics) for prevention in asymptomatic neonates, Outcome 11 Incidence of respiratory distress (Downe's score). | ||||
| 12 Duration of respiratory distress, hours Show forest plot | 1 | 250 | Mean Difference (IV, Fixed, 95% CI) | 6.87 [4.22, 9.52] |
| Analysis 2.12 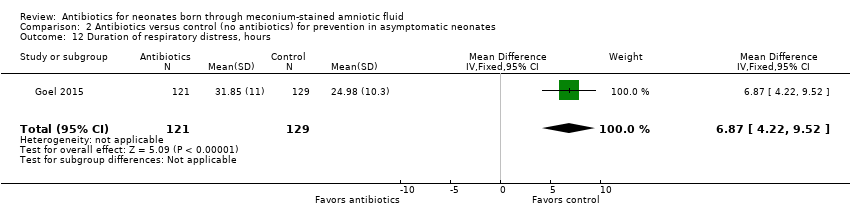 Comparison 2 Antibiotics versus control (no antibiotics) for prevention in asymptomatic neonates, Outcome 12 Duration of respiratory distress, hours. | ||||
| 13 Incidence of MAS Show forest plot | 1 | 250 | Risk Ratio (M‐H, Fixed, 95% CI) | 1.17 [0.67, 2.04] |
| Analysis 2.13 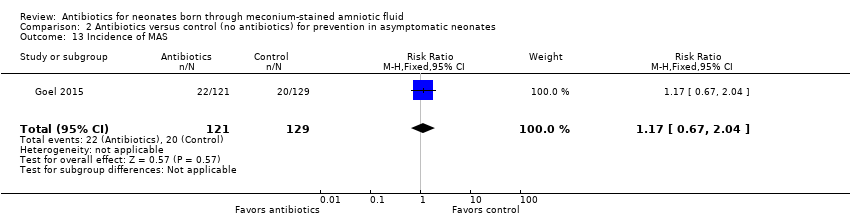 Comparison 2 Antibiotics versus control (no antibiotics) for prevention in asymptomatic neonates, Outcome 13 Incidence of MAS. | ||||
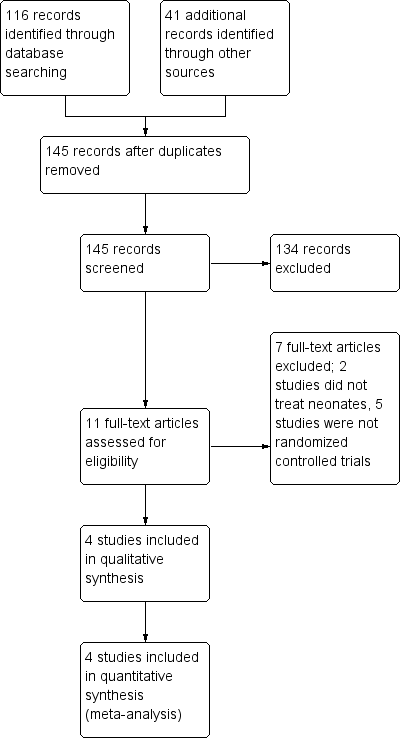
Figure 1. Study flow diagram.

Figure 2. Risk of bias summary: review authors' judgements about each risk of bias item for each included study.

Forest plot of comparison: Incidence of confirmed sepsis in symptomatic neonates within the first 28 days.
Forest plot of comparison: Mortality in symptomatic neonates (before discharge).

Comparison 1 Antibiotics versus control (no antibiotics) in symptomatic neonates, Outcome 1 Incidence of confirmed sepsis in first 28 days.

Comparison 1 Antibiotics versus control (no antibiotics) in symptomatic neonates, Outcome 2 Mortality (before discharge).
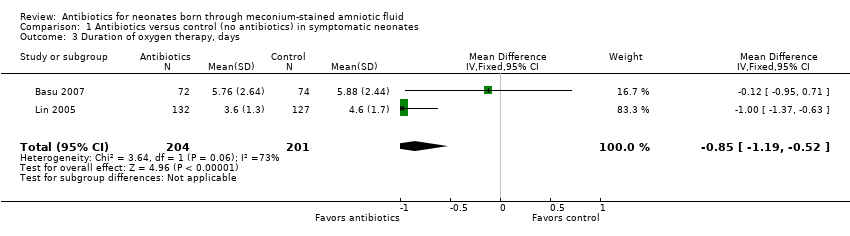
Comparison 1 Antibiotics versus control (no antibiotics) in symptomatic neonates, Outcome 3 Duration of oxygen therapy, days.

Comparison 1 Antibiotics versus control (no antibiotics) in symptomatic neonates, Outcome 4 Duration of hospital stay, days.

Comparison 1 Antibiotics versus control (no antibiotics) in symptomatic neonates, Outcome 5 Incidence of pulmonary air leak syndrome.
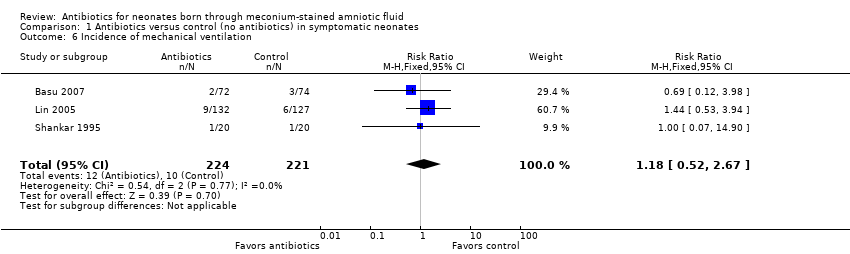
Comparison 1 Antibiotics versus control (no antibiotics) in symptomatic neonates, Outcome 6 Incidence of mechanical ventilation.
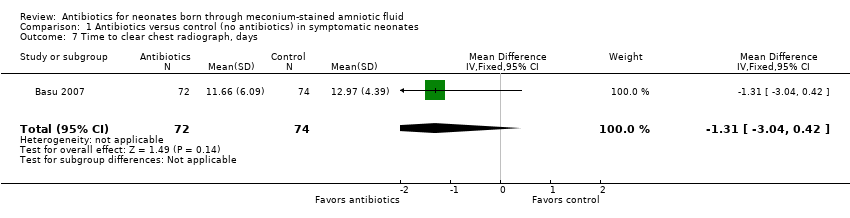
Comparison 1 Antibiotics versus control (no antibiotics) in symptomatic neonates, Outcome 7 Time to clear chest radiograph, days.

Comparison 1 Antibiotics versus control (no antibiotics) in symptomatic neonates, Outcome 8 Incidence of respiratory failure.

Comparison 1 Antibiotics versus control (no antibiotics) in symptomatic neonates, Outcome 9 Duration of respiratory distress, hours.

Comparison 2 Antibiotics versus control (no antibiotics) for prevention in asymptomatic neonates, Outcome 1 Incidence of confirmed sepsis in first 28 days.
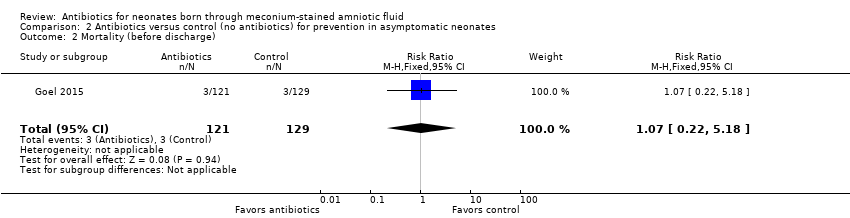
Comparison 2 Antibiotics versus control (no antibiotics) for prevention in asymptomatic neonates, Outcome 2 Mortality (before discharge).

Comparison 2 Antibiotics versus control (no antibiotics) for prevention in asymptomatic neonates, Outcome 3 Duration of mechanical ventilation, days.

Comparison 2 Antibiotics versus control (no antibiotics) for prevention in asymptomatic neonates, Outcome 4 Duration of oxygen therapy, days.
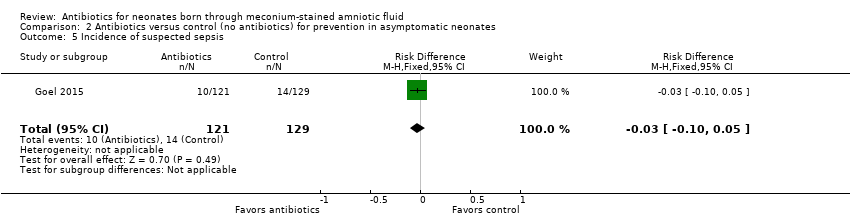
Comparison 2 Antibiotics versus control (no antibiotics) for prevention in asymptomatic neonates, Outcome 5 Incidence of suspected sepsis.

Comparison 2 Antibiotics versus control (no antibiotics) for prevention in asymptomatic neonates, Outcome 6 Incidence of intracranial haemorrhage.

Comparison 2 Antibiotics versus control (no antibiotics) for prevention in asymptomatic neonates, Outcome 7 Incidence of azotaemia.

Comparison 2 Antibiotics versus control (no antibiotics) for prevention in asymptomatic neonates, Outcome 8 Incidence of oliguria.

Comparison 2 Antibiotics versus control (no antibiotics) for prevention in asymptomatic neonates, Outcome 9 Incidence of diarrhoea.

Comparison 2 Antibiotics versus control (no antibiotics) for prevention in asymptomatic neonates, Outcome 10 Incidence of mechanical ventilation.

Comparison 2 Antibiotics versus control (no antibiotics) for prevention in asymptomatic neonates, Outcome 11 Incidence of respiratory distress (Downe's score).

Comparison 2 Antibiotics versus control (no antibiotics) for prevention in asymptomatic neonates, Outcome 12 Duration of respiratory distress, hours.

Comparison 2 Antibiotics versus control (no antibiotics) for prevention in asymptomatic neonates, Outcome 13 Incidence of MAS.
| Antibiotics compared with control (no antibiotics) in symptomatic neonates born through meconium‐stained amniotic fluid | ||||||
| Patient or population: symptomatic neonates born through meconium‐stained amniotic fluid | ||||||
| Outcomes | Anticipated absolute effects* (95% CI) | Relative effect | Number of participants | Quality of the evidence | Comments | |
| Risk with control (no antibiotics) | Risk with antibiotics | |||||
| Incidence of confirmed sepsis in first 28 days | Study population | Not estimable | 445 | ⊕⊕⊝⊝ | Evidence was downgraded owing to unclear risk of bias due to methodological limitations, including a large number of dropouts; and imprecision resulting from a small sample size | |
| 9 per 1000 | 0 per 1000 | |||||
| Mortality (before discharge) | Study population | RR 1.69 | 445 | ⊕⊕⊝⊝ | Evidence was downgraded owing to unclear risk of bias due to methodological limitations, including a large number of dropouts; and imprecision resulting from a small sample size | |
| 5 per 1000 | 8 per 1000 | |||||
| Duration of oxygen therapy, days | Mean duration of oxygen therapy (days) was 0 | MD 0.85 days lower | ‐ | 405 | ⊕⊕⊝⊝ | Evidence was downgraded owing to unclear risk of bias due to methodological limitations, including a large number of dropouts; and imprecision resulting from a small sample size |
| Duration of hospital stay, days | Mean duration of hospital stay (days) was 0 | MD 0.16 days higher | ‐ | 146 | ⊕⊕⊕⊝ | Evidence was downgraded owing to imprecision resulting from a small sample size |
| Incidence of mechanical ventilation | Study population | RR 1.18 | 445 | ⊕⊕⊝⊝ | Evidence was downgraded owing to unclear risk of bias due to methodological limitations, including a large number of dropouts; and imprecision resulting from a small sample size | |
| 45 per 1000 | 53 per 1000 | |||||
| Incidence of respiratory failure | Study population | RR 1.20 | 405 | ⊕⊕⊝⊝ | Evidence was downgraded owing to unclear risk of bias due to methodological limitations, including a large number of dropouts; and imprecision resulting from a small sample size | |
| 41 per 1000 | 47 per 1000 | |||||
| *The risk in the intervention group (and its 95% confidence interval) is based on assumed risk in the comparison group and relative effect of the intervention (and its 95% CI) | ||||||
| GRADE Working Group grades of evidence | ||||||
| Antibiotics compared with control (no antibiotics) in asymptomatic neonates born through meconium‐stained amniotic fluid | ||||||
| Patient or population: asymptomatic neonates born through meconium‐stained amniotic fluid | ||||||
| Outcomes | Anticipated absolute effects* (95% CI) | Relative effect | Number of participants | Quality of the evidence | Comments | |
| Risk with control (no antibiotics) | Risk with antibiotics | |||||
| Incidence of confirmed sepsis in first 28 days | Study population | Not estimable | 250 | ⊕⊕⊝⊝ | Evidence was downgraded owing to very serious imprecision, as the results from this study have not been replicated | |
| 54 per 1000 | 0 per 1000 | |||||
| Mortality (before discharge) | Study population | RR 1.07 | 250 | ⊕⊕⊝⊝ | Evidence was downgraded owing to very serious imprecision, as the results from this study have not been replicated | |
| 23 per 1000 | 25 per 1000 | |||||
| Duration of oxygen therapy, days | Mean duration of oxygen therapy (days) was 0 | MD 0.43 days higher | ‐ | 250 | ⊕⊕⊝⊝ | Evidence was downgraded owing to very serious imprecision, as the results from this study have not been replicated |
| Incidence of suspected sepsis | Study population | Not estimable | 250 | ⊕⊕⊝⊝ | Evidence was downgraded owing to very serious imprecision, as the results from this study have not been replicated | |
| 109 per 1000 | 0 per 1000 | |||||
| Incidence of mechanical ventilation | Study population | RR 2.13 | 250 | ⊕⊕⊝⊝ | Evidence was downgraded owing to very serious imprecision, as the results from this study have not been replicated | |
| 23 per 1000 | 50 per 1000 | |||||
| Duration of respiratory distress, hours | Mean duration of respiratory distress (hours) was 0 | MD 6.87 higher | ‐ | 250 | ⊕⊕⊝⊝ | Evidence was downgraded owing to very serious imprecision, as the results from this study have not been replicated |
| Incidence of MAS | Study population | RR 1.17 | 250 | ⊕⊕⊝⊝ | Evidence was downgraded owing to very serious imprecision, as the results from this study have not been replicated | |
| 155 per 1000 | 181 per 1000 | |||||
| *The risk in the intervention group (and its 95% confidence interval) is based on assumed risk in the comparison group and relative effect of the intervention (and its 95% CI) | ||||||
| GRADE Working Group grades of evidence | ||||||
| Outcome or subgroup title | No. of studies | No. of participants | Statistical method | Effect size |
| 1 Incidence of confirmed sepsis in first 28 days Show forest plot | 3 | 445 | Risk Difference (M‐H, Fixed, 95% CI) | 0.00 [‐0.02, 0.03] |
| 2 Mortality (before discharge) Show forest plot | 3 | 445 | Risk Difference (M‐H, Fixed, 95% CI) | 0.00 [‐0.01, 0.02] |
| 3 Duration of oxygen therapy, days Show forest plot | 2 | 405 | Mean Difference (IV, Fixed, 95% CI) | ‐0.85 [‐1.19, ‐0.52] |
| 4 Duration of hospital stay, days Show forest plot | 1 | 146 | Mean Difference (IV, Fixed, 95% CI) | 0.16 [‐1.15, 1.47] |
| 5 Incidence of pulmonary air leak syndrome Show forest plot | 3 | 445 | Risk Ratio (M‐H, Fixed, 95% CI) | 1.50 [0.62, 3.67] |
| 6 Incidence of mechanical ventilation Show forest plot | 3 | 445 | Risk Ratio (M‐H, Fixed, 95% CI) | 1.18 [0.52, 2.67] |
| 7 Time to clear chest radiograph, days Show forest plot | 1 | 146 | Mean Difference (IV, Fixed, 95% CI) | ‐1.31 [‐3.04, 0.42] |
| 8 Incidence of respiratory failure Show forest plot | 2 | 405 | Risk Difference (M‐H, Fixed, 95% CI) | 0.01 [‐0.03, 0.05] |
| 9 Duration of respiratory distress, hours Show forest plot | 1 | 40 | Mean Difference (IV, Random, 95% CI) | ‐1.20 [‐25.59, 23.19] |
| Outcome or subgroup title | No. of studies | No. of participants | Statistical method | Effect size |
| 1 Incidence of confirmed sepsis in first 28 days Show forest plot | 1 | 250 | Risk Difference (M‐H, Fixed, 95% CI) | ‐0.01 [‐0.07, 0.04] |
| 2 Mortality (before discharge) Show forest plot | 1 | 250 | Risk Ratio (M‐H, Fixed, 95% CI) | 1.07 [0.22, 5.18] |
| 3 Duration of mechanical ventilation, days Show forest plot | 1 | 250 | Mean Difference (IV, Fixed, 95% CI) | 0.26 [0.15, 0.37] |
| 4 Duration of oxygen therapy, days Show forest plot | 1 | 250 | Mean Difference (IV, Fixed, 95% CI) | 0.43 [0.13, 0.73] |
| 5 Incidence of suspected sepsis Show forest plot | 1 | 250 | Risk Difference (M‐H, Fixed, 95% CI) | ‐0.03 [‐0.10, 0.05] |
| 6 Incidence of intracranial haemorrhage Show forest plot | 1 | 250 | Risk Ratio (M‐H, Fixed, 95% CI) | 0.36 [0.01, 8.64] |
| 7 Incidence of azotaemia Show forest plot | 1 | 250 | Risk Ratio (M‐H, Fixed, 95% CI) | 3.20 [0.13, 77.73] |
| 8 Incidence of oliguria Show forest plot | 1 | 250 | Risk Ratio (M‐H, Fixed, 95% CI) | 3.20 [0.13, 77.73] |
| 9 Incidence of diarrhoea Show forest plot | 1 | 250 | Risk Ratio (M‐H, Fixed, 95% CI) | 0.12 [0.01, 2.18] |
| 10 Incidence of mechanical ventilation Show forest plot | 1 | 250 | Risk Ratio (M‐H, Fixed, 95% CI) | 2.13 [0.55, 8.34] |
| 11 Incidence of respiratory distress (Downe's score) Show forest plot | 1 | 250 | Risk Ratio (M‐H, Fixed, 95% CI) | 1.18 [0.81, 1.72] |
| 12 Duration of respiratory distress, hours Show forest plot | 1 | 250 | Mean Difference (IV, Fixed, 95% CI) | 6.87 [4.22, 9.52] |
| 13 Incidence of MAS Show forest plot | 1 | 250 | Risk Ratio (M‐H, Fixed, 95% CI) | 1.17 [0.67, 2.04] |