Antibióticos para recién nacidos con líquido amniótico teñido de meconio
Información
- DOI:
- https://doi.org/10.1002/14651858.CD006183.pub2Copiar DOI

- Base de datos:
-
- Cochrane Database of Systematic Reviews
- Versión publicada:
-
- 28 junio 2017see what's new
- Tipo:
-
- Intervention
- Etapa:
-
- Review
- Grupo Editorial Cochrane:
-
Grupo Cochrane de Neonatología
- Copyright:
-
- Copyright © 2017 The Cochrane Collaboration. Published by John Wiley & Sons, Ltd.
Cifras del artículo
Altmetric:
Citado por:
Autores
Contributions of authors
LE Kelly searched the literature to identify trials, entered data in Revman, completed the analysis, drafted the first version of the manuscript, and reviewed the final version. S Shivananda and P Murthy wrote and revised the protocol and reviewed the final version. P Shah was involved in editing and revising the protocol, identifying trials, verifying data collection and analysis in Revman, and reviewing the final manuscript.
Sources of support
Internal sources
-
Shared Fellowship Program in Neonatal Perinatal Medicine, University of Toronto, Canada.
-
Mount Sinai Hospital, University of Toronto, Canada.
External sources
-
Eunice Kennedy Shriver National Institute of Child Health and Human Development, National Institutes of Health, Department of Health and Human Services, USA.
Editorial support of the Cochrane Neonatal Review Group has been funded by Federal funds from the Eunice Kennedy Shriver National Institute of Child Health and Human Development, National Institutes of Health, Department of Health and Human Services, USA, under Contract No. HHSN275201600005C
Declarations of interest
None.
Acknowledgements
The review authors would like to acknowledge Colleen Ovelman and Yolanda Brasseau of the Cochrane Neonatal Review Group for assistance in running the search and for providing editorial support.
Version history
| Published | Title | Stage | Authors | Version |
| 2017 Jun 28 | Antibiotics for neonates born through meconium‐stained amniotic fluid | Review | Lauren E Kelly, Sandesh Shivananda, Prashanth Murthy, Ravisha Srinivasjois, Prakeshkumar S Shah | |
| 2006 Oct 18 | Antibiotics for neonates born through meconium stained amniotic fluid | Protocol | Sandesh Shivananda, Prashanth Murthy, Prakeshkumar S Shah | |
Differences between protocol and review
Post hoc outcomes identified during evaluation of included studies were added at the review authors' discretion. One review author has been added to this review.
Keywords
MeSH
Medical Subject Headings (MeSH) Keywords
- *Amniotic Fluid;
- Amikacin [therapeutic use];
- Ampicillin [therapeutic use];
- Anti‐Bacterial Agents [*therapeutic use];
- Bacterial Infections [*drug therapy, mortality, prevention & control];
- Gentamicins [therapeutic use];
- Incidence;
- Length of Stay;
- Meconium [*microbiology];
- Meconium Aspiration Syndrome [*drug therapy, epidemiology];
- Neonatal Sepsis [*drug therapy, mortality, prevention & control];
- Randomized Controlled Trials as Topic;
- Respiration, Artificial [statistics & numerical data];
- Respiratory Insufficiency [epidemiology];
Medical Subject Headings Check Words
Humans; Infant, Newborn;
PICO
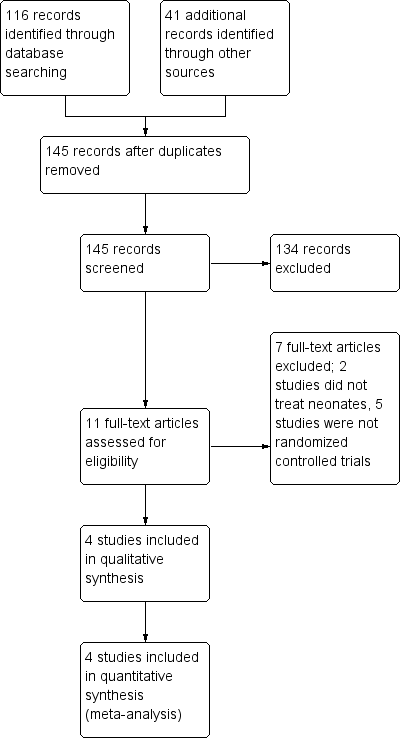
Figure 1. Study flow diagram.

Figure 2. Risk of bias summary: review authors' judgements about each risk of bias item for each included study.

Forest plot of comparison: Incidence of confirmed sepsis in symptomatic neonates within the first 28 days.
Forest plot of comparison: Mortality in symptomatic neonates (before discharge).

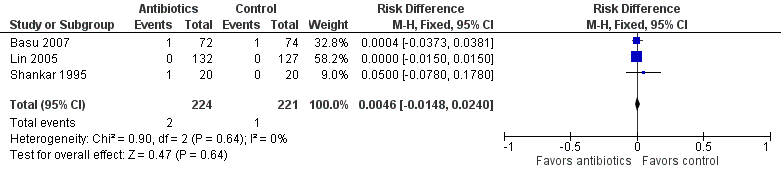
Comparison 1 Antibiotics versus control (no antibiotics) in symptomatic neonates, Outcome 1 Incidence of confirmed sepsis in first 28 days.

Comparison 1 Antibiotics versus control (no antibiotics) in symptomatic neonates, Outcome 2 Mortality (before discharge).
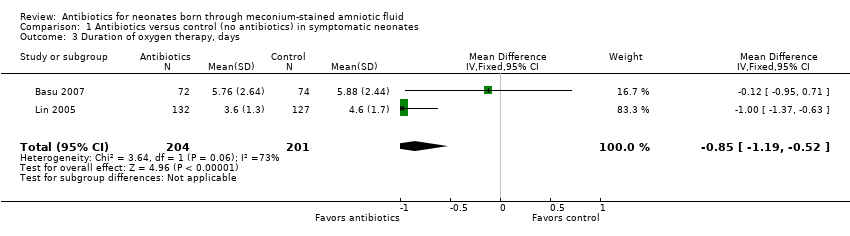
Comparison 1 Antibiotics versus control (no antibiotics) in symptomatic neonates, Outcome 3 Duration of oxygen therapy, days.

Comparison 1 Antibiotics versus control (no antibiotics) in symptomatic neonates, Outcome 4 Duration of hospital stay, days.

Comparison 1 Antibiotics versus control (no antibiotics) in symptomatic neonates, Outcome 5 Incidence of pulmonary air leak syndrome.
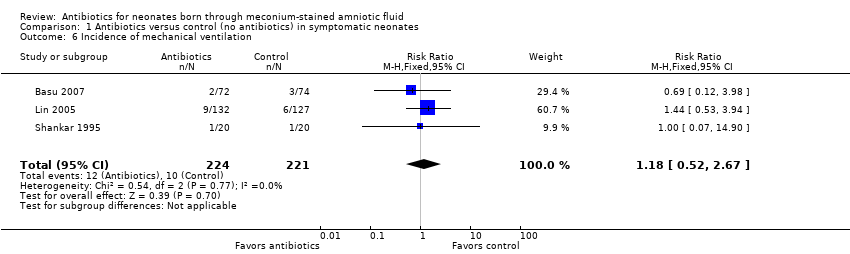
Comparison 1 Antibiotics versus control (no antibiotics) in symptomatic neonates, Outcome 6 Incidence of mechanical ventilation.
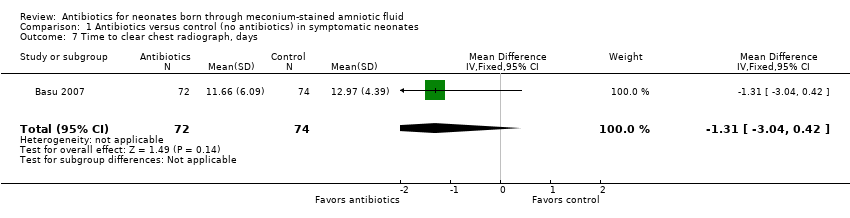
Comparison 1 Antibiotics versus control (no antibiotics) in symptomatic neonates, Outcome 7 Time to clear chest radiograph, days.

Comparison 1 Antibiotics versus control (no antibiotics) in symptomatic neonates, Outcome 8 Incidence of respiratory failure.

Comparison 1 Antibiotics versus control (no antibiotics) in symptomatic neonates, Outcome 9 Duration of respiratory distress, hours.

Comparison 2 Antibiotics versus control (no antibiotics) for prevention in asymptomatic neonates, Outcome 1 Incidence of confirmed sepsis in first 28 days.
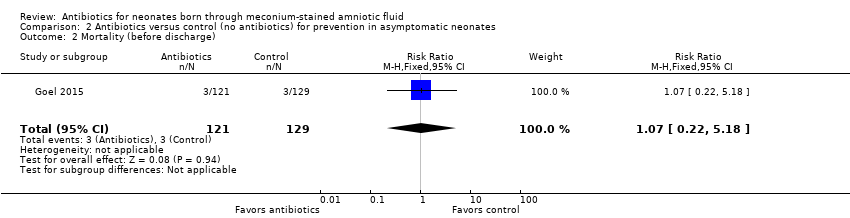
Comparison 2 Antibiotics versus control (no antibiotics) for prevention in asymptomatic neonates, Outcome 2 Mortality (before discharge).

Comparison 2 Antibiotics versus control (no antibiotics) for prevention in asymptomatic neonates, Outcome 3 Duration of mechanical ventilation, days.
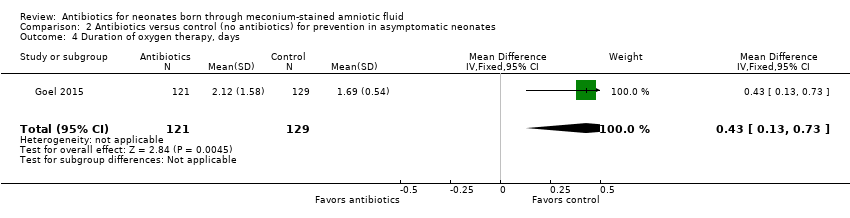
Comparison 2 Antibiotics versus control (no antibiotics) for prevention in asymptomatic neonates, Outcome 4 Duration of oxygen therapy, days.
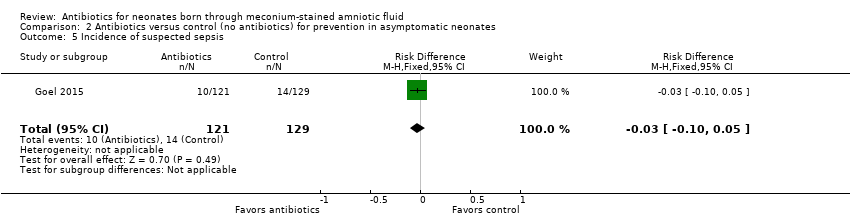
Comparison 2 Antibiotics versus control (no antibiotics) for prevention in asymptomatic neonates, Outcome 5 Incidence of suspected sepsis.

Comparison 2 Antibiotics versus control (no antibiotics) for prevention in asymptomatic neonates, Outcome 6 Incidence of intracranial haemorrhage.

Comparison 2 Antibiotics versus control (no antibiotics) for prevention in asymptomatic neonates, Outcome 7 Incidence of azotaemia.
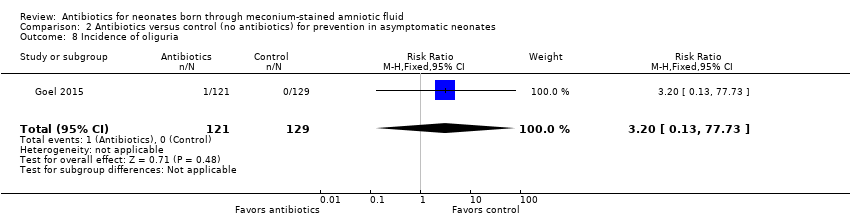
Comparison 2 Antibiotics versus control (no antibiotics) for prevention in asymptomatic neonates, Outcome 8 Incidence of oliguria.

Comparison 2 Antibiotics versus control (no antibiotics) for prevention in asymptomatic neonates, Outcome 9 Incidence of diarrhoea.

Comparison 2 Antibiotics versus control (no antibiotics) for prevention in asymptomatic neonates, Outcome 10 Incidence of mechanical ventilation.

Comparison 2 Antibiotics versus control (no antibiotics) for prevention in asymptomatic neonates, Outcome 11 Incidence of respiratory distress (Downe's score).

Comparison 2 Antibiotics versus control (no antibiotics) for prevention in asymptomatic neonates, Outcome 12 Duration of respiratory distress, hours.

Comparison 2 Antibiotics versus control (no antibiotics) for prevention in asymptomatic neonates, Outcome 13 Incidence of MAS.
| Antibiotics compared with control (no antibiotics) in symptomatic neonates born through meconium‐stained amniotic fluid | ||||||
| Patient or population: symptomatic neonates born through meconium‐stained amniotic fluid | ||||||
| Outcomes | Anticipated absolute effects* (95% CI) | Relative effect | Number of participants | Quality of the evidence | Comments | |
| Risk with control (no antibiotics) | Risk with antibiotics | |||||
| Incidence of confirmed sepsis in first 28 days | Study population | Not estimable | 445 | ⊕⊕⊝⊝ | Evidence was downgraded owing to unclear risk of bias due to methodological limitations, including a large number of dropouts; and imprecision resulting from a small sample size | |
| 9 per 1000 | 0 per 1000 | |||||
| Mortality (before discharge) | Study population | RR 1.69 | 445 | ⊕⊕⊝⊝ | Evidence was downgraded owing to unclear risk of bias due to methodological limitations, including a large number of dropouts; and imprecision resulting from a small sample size | |
| 5 per 1000 | 8 per 1000 | |||||
| Duration of oxygen therapy, days | Mean duration of oxygen therapy (days) was 0 | MD 0.85 days lower | ‐ | 405 | ⊕⊕⊝⊝ | Evidence was downgraded owing to unclear risk of bias due to methodological limitations, including a large number of dropouts; and imprecision resulting from a small sample size |
| Duration of hospital stay, days | Mean duration of hospital stay (days) was 0 | MD 0.16 days higher | ‐ | 146 | ⊕⊕⊕⊝ | Evidence was downgraded owing to imprecision resulting from a small sample size |
| Incidence of mechanical ventilation | Study population | RR 1.18 | 445 | ⊕⊕⊝⊝ | Evidence was downgraded owing to unclear risk of bias due to methodological limitations, including a large number of dropouts; and imprecision resulting from a small sample size | |
| 45 per 1000 | 53 per 1000 | |||||
| Incidence of respiratory failure | Study population | RR 1.20 | 405 | ⊕⊕⊝⊝ | Evidence was downgraded owing to unclear risk of bias due to methodological limitations, including a large number of dropouts; and imprecision resulting from a small sample size | |
| 41 per 1000 | 47 per 1000 | |||||
| *The risk in the intervention group (and its 95% confidence interval) is based on assumed risk in the comparison group and relative effect of the intervention (and its 95% CI) | ||||||
| GRADE Working Group grades of evidence | ||||||
| Antibiotics compared with control (no antibiotics) in asymptomatic neonates born through meconium‐stained amniotic fluid | ||||||
| Patient or population: asymptomatic neonates born through meconium‐stained amniotic fluid | ||||||
| Outcomes | Anticipated absolute effects* (95% CI) | Relative effect | Number of participants | Quality of the evidence | Comments | |
| Risk with control (no antibiotics) | Risk with antibiotics | |||||
| Incidence of confirmed sepsis in first 28 days | Study population | Not estimable | 250 | ⊕⊕⊝⊝ | Evidence was downgraded owing to very serious imprecision, as the results from this study have not been replicated | |
| 54 per 1000 | 0 per 1000 | |||||
| Mortality (before discharge) | Study population | RR 1.07 | 250 | ⊕⊕⊝⊝ | Evidence was downgraded owing to very serious imprecision, as the results from this study have not been replicated | |
| 23 per 1000 | 25 per 1000 | |||||
| Duration of oxygen therapy, days | Mean duration of oxygen therapy (days) was 0 | MD 0.43 days higher | ‐ | 250 | ⊕⊕⊝⊝ | Evidence was downgraded owing to very serious imprecision, as the results from this study have not been replicated |
| Incidence of suspected sepsis | Study population | Not estimable | 250 | ⊕⊕⊝⊝ | Evidence was downgraded owing to very serious imprecision, as the results from this study have not been replicated | |
| 109 per 1000 | 0 per 1000 | |||||
| Incidence of mechanical ventilation | Study population | RR 2.13 | 250 | ⊕⊕⊝⊝ | Evidence was downgraded owing to very serious imprecision, as the results from this study have not been replicated | |
| 23 per 1000 | 50 per 1000 | |||||
| Duration of respiratory distress, hours | Mean duration of respiratory distress (hours) was 0 | MD 6.87 higher | ‐ | 250 | ⊕⊕⊝⊝ | Evidence was downgraded owing to very serious imprecision, as the results from this study have not been replicated |
| Incidence of MAS | Study population | RR 1.17 | 250 | ⊕⊕⊝⊝ | Evidence was downgraded owing to very serious imprecision, as the results from this study have not been replicated | |
| 155 per 1000 | 181 per 1000 | |||||
| *The risk in the intervention group (and its 95% confidence interval) is based on assumed risk in the comparison group and relative effect of the intervention (and its 95% CI) | ||||||
| GRADE Working Group grades of evidence | ||||||
| Outcome or subgroup title | No. of studies | No. of participants | Statistical method | Effect size |
| 1 Incidence of confirmed sepsis in first 28 days Show forest plot | 3 | 445 | Risk Difference (M‐H, Fixed, 95% CI) | 0.00 [‐0.02, 0.03] |
| 2 Mortality (before discharge) Show forest plot | 3 | 445 | Risk Difference (M‐H, Fixed, 95% CI) | 0.00 [‐0.01, 0.02] |
| 3 Duration of oxygen therapy, days Show forest plot | 2 | 405 | Mean Difference (IV, Fixed, 95% CI) | ‐0.85 [‐1.19, ‐0.52] |
| 4 Duration of hospital stay, days Show forest plot | 1 | 146 | Mean Difference (IV, Fixed, 95% CI) | 0.16 [‐1.15, 1.47] |
| 5 Incidence of pulmonary air leak syndrome Show forest plot | 3 | 445 | Risk Ratio (M‐H, Fixed, 95% CI) | 1.50 [0.62, 3.67] |
| 6 Incidence of mechanical ventilation Show forest plot | 3 | 445 | Risk Ratio (M‐H, Fixed, 95% CI) | 1.18 [0.52, 2.67] |
| 7 Time to clear chest radiograph, days Show forest plot | 1 | 146 | Mean Difference (IV, Fixed, 95% CI) | ‐1.31 [‐3.04, 0.42] |
| 8 Incidence of respiratory failure Show forest plot | 2 | 405 | Risk Difference (M‐H, Fixed, 95% CI) | 0.01 [‐0.03, 0.05] |
| 9 Duration of respiratory distress, hours Show forest plot | 1 | 40 | Mean Difference (IV, Random, 95% CI) | ‐1.20 [‐25.59, 23.19] |
| Outcome or subgroup title | No. of studies | No. of participants | Statistical method | Effect size |
| 1 Incidence of confirmed sepsis in first 28 days Show forest plot | 1 | 250 | Risk Difference (M‐H, Fixed, 95% CI) | ‐0.01 [‐0.07, 0.04] |
| 2 Mortality (before discharge) Show forest plot | 1 | 250 | Risk Ratio (M‐H, Fixed, 95% CI) | 1.07 [0.22, 5.18] |
| 3 Duration of mechanical ventilation, days Show forest plot | 1 | 250 | Mean Difference (IV, Fixed, 95% CI) | 0.26 [0.15, 0.37] |
| 4 Duration of oxygen therapy, days Show forest plot | 1 | 250 | Mean Difference (IV, Fixed, 95% CI) | 0.43 [0.13, 0.73] |
| 5 Incidence of suspected sepsis Show forest plot | 1 | 250 | Risk Difference (M‐H, Fixed, 95% CI) | ‐0.03 [‐0.10, 0.05] |
| 6 Incidence of intracranial haemorrhage Show forest plot | 1 | 250 | Risk Ratio (M‐H, Fixed, 95% CI) | 0.36 [0.01, 8.64] |
| 7 Incidence of azotaemia Show forest plot | 1 | 250 | Risk Ratio (M‐H, Fixed, 95% CI) | 3.20 [0.13, 77.73] |
| 8 Incidence of oliguria Show forest plot | 1 | 250 | Risk Ratio (M‐H, Fixed, 95% CI) | 3.20 [0.13, 77.73] |
| 9 Incidence of diarrhoea Show forest plot | 1 | 250 | Risk Ratio (M‐H, Fixed, 95% CI) | 0.12 [0.01, 2.18] |
| 10 Incidence of mechanical ventilation Show forest plot | 1 | 250 | Risk Ratio (M‐H, Fixed, 95% CI) | 2.13 [0.55, 8.34] |
| 11 Incidence of respiratory distress (Downe's score) Show forest plot | 1 | 250 | Risk Ratio (M‐H, Fixed, 95% CI) | 1.18 [0.81, 1.72] |
| 12 Duration of respiratory distress, hours Show forest plot | 1 | 250 | Mean Difference (IV, Fixed, 95% CI) | 6.87 [4.22, 9.52] |
| 13 Incidence of MAS Show forest plot | 1 | 250 | Risk Ratio (M‐H, Fixed, 95% CI) | 1.17 [0.67, 2.04] |