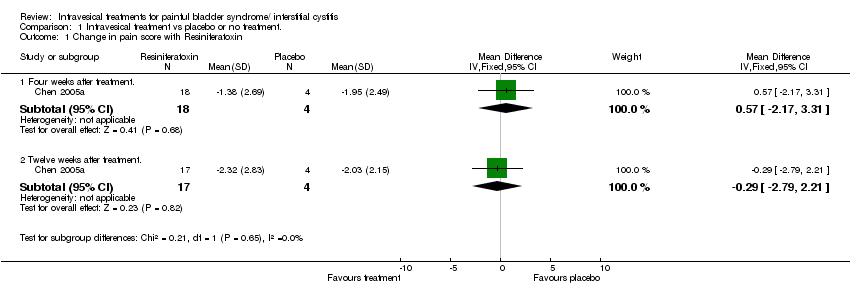
| 1 Change in pain score with Resiniferatoxin Show forest plot | 1 | | Mean Difference (IV, Fixed, 95% CI) | Subtotals only |
|
| 1.1 Four weeks after treatment. | 1 | 22 | Mean Difference (IV, Fixed, 95% CI) | 0.57 [‐2.17, 3.31] |
| 1.2 Twelve weeks after treatment. | 1 | 21 | Mean Difference (IV, Fixed, 95% CI) | ‐0.29 [‐2.79, 2.21] |
| 2 Change in pain score with BCG Show forest plot | 1 | 246 | Mean Difference (IV, Fixed, 95% CI) | ‐0.50 [‐1.06, 0.06] |
|
| 2.1 At 34 weeks after starting instillations | 1 | 246 | Mean Difference (IV, Fixed, 95% CI) | ‐0.50 [‐1.06, 0.06] |
| 3 Pain reduced by at least 50% after Resiniferatoxin. Show forest plot | 1 | | Risk Ratio (M‐H, Fixed, 95% CI) | Subtotals only |
|
| 3.1 0.01microMol/L Rtx. | 1 | 87 | Risk Ratio (M‐H, Fixed, 95% CI) | 0.82 [0.36, 1.88] |
| 3.2 0.05microMol/L Rtx. | 1 | 85 | Risk Ratio (M‐H, Fixed, 95% CI) | 1.40 [0.69, 2.83] |
| 3.3 0.1microMol/L Rtx. | 1 | 79 | Risk Ratio (M‐H, Fixed, 95% CI) | 0.50 [0.17, 1.47] |
| 4 Improvement in vaginal/urethral pain with BCG. Show forest plot | 1 | | Risk Ratio (M‐H, Fixed, 95% CI) | Subtotals only |
|
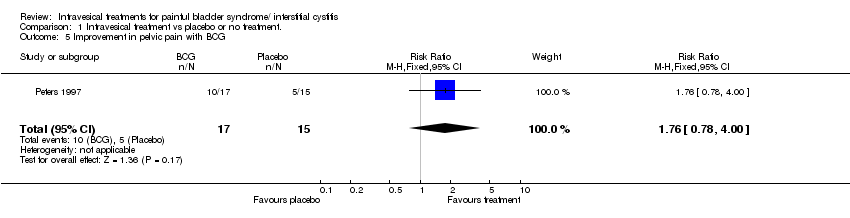
| 5 Improvement in pelvic pain with BCG Show forest plot | 1 | 32 | Risk Ratio (M‐H, Fixed, 95% CI) | 1.76 [0.78, 4.00] |
|
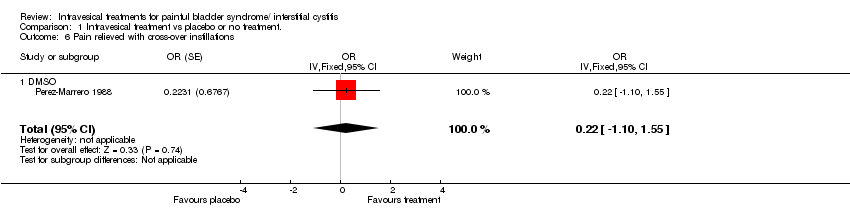
| 6 Pain relieved with cross‐over instillations Show forest plot | 1 | | OR (Fixed, 95% CI) | 0.22 [‐1.10, 1.55] |
|
| 6.1 DMSO | 1 | | OR (Fixed, 95% CI) | 0.22 [‐1.10, 1.55] |
| 7 Change in bladder capacity with BCG Show forest plot | 1 | 222 | Mean Difference (IV, Fixed, 95% CI) | ‐9.0 [‐44.83, 26.83] |
|
| 8 Urodynamic capacity after instillation Show forest plot | | | Other data | No numeric data |
|
| 8.1 BCG | | | Other data | No numeric data |
| 8.2 Pentosanpolysulphate | | | Other data | No numeric data |
| 9 Maximum Cystometric Capacity after cross‐over instillations Show forest plot | 1 | | Mean difference (Fixed, 95% CI) | 17.0 [‐11.22, 45.22] |
|
| 9.1 Dimethyl Sulfoxide | 1 | | Mean difference (Fixed, 95% CI) | 17.0 [‐11.22, 45.22] |
| 10 Change in frequency after Resiniferatoxin Show forest plot | 1 | | Mean Difference (IV, Fixed, 95% CI) | Subtotals only |
|
| 10.1 Four weeks after treatment | 1 | 22 | Mean Difference (IV, Fixed, 95% CI) | ‐0.77 [‐4.58, 3.04] |
| 10.2 Twelve weeks after treatment | 1 | 21 | Mean Difference (IV, Fixed, 95% CI) | ‐2.63 [‐7.23, 1.97] |
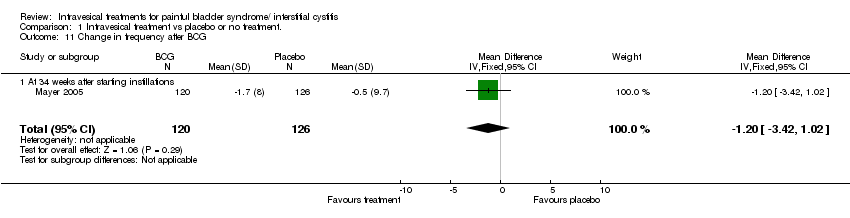
| 11 Change in frequency after BCG Show forest plot | 1 | 246 | Mean Difference (IV, Fixed, 95% CI) | ‐1.2 [‐3.42, 1.02] |
|
| 11.1 At 34 weeks after starting instillations | 1 | 246 | Mean Difference (IV, Fixed, 95% CI) | ‐1.2 [‐3.42, 1.02] |
| 12 Change in frequency after instillation Show forest plot | | | Other data | No numeric data |
|
| 12.1 BCG | | | Other data | No numeric data |
| 12.2 Pentosanpolysulphate | | | Other data | No numeric data |
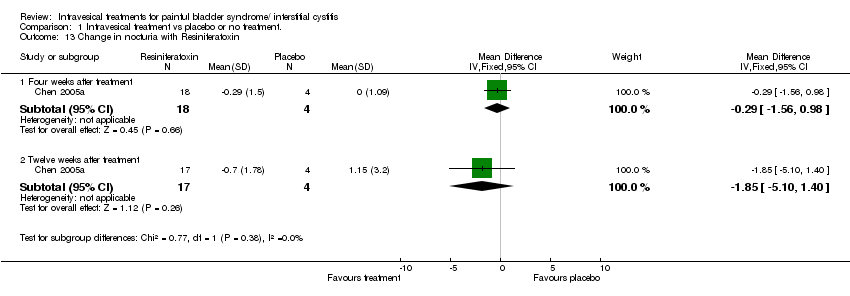
| 13 Change in nocturia with Resiniferatoxin Show forest plot | 1 | | Mean Difference (IV, Fixed, 95% CI) | Subtotals only |
|
| 13.1 Four weeks after treatment | 1 | 22 | Mean Difference (IV, Fixed, 95% CI) | ‐0.29 [‐1.56, 0.98] |
| 13.2 Twelve weeks after treatment | 1 | 21 | Mean Difference (IV, Fixed, 95% CI) | ‐1.85 [‐5.10, 1.40] |
| 14 Change in nocturia Show forest plot | | | Other data | No numeric data |
|
| 14.1 Pentosanpolysulphate | | | Other data | No numeric data |
| 15 Change in Symptom Index (SI) after Resiniferatoxin Show forest plot | 1 | | Mean Difference (IV, Fixed, 95% CI) | Subtotals only |
|
| 15.1 Four weeks after treatment | 1 | 22 | Mean Difference (IV, Fixed, 95% CI) | ‐2.19 [‐5.34, 0.96] |
| 15.2 Twelve weeks after treatment | 1 | 21 | Mean Difference (IV, Fixed, 95% CI) | ‐2.07 [‐5.09, 0.95] |
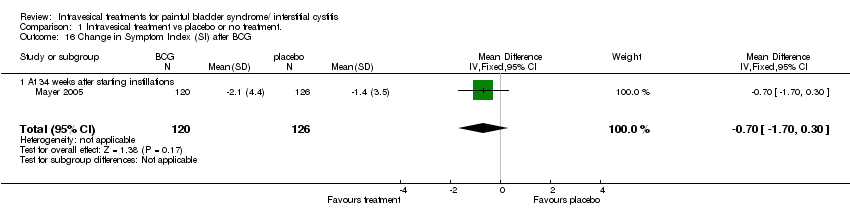
| 16 Change in Symptom Index (SI) after BCG Show forest plot | 1 | 246 | Mean Difference (IV, Fixed, 95% CI) | ‐0.70 [‐1.70, 0.30] |
|
| 16.1 At 34 weeks after starting instillations | 1 | 246 | Mean Difference (IV, Fixed, 95% CI) | ‐0.70 [‐1.70, 0.30] |
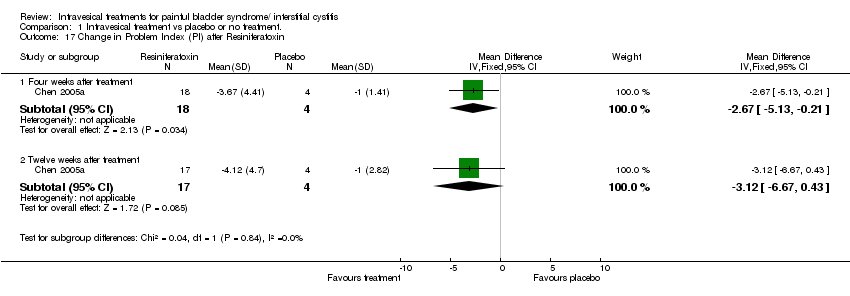
| 17 Change in Problem Index (PI) after Resiniferatoxin Show forest plot | 1 | | Mean Difference (IV, Fixed, 95% CI) | Subtotals only |
|
| 17.1 Four weeks after treatment | 1 | 22 | Mean Difference (IV, Fixed, 95% CI) | ‐2.67 [‐5.13, ‐0.21] |
| 17.2 Twelve weeks after treatment | 1 | 21 | Mean Difference (IV, Fixed, 95% CI) | ‐3.12 [‐6.67, 0.43] |
| 18 Change in Problem Index (PI) after BCG instillation Show forest plot | 1 | 246 | Mean Difference (IV, Fixed, 95% CI) | ‐0.60 [‐1.56, 0.36] |
|
| 18.1 At 34 weeks after starting instillations | 1 | 246 | Mean Difference (IV, Fixed, 95% CI) | ‐0.60 [‐1.56, 0.36] |
| 19 Quality of Life Show forest plot | | | Other data | No numeric data |
|
| 19.1 Mean improvement in Rand‐36 questionnaire after BCG | | | Other data | No numeric data |
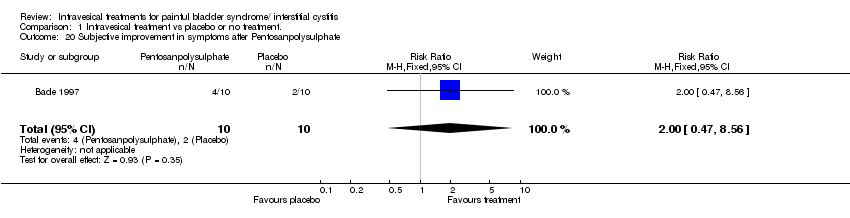
| 20 Subjective improvement in symptoms after Pentosanpolysulphate Show forest plot | 1 | 20 | Risk Ratio (M‐H, Fixed, 95% CI) | 2.0 [0.47, 8.56] |
|
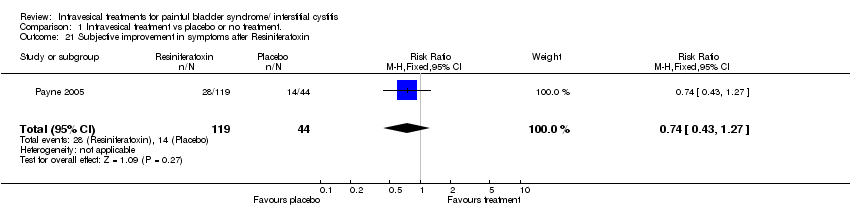
| 21 Subjective improvement in symptoms after Resiniferatoxin Show forest plot | 1 | 163 | Risk Ratio (M‐H, Fixed, 95% CI) | 0.74 [0.43, 1.27] |
|
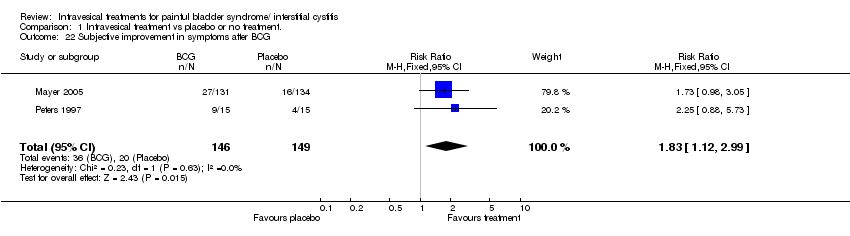
| 22 Subjective improvement in symptoms after BCG Show forest plot | 2 | 295 | Risk Ratio (M‐H, Fixed, 95% CI) | 1.83 [1.12, 2.99] |
|
| 23 Pain with instillation of Resiniferatoxin Show forest plot | 2 | 185 | Risk Ratio (M‐H, Fixed, 95% CI) | 1.53 [1.13, 2.07] |
|
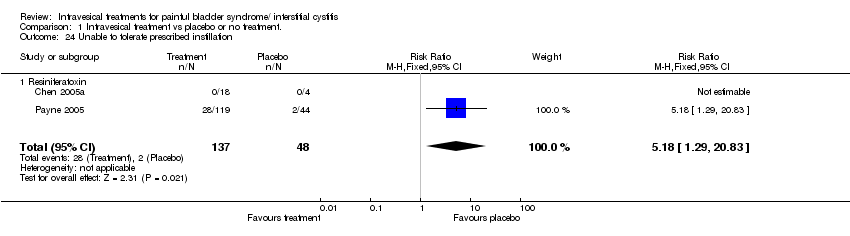
| 24 Unable to tolerate prescribed instillation Show forest plot | 2 | 185 | Risk Ratio (M‐H, Fixed, 95% CI) | 5.18 [1.29, 20.83] |
|
| 24.1 Resiniferatoxin | 2 | 185 | Risk Ratio (M‐H, Fixed, 95% CI) | 5.18 [1.29, 20.83] |
| 25 Adverse Events with BCG or placebo instillation. Show forest plot | | | Other data | No numeric data |
|
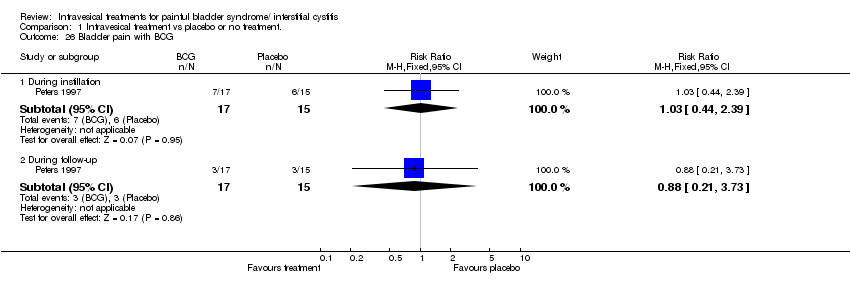
| 26 Bladder pain with BCG Show forest plot | 1 | | Risk Ratio (M‐H, Fixed, 95% CI) | Subtotals only |
|
| 26.1 During instillation | 1 | 32 | Risk Ratio (M‐H, Fixed, 95% CI) | 1.03 [0.44, 2.39] |
| 26.2 During follow‐up | 1 | 32 | Risk Ratio (M‐H, Fixed, 95% CI) | 0.88 [0.21, 3.73] |
| 27 Bladder symptoms with instillation Show forest plot | 1 | 261 | Risk Ratio (M‐H, Fixed, 95% CI) | 1.02 [0.90, 1.17] |
|
| 27.1 BCG | 1 | 261 | Risk Ratio (M‐H, Fixed, 95% CI) | 1.02 [0.90, 1.17] |
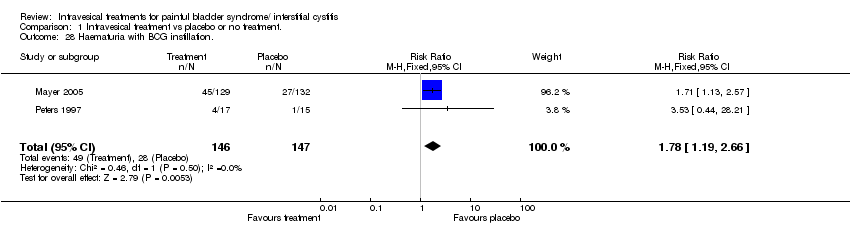
| 28 Haematuria with BCG instillation. Show forest plot | 2 | 293 | Risk Ratio (M‐H, Fixed, 95% CI) | 1.78 [1.19, 2.66] |
|
| 29 Arthralgia/Myalgia with BCG Show forest plot | 1 | 261 | Risk Ratio (M‐H, Fixed, 95% CI) | 0.53 [0.30, 0.92] |
|
| 30 Arthralgia with BCG Show forest plot | 1 | | Risk Ratio (M‐H, Fixed, 95% CI) | Subtotals only |
|
| 30.1 During instillation | 1 | 32 | Risk Ratio (M‐H, Fixed, 95% CI) | 0.88 [0.06, 12.91] |
| 30.2 During follow‐up | 1 | 32 | Risk Ratio (M‐H, Fixed, 95% CI) | 2.65 [0.31, 22.82] |
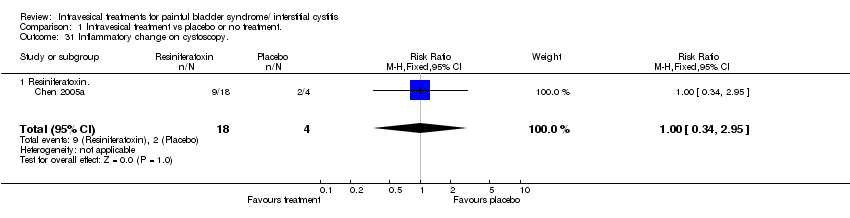
| 31 Inflammatory change on cystoscopy. Show forest plot | 1 | 22 | Risk Ratio (M‐H, Fixed, 95% CI) | 1.0 [0.34, 2.95] |
|
| 31.1 Resiniferatoxin. | 1 | 22 | Risk Ratio (M‐H, Fixed, 95% CI) | 1.0 [0.34, 2.95] |