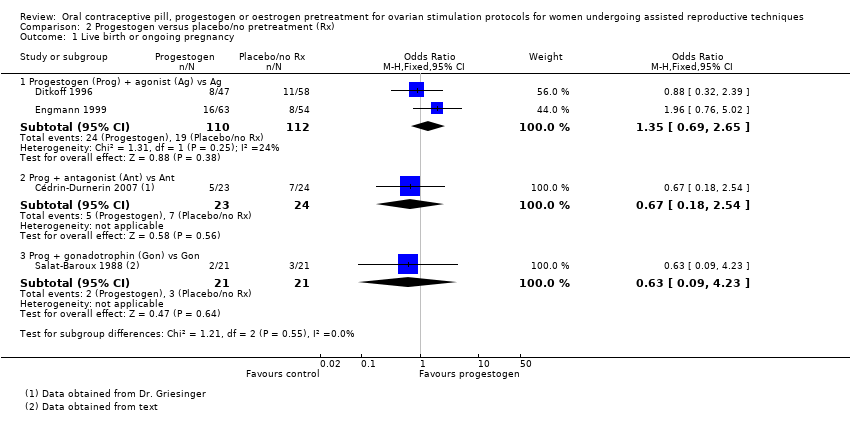
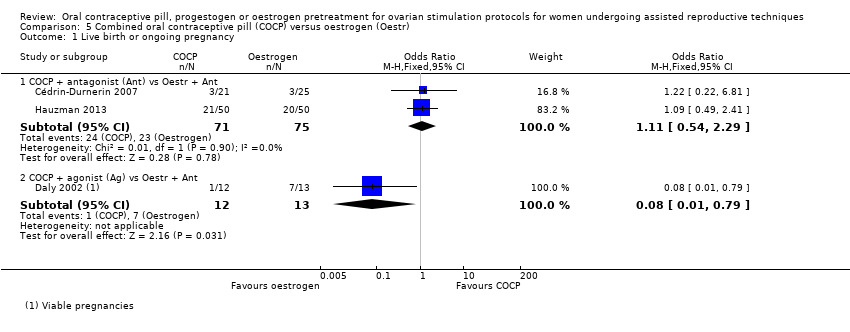
| 1 Live birth or ongoing pregnancy Show forest plot | 8 | | Odds Ratio (M‐H, Fixed, 95% CI) | Subtotals only |
|
| 1.1 COCP + antagonist (Ant) vs Ant | 6 | 1335 | Odds Ratio (M‐H, Fixed, 95% CI) | 0.74 [0.58, 0.95] |
| 1.2 COCP + Ant vs agonist (Ag) | 4 | 724 | Odds Ratio (M‐H, Fixed, 95% CI) | 0.89 [0.64, 1.25] |
| 1.3 COCP + Ant vs Ant, low response | 1 | 80 | Odds Ratio (M‐H, Fixed, 95% CI) | 1.71 [0.61, 4.79] |
| 1.4 COCP + Ant vs Ag, low response | 1 | 80 | Odds Ratio (M‐H, Fixed, 95% CI) | 1.13 [0.43, 2.98] |
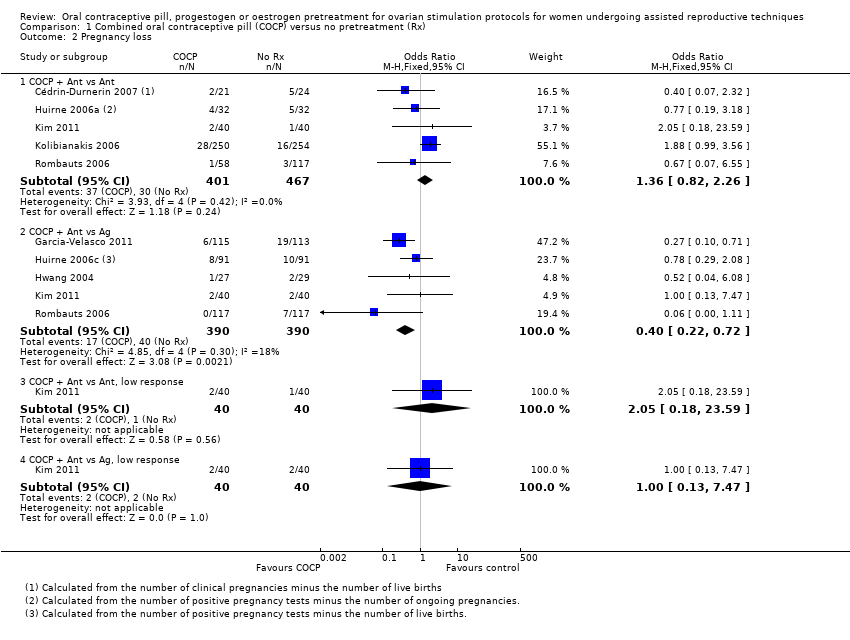
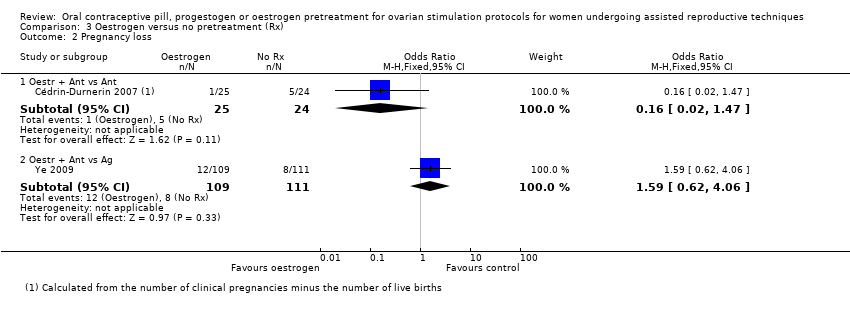
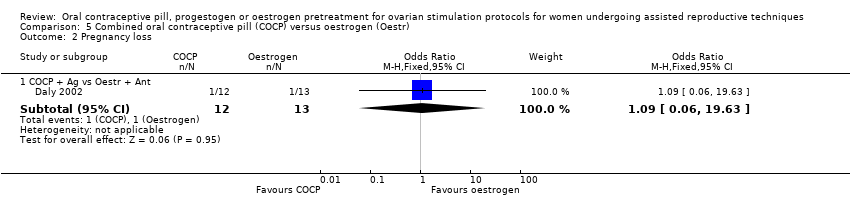
| 2 Pregnancy loss Show forest plot | 8 | | Odds Ratio (M‐H, Fixed, 95% CI) | Subtotals only |
|
| 2.1 COCP + Ant vs Ant | 5 | 868 | Odds Ratio (M‐H, Fixed, 95% CI) | 1.36 [0.82, 2.26] |
| 2.2 COCP + Ant vs Ag | 5 | 780 | Odds Ratio (M‐H, Fixed, 95% CI) | 0.40 [0.22, 0.72] |
| 2.3 COCP + Ant vs Ant, low response | 1 | 80 | Odds Ratio (M‐H, Fixed, 95% CI) | 2.05 [0.18, 23.59] |
| 2.4 COCP + Ant vs Ag, low response | 1 | 80 | Odds Ratio (M‐H, Fixed, 95% CI) | 1.0 [0.13, 7.47] |
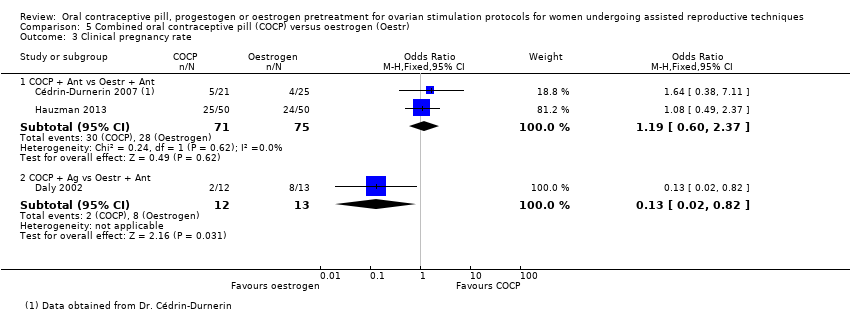
| 3 Clinical pregnancy rate Show forest plot | 8 | | Odds Ratio (M‐H, Fixed, 95% CI) | Subtotals only |
|
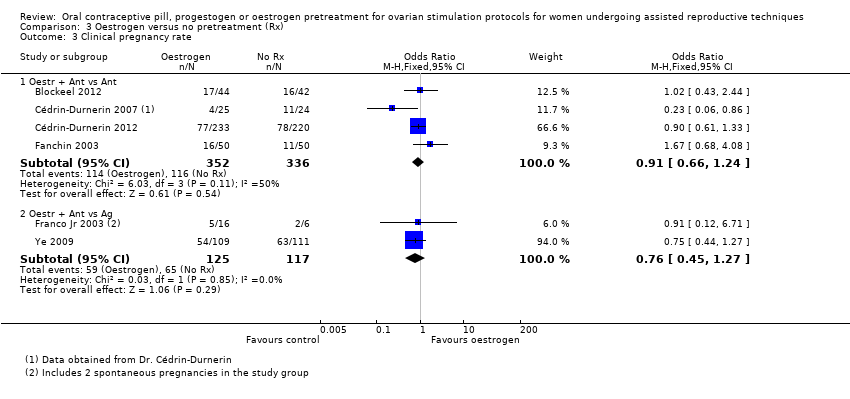
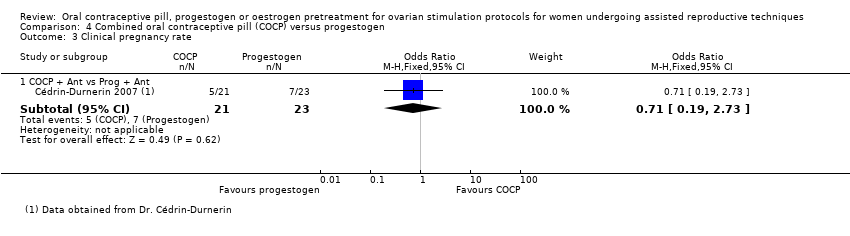
| 3.1 COCP + Ant vs Ant | 5 | 740 | Odds Ratio (M‐H, Fixed, 95% CI) | 0.85 [0.63, 1.15] |
| 3.2 COCP + Ant vs Ag | 4 | 546 | Odds Ratio (M‐H, Fixed, 95% CI) | 0.84 [0.59, 1.20] |
| 3.3 COCP + Ant vs Ant, low response | 1 | 80 | Odds Ratio (M‐H, Fixed, 95% CI) | 1.85 [0.69, 4.97] |
| 3.4 COCP + Ant vs Ag, low response | 1 | 80 | Odds Ratio (M‐H, Fixed, 95% CI) | 1.12 [0.44, 2.83] |
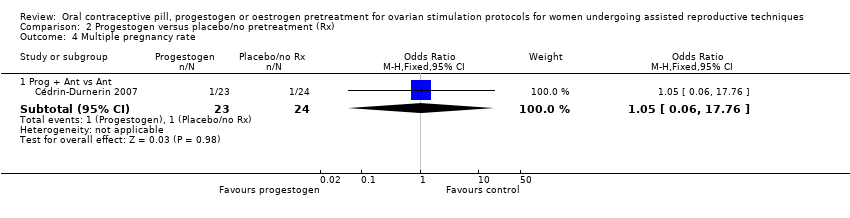
| 4 Multiple pregnancy rate Show forest plot | 5 | | Odds Ratio (M‐H, Fixed, 95% CI) | Subtotals only |
|
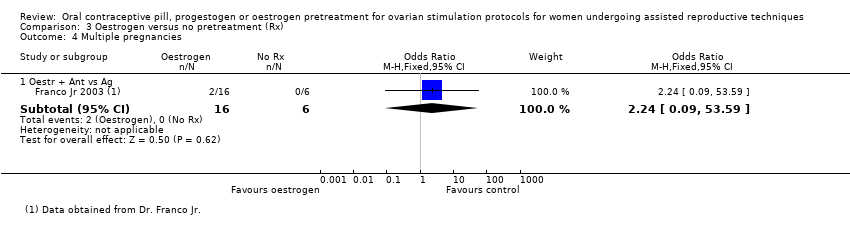
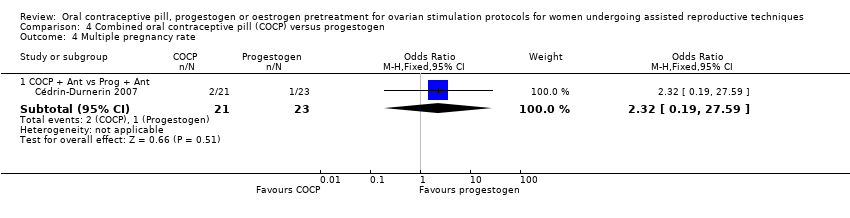
| 4.1 COCP + Ant vs Ant | 2 | 125 | Odds Ratio (M‐H, Fixed, 95% CI) | 2.21 [0.53, 9.26] |
| 4.2 COCP + Ant vs Ag | 4 | 546 | Odds Ratio (M‐H, Fixed, 95% CI) | 1.36 [0.85, 2.19] |
| 4.3 COCP + Ant vs Ant, low response | 1 | 80 | Odds Ratio (M‐H, Fixed, 95% CI) | 2.11 [0.36, 12.24] |
| 4.4 COCP + Ant vs Ag, low response | 1 | 80 | Odds Ratio (M‐H, Fixed, 95% CI) | 1.37 [0.29, 6.56] |
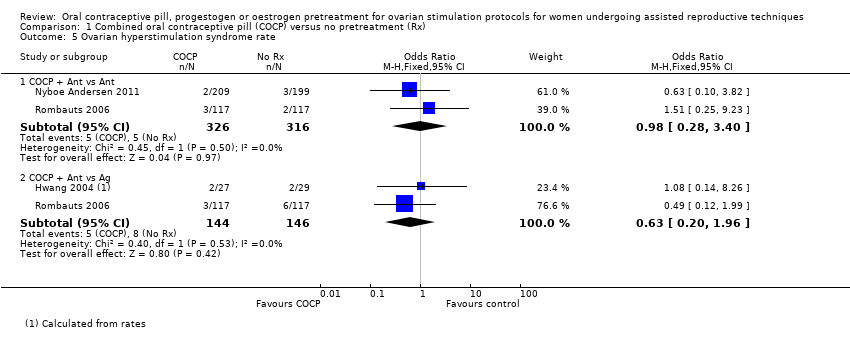
| 5 Ovarian hyperstimulation syndrome rate Show forest plot | 3 | | Odds Ratio (M‐H, Fixed, 95% CI) | Subtotals only |
|
| 5.1 COCP + Ant vs Ant | 2 | 642 | Odds Ratio (M‐H, Fixed, 95% CI) | 0.98 [0.28, 3.40] |
| 5.2 COCP + Ant vs Ag | 2 | 290 | Odds Ratio (M‐H, Fixed, 95% CI) | 0.63 [0.20, 1.96] |
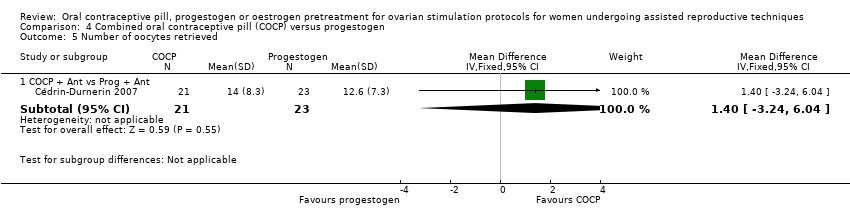
| 6 Number of oocytes retrieved Show forest plot | 8 | | Mean Difference (IV, Fixed, 95% CI) | Subtotals only |
|
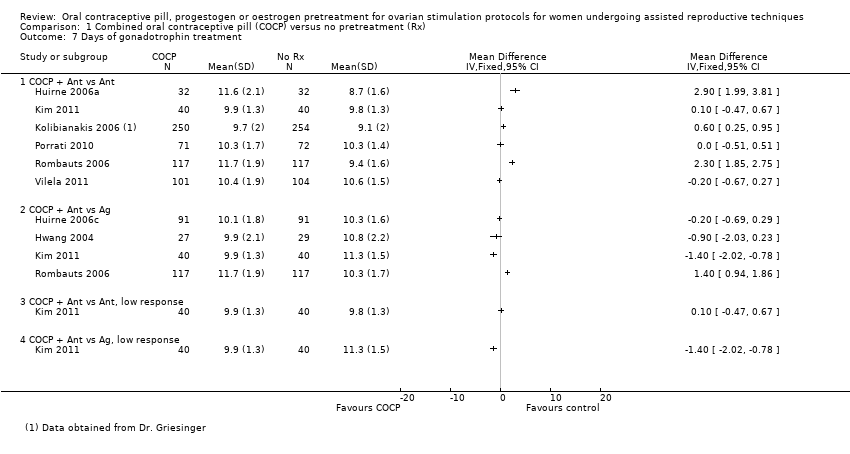
| 7 Days of gonadotrophin treatment Show forest plot | 8 | | Mean Difference (IV, Fixed, 95% CI) | Totals not selected |
|
| 7.1 COCP + Ant vs Ant | 6 | | Mean Difference (IV, Fixed, 95% CI) | 0.0 [0.0, 0.0] |
| 7.2 COCP + Ant vs Ag | 4 | | Mean Difference (IV, Fixed, 95% CI) | 0.0 [0.0, 0.0] |
| 7.3 COCP + Ant vs Ant, low response | 1 | | Mean Difference (IV, Fixed, 95% CI) | 0.0 [0.0, 0.0] |
| 7.4 COCP + Ant vs Ag, low response | 1 | | Mean Difference (IV, Fixed, 95% CI) | 0.0 [0.0, 0.0] |
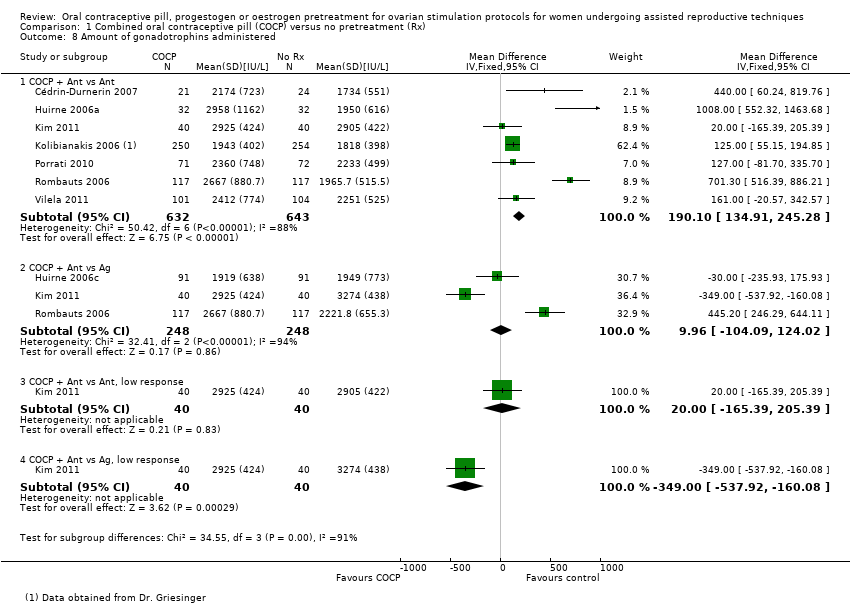
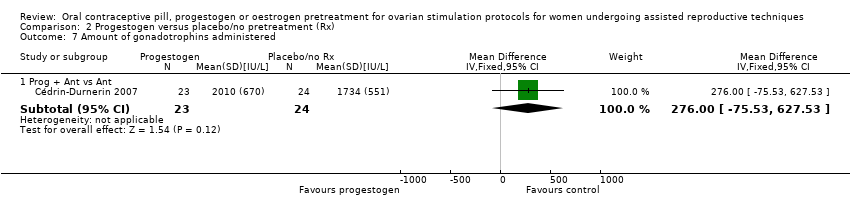
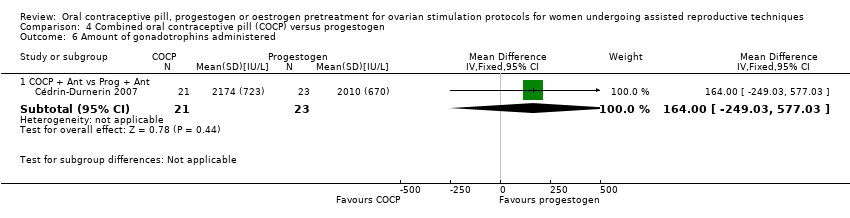
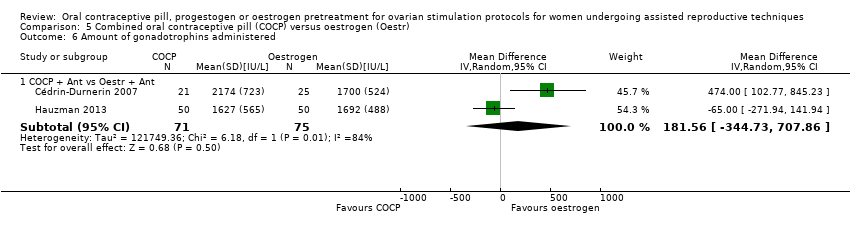
| 8 Amount of gonadotrophins administered Show forest plot | 8 | | Mean Difference (IV, Fixed, 95% CI) | Subtotals only |
|
| 8.1 COCP + Ant vs Ant | 7 | 1275 | Mean Difference (IV, Fixed, 95% CI) | 190.10 [134.91, 245.28] |
| 8.2 COCP + Ant vs Ag | 3 | 496 | Mean Difference (IV, Fixed, 95% CI) | 9.96 [‐104.09, 124.02] |
| 8.3 COCP + Ant vs Ant, low response | 1 | 80 | Mean Difference (IV, Fixed, 95% CI) | 20.0 [‐165.39, 205.39] |
| 8.4 COCP + Ant vs Ag, low response | 1 | 80 | Mean Difference (IV, Fixed, 95% CI) | ‐349.0 [‐537.92, ‐160.08] |
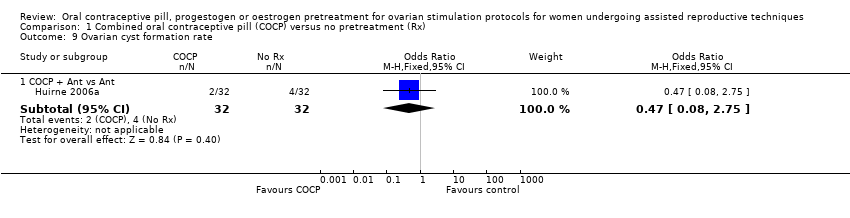
| 9 Ovarian cyst formation rate Show forest plot | 1 | | Odds Ratio (M‐H, Fixed, 95% CI) | Subtotals only |
|
| 9.1 COCP + Ant vs Ant | 1 | 64 | Odds Ratio (M‐H, Fixed, 95% CI) | 0.47 [0.08, 2.75] |