Pretratamiento con píldora anticonceptiva oral, progestágeno o estrógeno para los protocolos de estimulación ovárica en pacientes sometidas a técnicas de reproducción asistida
Información
- DOI:
- https://doi.org/10.1002/14651858.CD006109.pub3Copiar DOI

- Base de datos:
-
- Cochrane Database of Systematic Reviews
- Versión publicada:
-
- 25 mayo 2017see what's new
- Tipo:
-
- Intervention
- Etapa:
-
- Review
- Grupo Editorial Cochrane:
-
Grupo Cochrane de Ginecología y fertilidad
- Copyright:
-
- Copyright © 2017 The Cochrane Collaboration. Published by John Wiley & Sons, Ltd.
Cifras del artículo
Altmetric:
Citado por:
Autores
Contributions of authors
For the 2017 update:
ROA: selected studies, extracted and analyzed data, contacted authors of trials and drafted the results, discussion and authors' conclusions of the review.
AL: selected studies, extracted and analyzed data, and contributed to the discussion and conclusions.
CF: acted as third review author to resolve differences, acted as a clinical expert and commented on the review.
LR: acted as a clinical expert and commented on the review.
JK: acted as a clinical expert and commented on the review.
For the 2009 update:
Brechtje Smulders and Sanne van Oirschot contributed equally to the review.
Brechtje Smulders drafted the Background and Objectives of the review, and performed the search, selected the studies, extracted and analyzed the data, contacted the authors of trials and drafted the Results, Discussion and Authors' conclusions of the review together with Sanne M van Oirschot. BS also drafted half of the tables of Characteristics of included studies and drafted Table 1, Table 2 and Table 3.
Sanne M van Oirschot drafted the Methods of the review, and performed the search, selected the studies, extracted and analyzed the data, contacted the authors of trials and drafted the Results, Discussion and Authors' conclusions of the review together with Brechtje Smulders. SvO also drafted half of the tables of Characteristics of included studies and all the tables of Characteristics of excluded studies.
Cindy Farquhar helped to solve differences of opinion as a third review author, commented on the review and helped with drafting the Discussion and Authors' conclusions of the review.
Luk Rombauts acted as a clinical expert and commented on the review.
Jan Kremer acted as a clinical expert and commented on the review.
Sources of support
Internal sources
-
No sources of support supplied
External sources
-
Stichting Nijmeegs Universiteitsfonds (SNUF), Netherlands.
Scholarship to support students of the University of Nijmegen to do a study, internship or research outside The Netherlands.
-
CVSB (Commissie Voorzieningen Studenten Budget), Netherlands.
Compensation for studying outside The Netherlands.
Declarations of interest
LR was the first author of a randomized trial about oral contraceptive pretreatment (Rombauts 2006). This study was sponsored by Organon/Schering Plough. He was not involved in selection of that study or in extraction and interpretation of data from it. He is a minority shareholder in an IVF unit that has received research grants from MSD, Merck‐Serono and Ferring. He has received educational grants from MSD, Merck‐Serono and Ferring and provided consultancy services and board membership to Ferring Australia.
ROA, AL, CF and JK have no interests to declare.
Acknowledgements
For the 2017 review:
We thank Dr Julie Brown for assistance with screening, selection and data extraction during 2015. We also wish to acknowledge the contributions of Brechtje Smulders and Sanne van Oirschot to previous versions of this review.
For the 2009 review:
We would like to thank He Haojie, Bolarinde Ola, Pan LIngya and Li Shangwei, the authors of the original protocol.
We are also grateful to Marian Showell, the Information Specialist of the CGF group, for developing the search strategy and to Jane Clarke, the Review Group Co‐ordinator of the MDSG and to Vanessa Jordan, NZ Cochrane fellow, for answering our questions.
Furthermore, we would like to thank Dr G Griesinger for kindly supplying us with information on the trials that he included in his review.
Also thanks to Dr JG Franco Jr, Dr EC Ditkoff, Dr I Cédrin‐Durnerin, Dr CH Kim and M Grynberg (on behalf of Dr R Fanchin) for sending us more data on their studies.
We would like to thank all the members of the MDSG for their assistance in contacting the authors from the included trials. Special thanks to S Dias and X Zhu for their help with articles in languages other than English.
Version history
| Published | Title | Stage | Authors | Version |
| 2017 May 25 | Oral contraceptive pill, progestogen or oestrogen pretreatment for ovarian stimulation protocols for women undergoing assisted reproductive techniques | Review | Cindy Farquhar, Luk Rombauts, Jan AM Kremer, Anne Lethaby, Reuben Olugbenga Ayeleke | |
| 2010 Jan 20 | Oral contraceptive pill, progestogen or estrogen pre‐treatment for ovarian stimulation protocols for women undergoing assisted reproductive techniques | Review | Brechtje Smulders, Sanne M van Oirschot, Cindy Farquhar, Luk Rombauts, Jan AM Kremer | |
| 2006 Jul 19 | Oral contraceptive pill, progestogen or estrogen pre‐treatment for ovarian stimulation protocols for women undergoing assisted reproductive techniques | Protocol | Brechtje Smulders, Sanne M van Oirschot, Cindy Farquhar, Luk Rombauts, Jan AM Kremer | |
Differences between protocol and review
The biggest change between the protocol and the review is the formation of different subgroups. In the protocol, we described that we would perform subgroup analyses on women's age; poor response; agonist long, short and ultra‐short protocol; and the duration of pretreatment. After examining the included studies, we decided it would make more sense to perform subgroup analyses on the type of GnRH analogue used in the treatment cycles. After this, we could not perform any more subgroup analysis on the planned regimens, because there were not enough studies per subgroup. Furthermore, we did not perform any sensitivity analyses due to the small number of included studies per subgroup.
Other minor changes to this review included: the exclusion of oocyte donors as participants, we rewrote the interventions to make them more understandable, we changed the outcome 'ovarian cysts per woman randomized' to 'number of women with ovarian cysts' and we removed a few items of data extraction because we thought they were less important. We were unable to perform a funnel plot because of the limited number of included studies to each subgroup.
We combined live births and ongoing pregnancies as one outcome measure in the review against two separate outcome measures in the protocol.
Keywords
MeSH
Medical Subject Headings (MeSH) Keywords
- Contraceptives, Oral [*administration & dosage];
- Estrogens [*administration & dosage];
- Fertilization in Vitro [*methods];
- Gonadotropin-Releasing Hormone [antagonists & inhibitors];
- Infertility, Female;
- Live Birth [epidemiology];
- Ovarian Hyperstimulation Syndrome [epidemiology];
- Ovulation Induction [*methods];
- Pregnancy Rate;
- Pregnancy, Multiple [statistics & numerical data];
- Progestins [*administration & dosage];
- Randomized Controlled Trials as Topic;
- Sperm Injections, Intracytoplasmic;
- Treatment Outcome;
Medical Subject Headings Check Words
Female; Humans; Pregnancy;
PICO
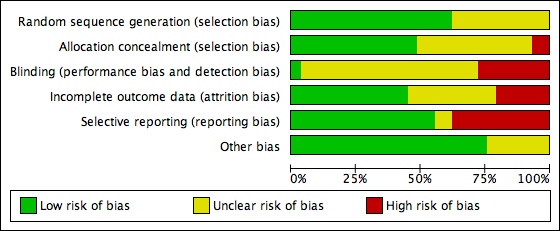
Methodological quality graph: review authors' judgements about each methodological quality item presented as percentages across all included studies.
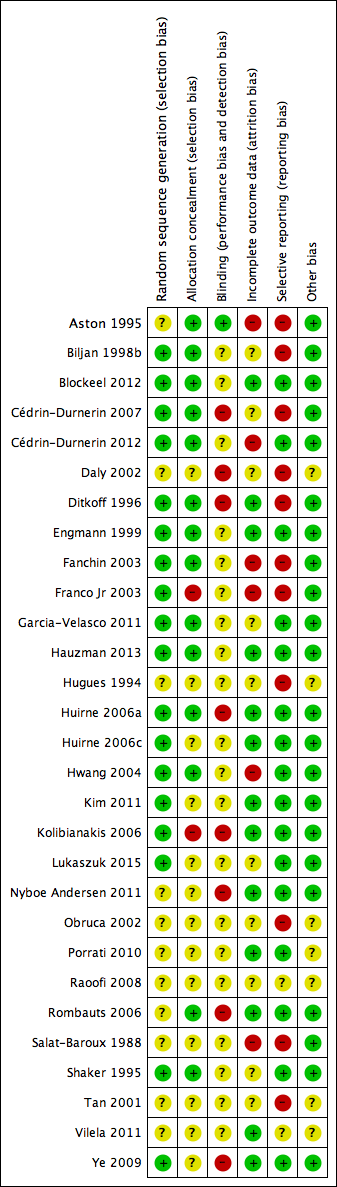
Methodological quality summary: review authors' judgements about each methodological quality item for each included study.

Study PRISMA flow chart

Forest plot of comparison: 1 Combined oral contraceptive pill (OCP) versus no pretreatment (Rx), outcome: 1.1 Live birth or ongoing pregnancy.

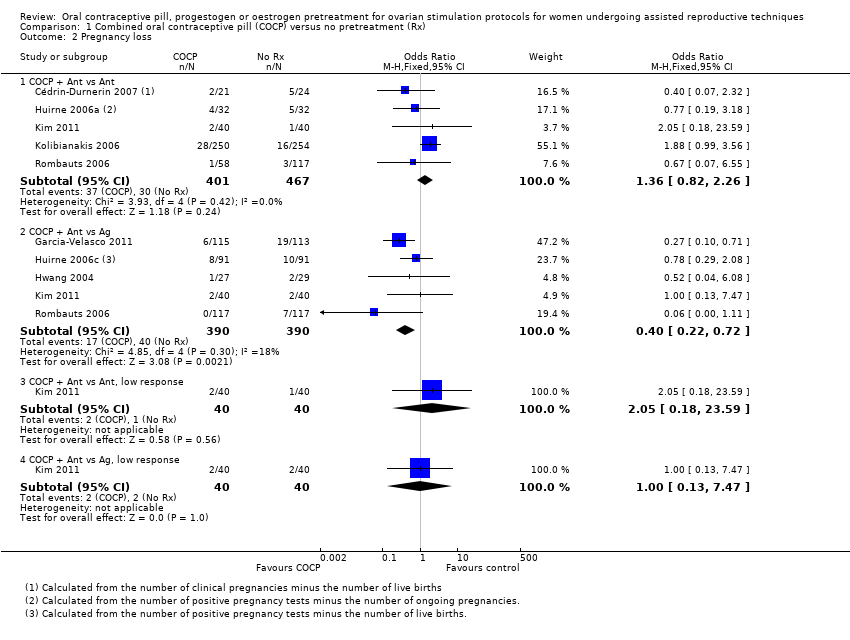
Forest plot of comparison: 1 Combined oral contraceptive pill (COCP) versus no pretreatment (Rx), outcome: 1.2 Pregnancy loss.

Forest plot of comparison: 3 Oestrogen versus no pretreatment (Rx), outcome: 3.1 Live birth or ongoing pregnancy.
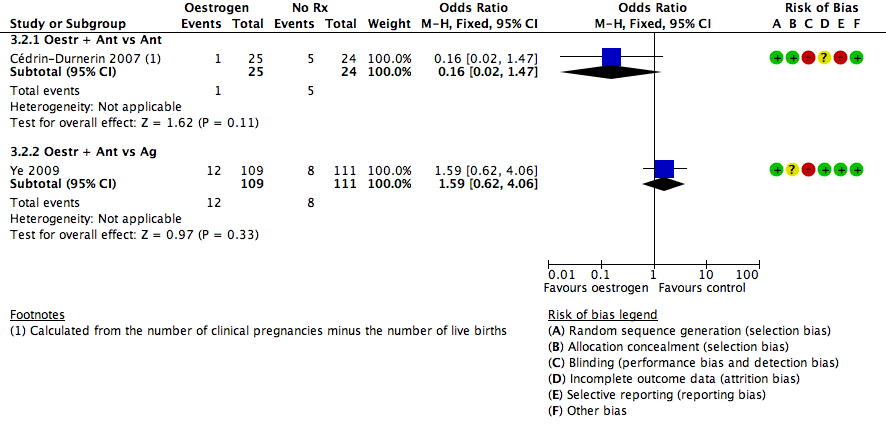
Forest plot of comparison: 3 Oestrogen versus no pretreatment (Rx), outcome: 3.2 Pregnancy loss.

Comparison 1 Combined oral contraceptive pill (COCP) versus no pretreatment (Rx), Outcome 1 Live birth or ongoing pregnancy.
Comparison 1 Combined oral contraceptive pill (COCP) versus no pretreatment (Rx), Outcome 2 Pregnancy loss.

Comparison 1 Combined oral contraceptive pill (COCP) versus no pretreatment (Rx), Outcome 3 Clinical pregnancy rate.

Comparison 1 Combined oral contraceptive pill (COCP) versus no pretreatment (Rx), Outcome 4 Multiple pregnancy rate.
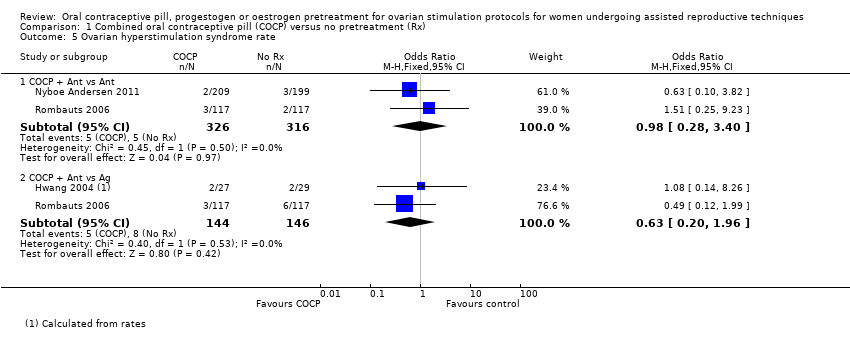
Comparison 1 Combined oral contraceptive pill (COCP) versus no pretreatment (Rx), Outcome 5 Ovarian hyperstimulation syndrome rate.

Comparison 1 Combined oral contraceptive pill (COCP) versus no pretreatment (Rx), Outcome 6 Number of oocytes retrieved.
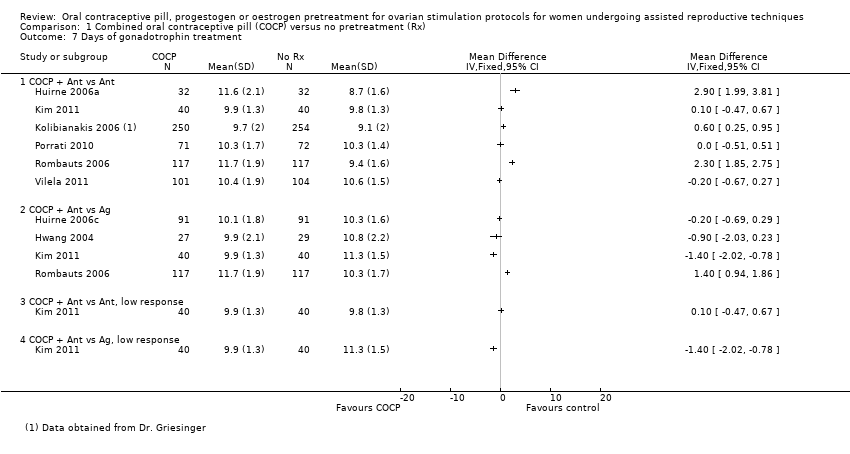
Comparison 1 Combined oral contraceptive pill (COCP) versus no pretreatment (Rx), Outcome 7 Days of gonadotrophin treatment.
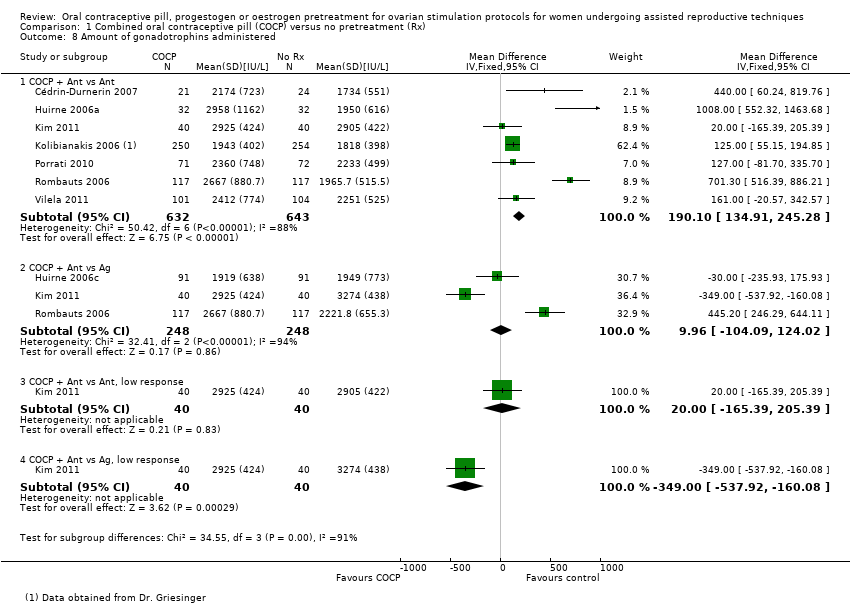
Comparison 1 Combined oral contraceptive pill (COCP) versus no pretreatment (Rx), Outcome 8 Amount of gonadotrophins administered.
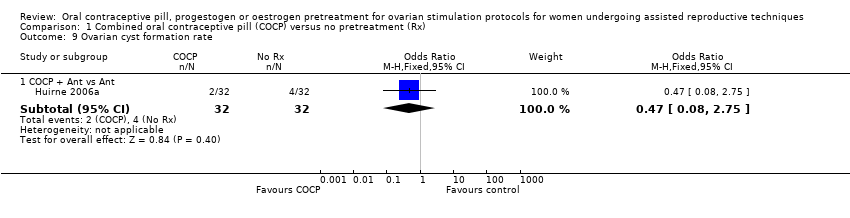
Comparison 1 Combined oral contraceptive pill (COCP) versus no pretreatment (Rx), Outcome 9 Ovarian cyst formation rate.
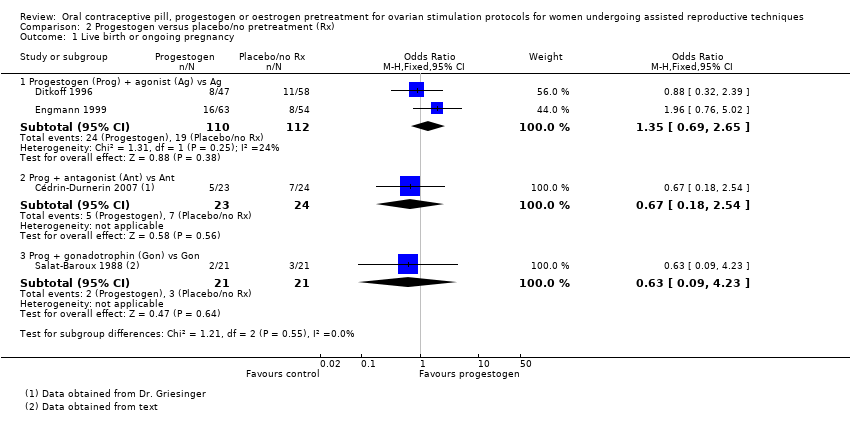
Comparison 2 Progestogen versus placebo/no pretreatment (Rx), Outcome 1 Live birth or ongoing pregnancy.

Comparison 2 Progestogen versus placebo/no pretreatment (Rx), Outcome 2 Pregnancy loss.

Comparison 2 Progestogen versus placebo/no pretreatment (Rx), Outcome 3 Clinical pregnancy rate.
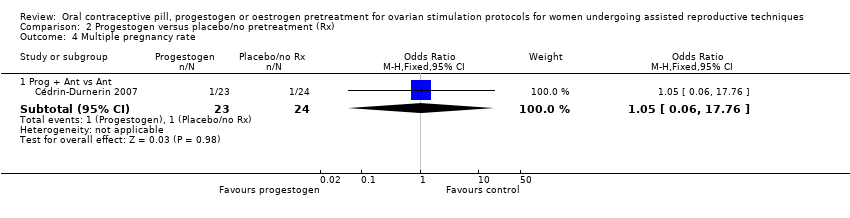
Comparison 2 Progestogen versus placebo/no pretreatment (Rx), Outcome 4 Multiple pregnancy rate.

Comparison 2 Progestogen versus placebo/no pretreatment (Rx), Outcome 5 Number of oocytes retrieved.

Comparison 2 Progestogen versus placebo/no pretreatment (Rx), Outcome 6 Days of gonadotrophin treatment.
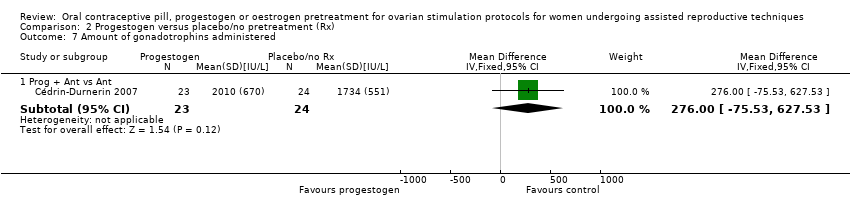
Comparison 2 Progestogen versus placebo/no pretreatment (Rx), Outcome 7 Amount of gonadotrophins administered.

Comparison 2 Progestogen versus placebo/no pretreatment (Rx), Outcome 8 Ovarian cyst formation rate.

Comparison 3 Oestrogen versus no pretreatment (Rx), Outcome 1 Live birth or ongoing pregnancy.
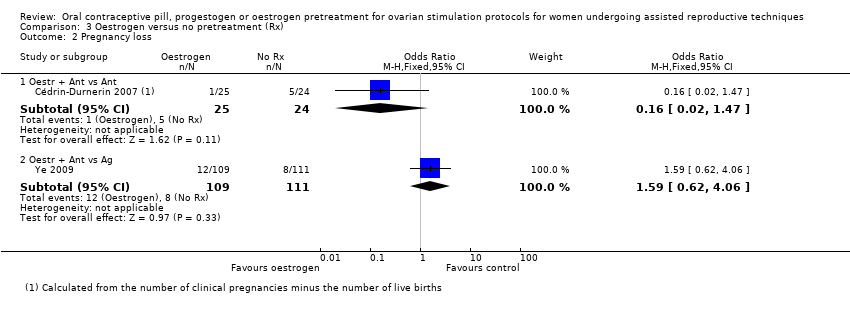
Comparison 3 Oestrogen versus no pretreatment (Rx), Outcome 2 Pregnancy loss.
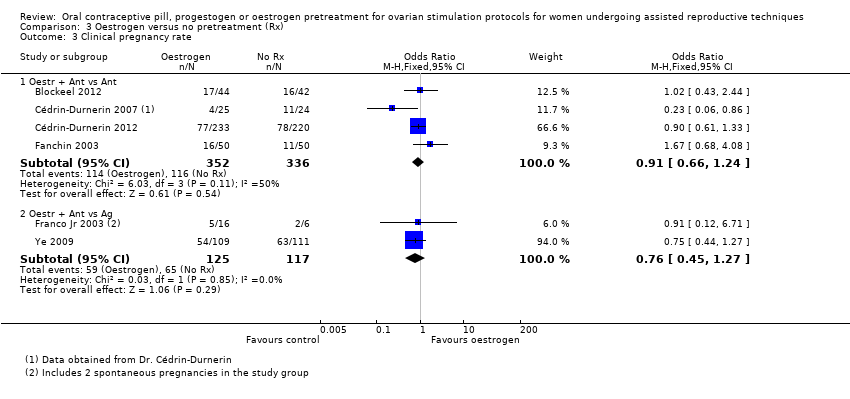
Comparison 3 Oestrogen versus no pretreatment (Rx), Outcome 3 Clinical pregnancy rate.
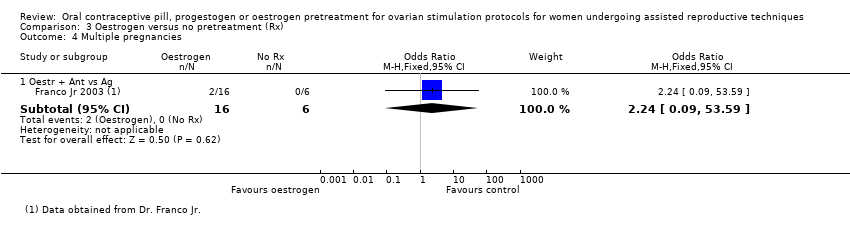
Comparison 3 Oestrogen versus no pretreatment (Rx), Outcome 4 Multiple pregnancies.

Comparison 3 Oestrogen versus no pretreatment (Rx), Outcome 5 Ovarian hyperstimulation syndrome rate.

Comparison 3 Oestrogen versus no pretreatment (Rx), Outcome 6 Number of oocytes retrieved.

Comparison 3 Oestrogen versus no pretreatment (Rx), Outcome 7 Days of gonadotrophin treatment.

Comparison 3 Oestrogen versus no pretreatment (Rx), Outcome 8 Amount of gonadotrophins administered.

Comparison 4 Combined oral contraceptive pill (COCP) versus progestogen, Outcome 1 Live birth or ongoing pregnancy.

Comparison 4 Combined oral contraceptive pill (COCP) versus progestogen, Outcome 2 Pregnancy loss.
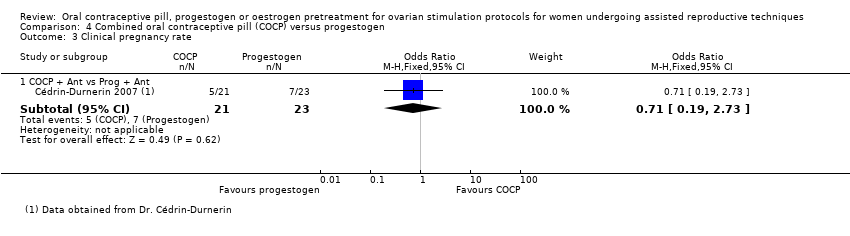
Comparison 4 Combined oral contraceptive pill (COCP) versus progestogen, Outcome 3 Clinical pregnancy rate.
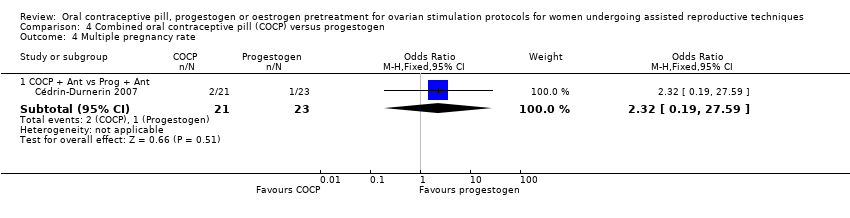
Comparison 4 Combined oral contraceptive pill (COCP) versus progestogen, Outcome 4 Multiple pregnancy rate.
Comparison 4 Combined oral contraceptive pill (COCP) versus progestogen, Outcome 5 Number of oocytes retrieved.
Comparison 4 Combined oral contraceptive pill (COCP) versus progestogen, Outcome 6 Amount of gonadotrophins administered.
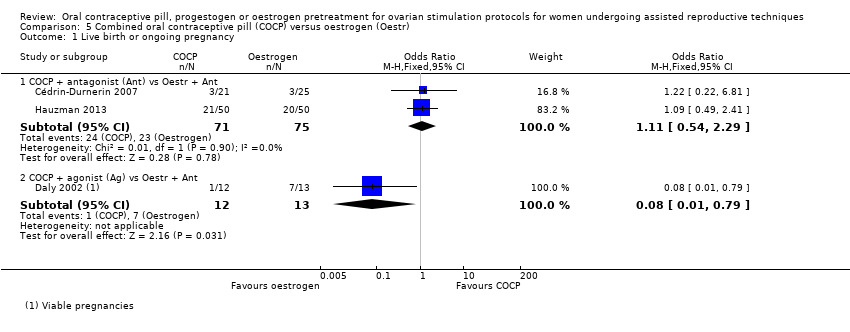
Comparison 5 Combined oral contraceptive pill (COCP) versus oestrogen (Oestr), Outcome 1 Live birth or ongoing pregnancy.
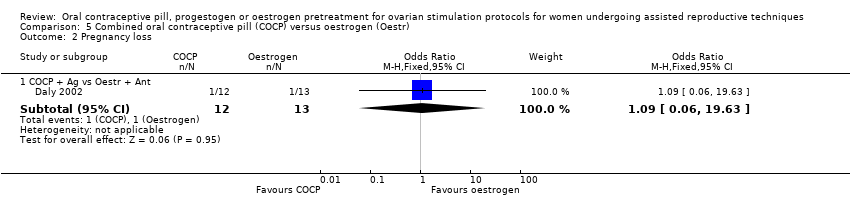
Comparison 5 Combined oral contraceptive pill (COCP) versus oestrogen (Oestr), Outcome 2 Pregnancy loss.
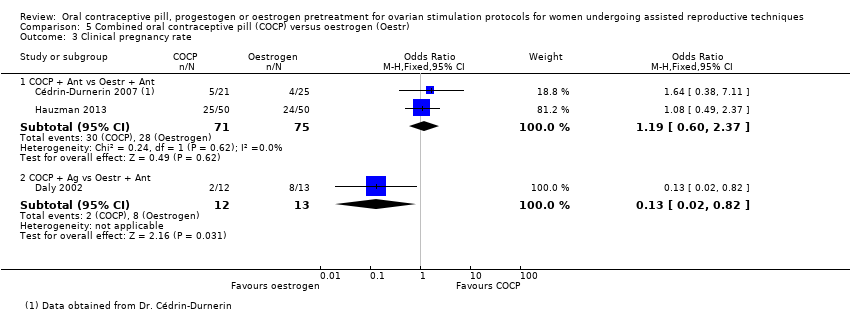
Comparison 5 Combined oral contraceptive pill (COCP) versus oestrogen (Oestr), Outcome 3 Clinical pregnancy rate.

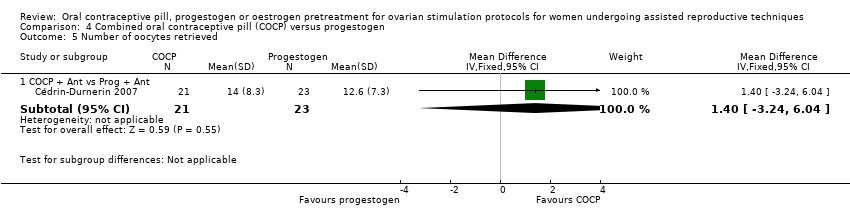
Comparison 5 Combined oral contraceptive pill (COCP) versus oestrogen (Oestr), Outcome 4 Number of oocytes retrieved.

Comparison 5 Combined oral contraceptive pill (COCP) versus oestrogen (Oestr), Outcome 5 Days of gonadotropin treatment.
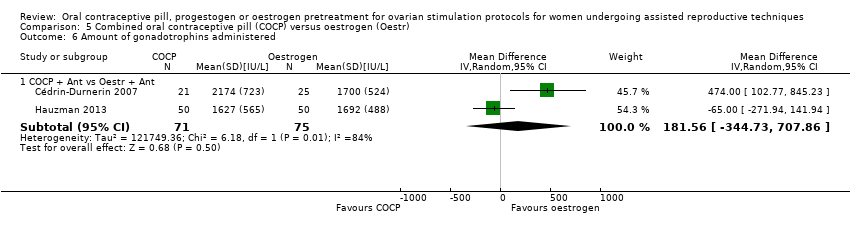
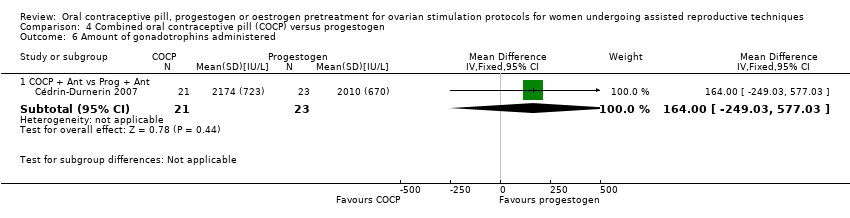
Comparison 5 Combined oral contraceptive pill (COCP) versus oestrogen (Oestr), Outcome 6 Amount of gonadotrophins administered.

Comparison 6 Progestogen (Prog) versus oestrogen (Oestr), Outcome 1 Live birth or ongoing pregnancy.

Comparison 6 Progestogen (Prog) versus oestrogen (Oestr), Outcome 2 Clinical pregnancy rate.

Comparison 6 Progestogen (Prog) versus oestrogen (Oestr), Outcome 3 Number of oocytes retrieved.
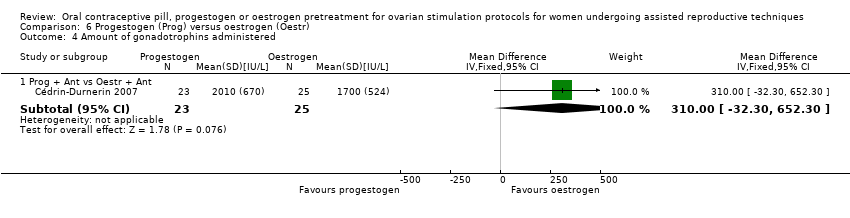
Comparison 6 Progestogen (Prog) versus oestrogen (Oestr), Outcome 4 Amount of gonadotrophins administered.
| Combined oral contraceptive pill compared to no pretreatment for ovarian stimulation protocols for women undergoing assisted reproductive techniques | ||||||
| Population: women undergoing ART Settings: ART clinic Intervention: COCP Comparison: no pretreatment | ||||||
| Outcomes | Illustrative comparative risks* (95% CI) | Relative effect | No of participants | Quality of the evidence | Comments | |
| Assumed risk1 | Corresponding risk | |||||
| No pretreatment | COCP | |||||
| Live birth or ongoing pregnancy (COCP + Ant vs Ant) | 270 per 1000 | 215 per 1000 | OR 0.74 | 1335 | ⊕⊕⊕⊝ | ‐ |
| Live birth or ongoing pregnancy (COCP + Ant vs Ag) | 296 per 1000 | 273 per 1000 | OR 0.89 | 724 | ⊕⊕⊕⊝ | ‐ |
| Pregnancy loss (COCP + Ant vs Ant) | 64 per 1000 | 85 per 1000 | OR 1.36 | 868 | ⊕⊕⊕⊝ | ‐ |
| Pregnancy loss (COCP + Ant vs Ag) | 103 per 1000 | 44 per 1000 | OR 0.40 | 780 | ⊕⊕⊕⊝ | ‐ |
| Multiple pregnancy rate (COCP + Ant vs Ant) | 47 per 1000 | 98 per 1000 | OR 2.21 | 125 | ⊕⊕⊝⊝ | ‐ |
| Multiple pregnancy rate (COCP + Ant vs Ag) | 147 per 1000 | 189 per 1000 | OR 1.36 | 546 | ⊕⊕⊕⊝ | ‐ |
| OHSS rate (COCP + Ant vs Ant) | 16 per 1000 | 16 per 1000 (4 to 52) | OR 0.98 (0.28 to 3.40) | 642 (2 studies) | ⊕⊕⊝⊝ | ‐ |
| OHSS rate (COCP + Ant vs Ag) | 55 per 1000 | 35 per 1000 (11 to 102) | OR 0.63 (0.20 to 1.96) | 290 (2 studies) | ⊕⊕⊝⊝ | ‐ |
| *The basis for the assumed risk (e.g. the median control group risk across studies) is provided in footnotes. The corresponding risk (and its 95% confidence interval) is based on the assumed risk in the comparison group and the relative effect of the intervention (and its 95% CI). | ||||||
| GRADE Working Group grades of evidence | ||||||
| 1 Mean baseline risk of control group. | ||||||
| Progestogen compared to placebo or no pretreatment for ovarian stimulation protocols for women undergoing assisted reproductive techniques | ||||||
| Patient or population: ovarian stimulation protocols for women undergoing ART Settings: Intervention: progestogen Comparison: placebo or no pretreatment | ||||||
| Outcomes | Illustrative comparative risks* (95% CI) | Relative effect | No of participants | Quality of the evidence | Comments | |
| Assumed risk1 | Corresponding risk | |||||
| Placebo or no pretreatment | Prog | |||||
| Live birth or ongoing pregnancy (Prog + Ag vs Ag) | 170 per 1000 | 217 per 1000 | OR 1.35 | 222 | ⊕⊕⊝⊝ | ‐ |
| Live birth or ongoing pregnancy (Prog + Ant vs Ant) | 292 per 1000 | 217 per 1000 | OR 0.67 | 47 | ⊕⊕⊝⊝ | ‐ |
| Pregnancy loss (Prog + Ag vs Ag) | 36 per 1000 | 78 per 1000 | OR 2.26 | 222 | ⊕⊕⊝⊝ | ‐ |
| Pregnancy loss (Prog + Ant vs Ant) | 208 per 1000 | 86 per 1000 | OR 0.36 | 47 | ⊕⊕⊝⊝ | ‐ |
| Multiple pregnancy rate (Prog + Ag vs Ag) | No data available | ‐ | ‐ | |||
| Multiple pregnancy rate (Prog + Ant vs Ant) | 42 per 1000 | 44 per 1000 | OR 1.05 | 47 | ⊕⊕⊝⊝ | ‐ |
| OHSS rate (Prog + Ag vs Ag) | No data available | ‐ | ‐ | |||
| OHSS rate (Prog + Ant vs Ant) | No data available | ‐ | ‐ | |||
| *The basis for the assumed risk (e.g. the median control group risk across studies) is provided in footnotes. The corresponding risk (and its 95% confidence interval) is based on the assumed risk in the comparison group and the relative effect of the intervention (and its 95% CI). | ||||||
| GRADE Working Group grades of evidence | ||||||
| 1 Mean baseline risk of control group. | ||||||
| Oestrogencompared to no pretreatment for ovarian stimulation protocols for women undergoing assisted reproductive techniques | ||||||
| Patient or population: ovarian stimulation protocols for women undergoing ART Settings: Intervention: oestrogen Comparison: no pretreatment | ||||||
| Outcomes | Illustrative comparative risks* (95% CI) | Relative effect | No of Participants | Quality of the evidence | Comments | |
| Assumed risk1 | Corresponding risk | |||||
| No pretreatment | Oestr | |||||
| Live birth or ongoing pregnancy (Oestr + Ant vs Ant) | 299 per 1000 | 252 per 1000 | OR 0.79 | 502 | ⊕⊕⊕⊝ | ‐ |
| Live birth or ongoing pregnancy (Oestr + Ant vs Ag) | 350 per 1000 | 322 per 1000 | OR 0.88 | 242 | ⊕⊝⊝⊝ | ‐ |
| Pregnancy loss (Oestr + Ant vs Ant) | 208 per 1000 | 40 per 1000 | OR 0.16 | 49 | ⊕⊝⊝⊝ | ‐ |
| Pregnancy loss (Oestr + Ant vs Ag) | 72 per 1000 | 110 per 1000 | OR 1.59 | 220 | ⊕⊝⊝⊝ | ‐ |
| Multiple pregnancy rate (Oestr + Ant vs Ant) | No data available | ‐ | ‐ | |||
| Multiple pregnancy rate (Oestr + Ant vs Ag) | Not calculable ‐ see comment | OR 2.24 | 22 | ⊕⊝⊝⊝ | Only 2 events (both in oestrogen group) | |
| OHSS rate (Oestr + Ant vs Ant) | No data available | ‐ | ‐ | |||
| OHSS rate (Oestr + Ant vs Ag) | 18 per 1000 | 27 per 1000 (5 to 147) | OR 1.54 (0.25 to 9.42) | 220 (1 study) | ⊕⊝⊝⊝ | ‐ |
| *The basis for the assumed risk (e.g. the median control group risk across studies) is provided in footnotes. The corresponding risk (and its 95% confidence interval) is based on the assumed risk in the comparison group and the relative effect of the intervention (and its 95% CI). | ||||||
| GRADE Working Group grades of evidence | ||||||
| 1 Mean baseline risk of control group. | ||||||
| Outcome or subgroup title | No. of studies | No. of participants | Statistical method | Effect size |
| 1 Live birth or ongoing pregnancy Show forest plot | 8 | Odds Ratio (M‐H, Fixed, 95% CI) | Subtotals only | |
| 1.1 COCP + antagonist (Ant) vs Ant | 6 | 1335 | Odds Ratio (M‐H, Fixed, 95% CI) | 0.74 [0.58, 0.95] |
| 1.2 COCP + Ant vs agonist (Ag) | 4 | 724 | Odds Ratio (M‐H, Fixed, 95% CI) | 0.89 [0.64, 1.25] |
| 1.3 COCP + Ant vs Ant, low response | 1 | 80 | Odds Ratio (M‐H, Fixed, 95% CI) | 1.71 [0.61, 4.79] |
| 1.4 COCP + Ant vs Ag, low response | 1 | 80 | Odds Ratio (M‐H, Fixed, 95% CI) | 1.13 [0.43, 2.98] |
| 2 Pregnancy loss Show forest plot | 8 | Odds Ratio (M‐H, Fixed, 95% CI) | Subtotals only | |
| 2.1 COCP + Ant vs Ant | 5 | 868 | Odds Ratio (M‐H, Fixed, 95% CI) | 1.36 [0.82, 2.26] |
| 2.2 COCP + Ant vs Ag | 5 | 780 | Odds Ratio (M‐H, Fixed, 95% CI) | 0.40 [0.22, 0.72] |
| 2.3 COCP + Ant vs Ant, low response | 1 | 80 | Odds Ratio (M‐H, Fixed, 95% CI) | 2.05 [0.18, 23.59] |
| 2.4 COCP + Ant vs Ag, low response | 1 | 80 | Odds Ratio (M‐H, Fixed, 95% CI) | 1.0 [0.13, 7.47] |
| 3 Clinical pregnancy rate Show forest plot | 8 | Odds Ratio (M‐H, Fixed, 95% CI) | Subtotals only | |
| 3.1 COCP + Ant vs Ant | 5 | 740 | Odds Ratio (M‐H, Fixed, 95% CI) | 0.85 [0.63, 1.15] |
| 3.2 COCP + Ant vs Ag | 4 | 546 | Odds Ratio (M‐H, Fixed, 95% CI) | 0.84 [0.59, 1.20] |
| 3.3 COCP + Ant vs Ant, low response | 1 | 80 | Odds Ratio (M‐H, Fixed, 95% CI) | 1.85 [0.69, 4.97] |
| 3.4 COCP + Ant vs Ag, low response | 1 | 80 | Odds Ratio (M‐H, Fixed, 95% CI) | 1.12 [0.44, 2.83] |
| 4 Multiple pregnancy rate Show forest plot | 5 | Odds Ratio (M‐H, Fixed, 95% CI) | Subtotals only | |
| 4.1 COCP + Ant vs Ant | 2 | 125 | Odds Ratio (M‐H, Fixed, 95% CI) | 2.21 [0.53, 9.26] |
| 4.2 COCP + Ant vs Ag | 4 | 546 | Odds Ratio (M‐H, Fixed, 95% CI) | 1.36 [0.85, 2.19] |
| 4.3 COCP + Ant vs Ant, low response | 1 | 80 | Odds Ratio (M‐H, Fixed, 95% CI) | 2.11 [0.36, 12.24] |
| 4.4 COCP + Ant vs Ag, low response | 1 | 80 | Odds Ratio (M‐H, Fixed, 95% CI) | 1.37 [0.29, 6.56] |
| 5 Ovarian hyperstimulation syndrome rate Show forest plot | 3 | Odds Ratio (M‐H, Fixed, 95% CI) | Subtotals only | |
| 5.1 COCP + Ant vs Ant | 2 | 642 | Odds Ratio (M‐H, Fixed, 95% CI) | 0.98 [0.28, 3.40] |
| 5.2 COCP + Ant vs Ag | 2 | 290 | Odds Ratio (M‐H, Fixed, 95% CI) | 0.63 [0.20, 1.96] |
| 6 Number of oocytes retrieved Show forest plot | 8 | Mean Difference (IV, Fixed, 95% CI) | Subtotals only | |
| 7 Days of gonadotrophin treatment Show forest plot | 8 | Mean Difference (IV, Fixed, 95% CI) | Totals not selected | |
| 7.1 COCP + Ant vs Ant | 6 | Mean Difference (IV, Fixed, 95% CI) | 0.0 [0.0, 0.0] | |
| 7.2 COCP + Ant vs Ag | 4 | Mean Difference (IV, Fixed, 95% CI) | 0.0 [0.0, 0.0] | |
| 7.3 COCP + Ant vs Ant, low response | 1 | Mean Difference (IV, Fixed, 95% CI) | 0.0 [0.0, 0.0] | |
| 7.4 COCP + Ant vs Ag, low response | 1 | Mean Difference (IV, Fixed, 95% CI) | 0.0 [0.0, 0.0] | |
| 8 Amount of gonadotrophins administered Show forest plot | 8 | Mean Difference (IV, Fixed, 95% CI) | Subtotals only | |
| 8.1 COCP + Ant vs Ant | 7 | 1275 | Mean Difference (IV, Fixed, 95% CI) | 190.10 [134.91, 245.28] |
| 8.2 COCP + Ant vs Ag | 3 | 496 | Mean Difference (IV, Fixed, 95% CI) | 9.96 [‐104.09, 124.02] |
| 8.3 COCP + Ant vs Ant, low response | 1 | 80 | Mean Difference (IV, Fixed, 95% CI) | 20.0 [‐165.39, 205.39] |
| 8.4 COCP + Ant vs Ag, low response | 1 | 80 | Mean Difference (IV, Fixed, 95% CI) | ‐349.0 [‐537.92, ‐160.08] |
| 9 Ovarian cyst formation rate Show forest plot | 1 | Odds Ratio (M‐H, Fixed, 95% CI) | Subtotals only | |
| 9.1 COCP + Ant vs Ant | 1 | 64 | Odds Ratio (M‐H, Fixed, 95% CI) | 0.47 [0.08, 2.75] |
| Outcome or subgroup title | No. of studies | No. of participants | Statistical method | Effect size |
| 1 Live birth or ongoing pregnancy Show forest plot | 4 | Odds Ratio (M‐H, Fixed, 95% CI) | Subtotals only | |
| 1.1 Progestogen (Prog) + agonist (Ag) vs Ag | 2 | 222 | Odds Ratio (M‐H, Fixed, 95% CI) | 1.35 [0.69, 2.65] |
| 1.2 Prog + antagonist (Ant) vs Ant | 1 | 47 | Odds Ratio (M‐H, Fixed, 95% CI) | 0.67 [0.18, 2.54] |
| 1.3 Prog + gonadotrophin (Gon) vs Gon | 1 | 42 | Odds Ratio (M‐H, Fixed, 95% CI) | 0.63 [0.09, 4.23] |
| 2 Pregnancy loss Show forest plot | 4 | Odds Ratio (M‐H, Fixed, 95% CI) | Subtotals only | |
| 2.1 Prog + Ag vs Ag | 2 | 222 | Odds Ratio (M‐H, Fixed, 95% CI) | 2.26 [0.67, 7.55] |
| 2.2 Prog + Ant vs Ant | 1 | 47 | Odds Ratio (M‐H, Fixed, 95% CI) | 0.36 [0.06, 2.09] |
| 2.3 Prog + Gon vs Gon | 1 | 42 | Odds Ratio (M‐H, Fixed, 95% CI) | 1.0 [0.06, 17.12] |
| 3 Clinical pregnancy rate Show forest plot | 5 | Odds Ratio (M‐H, Fixed, 95% CI) | Subtotals only | |
| 3.1 Prog + Ag vs Ag | 3 | 374 | Odds Ratio (M‐H, Fixed, 95% CI) | 1.99 [1.20, 3.28] |
| 3.2 Prog + Ant vs Ant | 1 | 47 | Odds Ratio (M‐H, Fixed, 95% CI) | 0.52 [0.16, 1.71] |
| 3.3 Prog + Gon vs Gon | 1 | 42 | Odds Ratio (M‐H, Fixed, 95% CI) | 0.71 [0.14, 3.64] |
| 4 Multiple pregnancy rate Show forest plot | 1 | Odds Ratio (M‐H, Fixed, 95% CI) | Subtotals only | |
| 4.1 Prog + Ant vs Ant | 1 | 47 | Odds Ratio (M‐H, Fixed, 95% CI) | 1.05 [0.06, 17.76] |
| 5 Number of oocytes retrieved Show forest plot | 4 | Mean Difference (IV, Fixed, 95% CI) | Subtotals only | |
| 5.1 Prog + Ag vs Ag | 2 | 222 | Mean Difference (IV, Fixed, 95% CI) | ‐0.52 [‐2.07, 1.02] |
| 5.2 Prog + Ant vs Ant | 1 | 47 | Mean Difference (IV, Fixed, 95% CI) | 2.70 [‐0.98, 6.38] |
| 5.3 Prog + Gon vs Gon | 1 | 29 | Mean Difference (IV, Fixed, 95% CI) | 0.0 [‐0.57, 0.57] |
| 6 Days of gonadotrophin treatment Show forest plot | 2 | Mean Difference (IV, Fixed, 95% CI) | Subtotals only | |
| 6.1 Prog + Ag vs Ag | 2 | 222 | Mean Difference (IV, Fixed, 95% CI) | 0.11 [‐0.30, 0.52] |
| 7 Amount of gonadotrophins administered Show forest plot | 1 | Mean Difference (IV, Fixed, 95% CI) | Subtotals only | |
| 7.1 Prog + Ant vs Ant | 1 | 47 | Mean Difference (IV, Fixed, 95% CI) | 276.0 [‐75.53, 627.53] |
| 8 Ovarian cyst formation rate Show forest plot | 3 | Odds Ratio (M‐H, Fixed, 95% CI) | Subtotals only | |
| 8.1 Prog + Ag vs Ag | 3 | 374 | Odds Ratio (M‐H, Fixed, 95% CI) | 0.16 [0.08, 0.32] |
| Outcome or subgroup title | No. of studies | No. of participants | Statistical method | Effect size |
| 1 Live birth or ongoing pregnancy Show forest plot | 4 | Odds Ratio (M‐H, Fixed, 95% CI) | Subtotals only | |
| 1.1 Oestrogen (Oestr) + antagonist (Ant) vs Ant | 2 | 502 | Odds Ratio (M‐H, Fixed, 95% CI) | 0.79 [0.53, 1.17] |
| 1.2 Oestr + Ant vs agonist (Ag) | 2 | 242 | Odds Ratio (M‐H, Fixed, 95% CI) | 0.88 [0.51, 1.50] |
| 2 Pregnancy loss Show forest plot | 2 | Odds Ratio (M‐H, Fixed, 95% CI) | Subtotals only | |
| 2.1 Oestr + Ant vs Ant | 1 | 49 | Odds Ratio (M‐H, Fixed, 95% CI) | 0.16 [0.02, 1.47] |
| 2.2 Oestr + Ant vs Ag | 1 | 220 | Odds Ratio (M‐H, Fixed, 95% CI) | 1.59 [0.62, 4.06] |
| 3 Clinical pregnancy rate Show forest plot | 6 | Odds Ratio (M‐H, Fixed, 95% CI) | Subtotals only | |
| 3.1 Oestr + Ant vs Ant | 4 | 688 | Odds Ratio (M‐H, Fixed, 95% CI) | 0.91 [0.66, 1.24] |
| 3.2 Oestr + Ant vs Ag | 2 | 242 | Odds Ratio (M‐H, Fixed, 95% CI) | 0.76 [0.45, 1.27] |
| 4 Multiple pregnancies Show forest plot | 1 | Odds Ratio (M‐H, Fixed, 95% CI) | Subtotals only | |
| 4.1 Oestr + Ant vs Ag | 1 | 22 | Odds Ratio (M‐H, Fixed, 95% CI) | 2.24 [0.09, 53.59] |
| 5 Ovarian hyperstimulation syndrome rate Show forest plot | 1 | Odds Ratio (M‐H, Fixed, 95% CI) | Subtotals only | |
| 5.1 Oestr + Ant vs Ag | 1 | 220 | Odds Ratio (M‐H, Fixed, 95% CI) | 1.54 [0.25, 9.42] |
| 6 Number of oocytes retrieved Show forest plot | 3 | Mean Difference (IV, Fixed, 95% CI) | Subtotals only | |
| 6.1 Oestr + Ant vs Ant | 2 | 139 | Mean Difference (IV, Fixed, 95% CI) | 2.23 [0.71, 3.75] |
| 6.2 Oestr + Ant vs Ag | 1 | 22 | Mean Difference (IV, Fixed, 95% CI) | 0.40 [‐4.47, 5.27] |
| 7 Days of gonadotrophin treatment Show forest plot | 3 | Mean Difference (IV, Fixed, 95% CI) | Subtotals only | |
| 7.1 Oestr + Ant vs Ant | 2 | 529 | Mean Difference (IV, Fixed, 95% CI) | 0.83 [0.58, 1.08] |
| 7.2 Oestr + Ant vs Ag | 1 | 22 | Mean Difference (IV, Fixed, 95% CI) | ‐2.5 [‐4.07, ‐0.93] |
| 8 Amount of gonadotrophins administered Show forest plot | 5 | Mean Difference (IV, Fixed, 95% CI) | Subtotals only | |
| 8.1 Oestr + Ant vs Ant | 4 | 668 | Mean Difference (IV, Fixed, 95% CI) | 168.35 [111.53, 225.17] |
| 8.2 Oestr + Ant vs Ag | 1 | 22 | Mean Difference (IV, Fixed, 95% CI) | ‐16.0 [‐470.12, 438.12] |
| Outcome or subgroup title | No. of studies | No. of participants | Statistical method | Effect size |
| 1 Live birth or ongoing pregnancy Show forest plot | 1 | Odds Ratio (M‐H, Fixed, 95% CI) | Subtotals only | |
| 1.1 COCP + antagonist (Ant) vs progestogen (Prog) + Ant | 1 | 44 | Odds Ratio (M‐H, Fixed, 95% CI) | 0.6 [0.12, 2.89] |
| 2 Pregnancy loss Show forest plot | 1 | Odds Ratio (M‐H, Fixed, 95% CI) | Subtotals only | |
| 2.1 COCP + Ant vs Prog + Ant | 1 | 44 | Odds Ratio (M‐H, Fixed, 95% CI) | 1.11 [0.14, 8.64] |
| 3 Clinical pregnancy rate Show forest plot | 1 | Odds Ratio (M‐H, Fixed, 95% CI) | Subtotals only | |
| 3.1 COCP + Ant vs Prog + Ant | 1 | 44 | Odds Ratio (M‐H, Fixed, 95% CI) | 0.71 [0.19, 2.73] |
| 4 Multiple pregnancy rate Show forest plot | 1 | Odds Ratio (M‐H, Fixed, 95% CI) | Subtotals only | |
| 4.1 COCP + Ant vs Prog + Ant | 1 | 44 | Odds Ratio (M‐H, Fixed, 95% CI) | 2.32 [0.19, 27.59] |
| 5 Number of oocytes retrieved Show forest plot | 1 | Mean Difference (IV, Fixed, 95% CI) | Subtotals only | |
| 5.1 COCP + Ant vs Prog + Ant | 1 | 44 | Mean Difference (IV, Fixed, 95% CI) | 1.40 [‐3.24, 6.04] |
| 6 Amount of gonadotrophins administered Show forest plot | 1 | Mean Difference (IV, Fixed, 95% CI) | Subtotals only | |
| 6.1 COCP + Ant vs Prog + Ant | 1 | 44 | Mean Difference (IV, Fixed, 95% CI) | 164.0 [‐249.03, 577.03] |
| Outcome or subgroup title | No. of studies | No. of participants | Statistical method | Effect size |
| 1 Live birth or ongoing pregnancy Show forest plot | 3 | Odds Ratio (M‐H, Fixed, 95% CI) | Subtotals only | |
| 1.1 COCP + antagonist (Ant) vs Oestr + Ant | 2 | 146 | Odds Ratio (M‐H, Fixed, 95% CI) | 1.11 [0.54, 2.29] |
| 1.2 COCP + agonist (Ag) vs Oestr + Ant | 1 | 25 | Odds Ratio (M‐H, Fixed, 95% CI) | 0.08 [0.01, 0.79] |
| 2 Pregnancy loss Show forest plot | 1 | Odds Ratio (M‐H, Fixed, 95% CI) | Subtotals only | |
| 2.1 COCP + Ag vs Oestr + Ant | 1 | 25 | Odds Ratio (M‐H, Fixed, 95% CI) | 1.09 [0.06, 19.63] |
| 3 Clinical pregnancy rate Show forest plot | 3 | Odds Ratio (M‐H, Fixed, 95% CI) | Subtotals only | |
| 3.1 COCP + Ant vs Oestr + Ant | 2 | 146 | Odds Ratio (M‐H, Fixed, 95% CI) | 1.19 [0.60, 2.37] |
| 3.2 COCP + Ag vs Oestr + Ant | 1 | 25 | Odds Ratio (M‐H, Fixed, 95% CI) | 0.13 [0.02, 0.82] |
| 4 Number of oocytes retrieved Show forest plot | 1 | Mean Difference (IV, Fixed, 95% CI) | Subtotals only | |
| 4.1 COCP + Ant vs Oestr + Ant | 1 | 46 | Mean Difference (IV, Fixed, 95% CI) | 0.90 [‐3.59, 5.39] |
| 5 Days of gonadotropin treatment Show forest plot | 1 | Mean Difference (IV, Fixed, 95% CI) | Subtotals only | |
| 5.1 COCP + Ant vs Oestr + Ant | 1 | 100 | Mean Difference (IV, Fixed, 95% CI) | ‐0.60 [‐1.23, 0.03] |
| 6 Amount of gonadotrophins administered Show forest plot | 2 | Mean Difference (IV, Random, 95% CI) | Subtotals only | |
| 6.1 COCP + Ant vs Oestr + Ant | 2 | 146 | Mean Difference (IV, Random, 95% CI) | 181.56 [‐344.73, 707.86] |
| Outcome or subgroup title | No. of studies | No. of participants | Statistical method | Effect size |
| 1 Live birth or ongoing pregnancy Show forest plot | 1 | Odds Ratio (M‐H, Fixed, 95% CI) | Subtotals only | |
| 1.1 Prog + antagonist (Ant) vs Oestr + Ant | 1 | 48 | Odds Ratio (M‐H, Fixed, 95% CI) | 2.04 [0.43, 9.70] |
| 2 Clinical pregnancy rate Show forest plot | 1 | Odds Ratio (M‐H, Fixed, 95% CI) | Subtotals only | |
| 2.1 Prog + Ant vs Oestr + Ant | 1 | 48 | Odds Ratio (M‐H, Fixed, 95% CI) | 2.30 [0.57, 9.22] |
| 3 Number of oocytes retrieved Show forest plot | 1 | Mean Difference (IV, Fixed, 95% CI) | Subtotals only | |
| 3.1 Prog + Ant vs Oestr + Ant | 1 | 48 | Mean Difference (IV, Fixed, 95% CI) | ‐0.5 [‐4.55, 3.55] |
| 4 Amount of gonadotrophins administered Show forest plot | 1 | Mean Difference (IV, Fixed, 95% CI) | Subtotals only | |
| 4.1 Prog + Ant vs Oestr + Ant | 1 | 48 | Mean Difference (IV, Fixed, 95% CI) | 310.0 [‐32.30, 652.30] |