Scolaris Content Display Scolaris Content Display

Comparison 1 Upper limb function: post treatment, Outcome 1 Arm function.
Figuras y tablas -
Analysis 1.1

Comparison 1 Upper limb function: post treatment, Outcome 1 Arm function.

Comparison 1 Upper limb function: post treatment, Outcome 2 Hand function.
Figuras y tablas -
Analysis 1.2

Comparison 1 Upper limb function: post treatment, Outcome 2 Hand function.

Comparison 1 Upper limb function: post treatment, Outcome 3 Sitting balance/reach.
Figuras y tablas -
Analysis 1.3

Comparison 1 Upper limb function: post treatment, Outcome 3 Sitting balance/reach.

Comparison 2 Upper limb function: follow up, Outcome 1 All outcomes.
Figuras y tablas -
Analysis 2.1

Comparison 2 Upper limb function: follow up, Outcome 1 All outcomes.

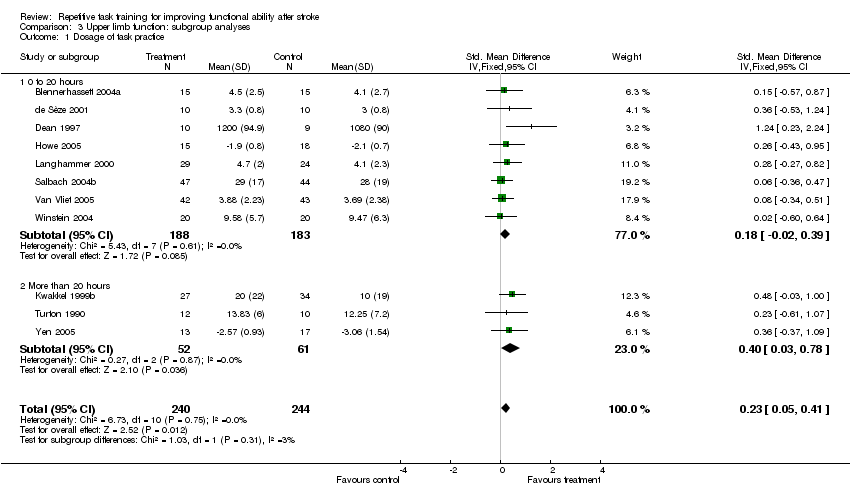
Comparison 3 Upper limb function: subgroup analyses, Outcome 1 Dosage of task practice.
Figuras y tablas -
Analysis 3.1

Comparison 3 Upper limb function: subgroup analyses, Outcome 1 Dosage of task practice.

Comparison 3 Upper limb function: subgroup analyses, Outcome 2 Time since stroke.
Figuras y tablas -
Analysis 3.2

Comparison 3 Upper limb function: subgroup analyses, Outcome 2 Time since stroke.

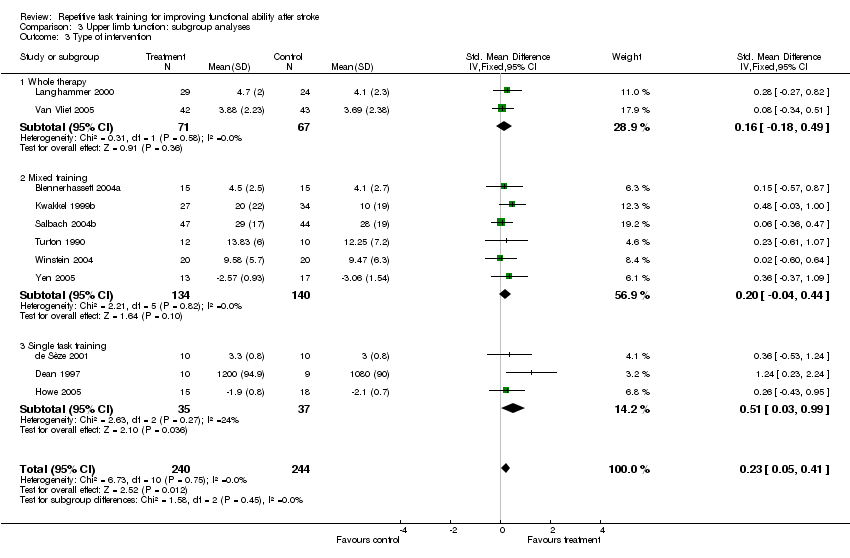
Comparison 3 Upper limb function: subgroup analyses, Outcome 3 Type of intervention.
Figuras y tablas -
Analysis 3.3

Comparison 3 Upper limb function: subgroup analyses, Outcome 3 Type of intervention.

Comparison 4 Lower limb function: post treatment, Outcome 1 Walking distance: change from baseline.
Figuras y tablas -
Analysis 4.1

Comparison 4 Lower limb function: post treatment, Outcome 1 Walking distance: change from baseline.

Comparison 4 Lower limb function: post treatment, Outcome 2 Walking speed.
Figuras y tablas -
Analysis 4.2

Comparison 4 Lower limb function: post treatment, Outcome 2 Walking speed.

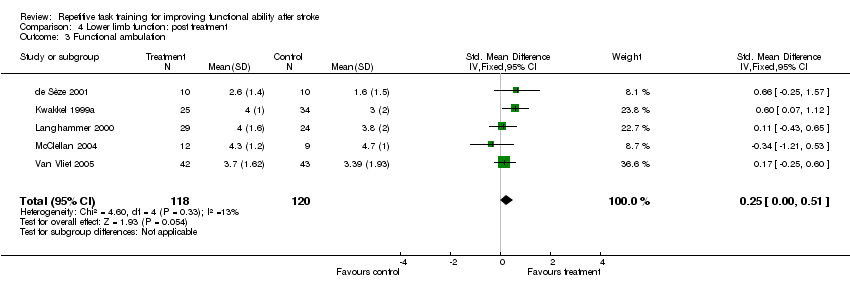
Comparison 4 Lower limb function: post treatment, Outcome 3 Functional ambulation.
Figuras y tablas -
Analysis 4.3

Comparison 4 Lower limb function: post treatment, Outcome 3 Functional ambulation.

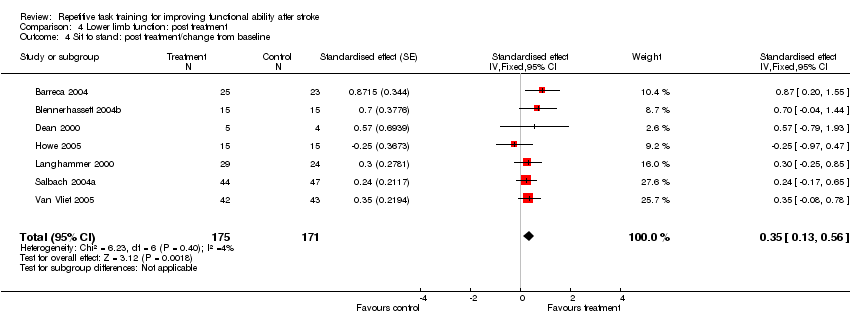
Comparison 4 Lower limb function: post treatment, Outcome 4 Sit to stand: post treatment/change from baseline.
Figuras y tablas -
Analysis 4.4

Comparison 4 Lower limb function: post treatment, Outcome 4 Sit to stand: post treatment/change from baseline.

Comparison 4 Lower limb function: post treatment, Outcome 5 Lower limb functional measures.
Figuras y tablas -
Analysis 4.5

Comparison 4 Lower limb function: post treatment, Outcome 5 Lower limb functional measures.

Comparison 4 Lower limb function: post treatment, Outcome 6 Standing balance/reach.
Figuras y tablas -
Analysis 4.6

Comparison 4 Lower limb function: post treatment, Outcome 6 Standing balance/reach.

Comparison 5 Lower limb function: follow up, Outcome 1 All outcomes.
Figuras y tablas -
Analysis 5.1

Comparison 5 Lower limb function: follow up, Outcome 1 All outcomes.

Comparison 6 Lower limb function: subgroup analyses, Outcome 1 Dosage of task practice.
Figuras y tablas -
Analysis 6.1

Comparison 6 Lower limb function: subgroup analyses, Outcome 1 Dosage of task practice.

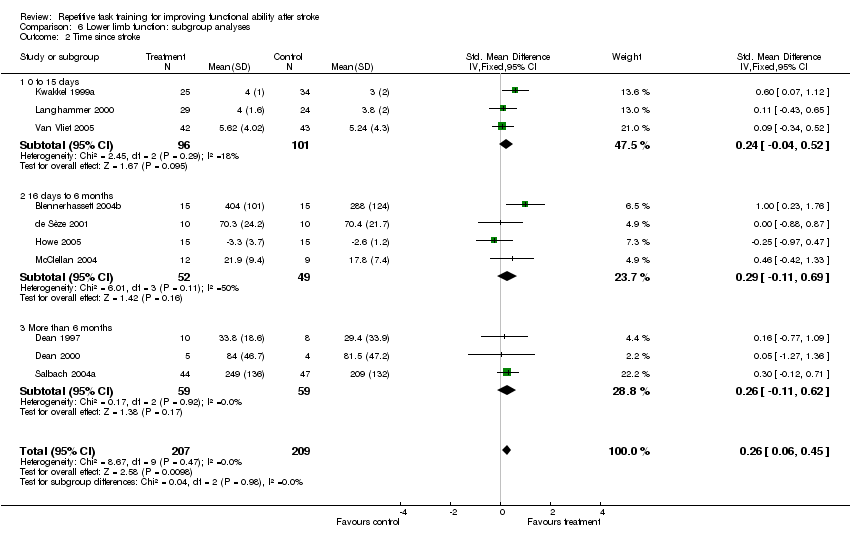
Comparison 6 Lower limb function: subgroup analyses, Outcome 2 Time since stroke.
Figuras y tablas -
Analysis 6.2

Comparison 6 Lower limb function: subgroup analyses, Outcome 2 Time since stroke.

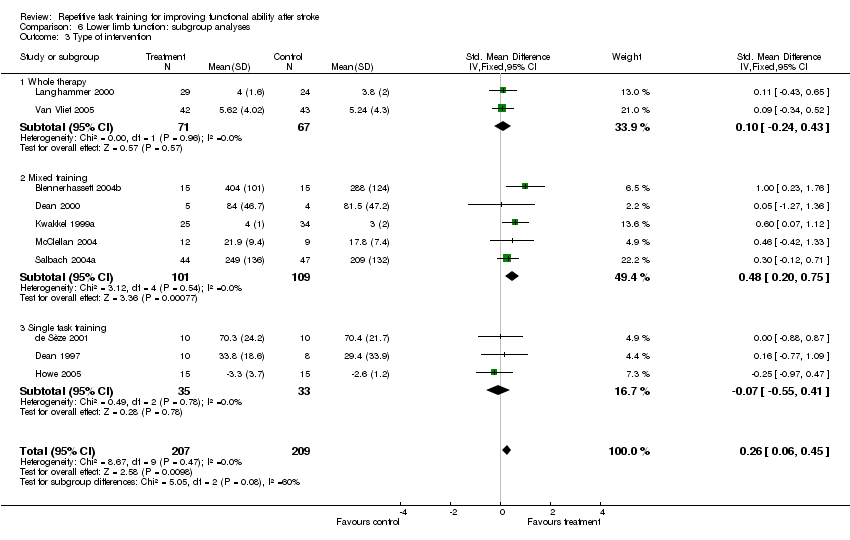
Comparison 6 Lower limb function: subgroup analyses, Outcome 3 Type of intervention.
Figuras y tablas -
Analysis 6.3

Comparison 6 Lower limb function: subgroup analyses, Outcome 3 Type of intervention.

Comparison 7 Global motor function, Outcome 1 Global motor function scales.
Figuras y tablas -
Analysis 7.1

Comparison 7 Global motor function, Outcome 1 Global motor function scales.

Comparison 8 Secondary outcomes, Outcome 1 Activities of daily living function.
Figuras y tablas -
Analysis 8.1

Comparison 8 Secondary outcomes, Outcome 1 Activities of daily living function.

Comparison 8 Secondary outcomes, Outcome 2 Upper limb impairment.
Figuras y tablas -
Analysis 8.2

Comparison 8 Secondary outcomes, Outcome 2 Upper limb impairment.

Comparison 8 Secondary outcomes, Outcome 3 Lower limb impairment.
Figuras y tablas -
Analysis 8.3

Comparison 8 Secondary outcomes, Outcome 3 Lower limb impairment.

Comparison 8 Secondary outcomes, Outcome 4 Quality of life/health status.
Figuras y tablas -
Analysis 8.4

Comparison 8 Secondary outcomes, Outcome 4 Quality of life/health status.

Comparison 9 Sensitivity analyses, Outcome 1 Allocation concealment.
Figuras y tablas -
Analysis 9.1

Comparison 9 Sensitivity analyses, Outcome 1 Allocation concealment.

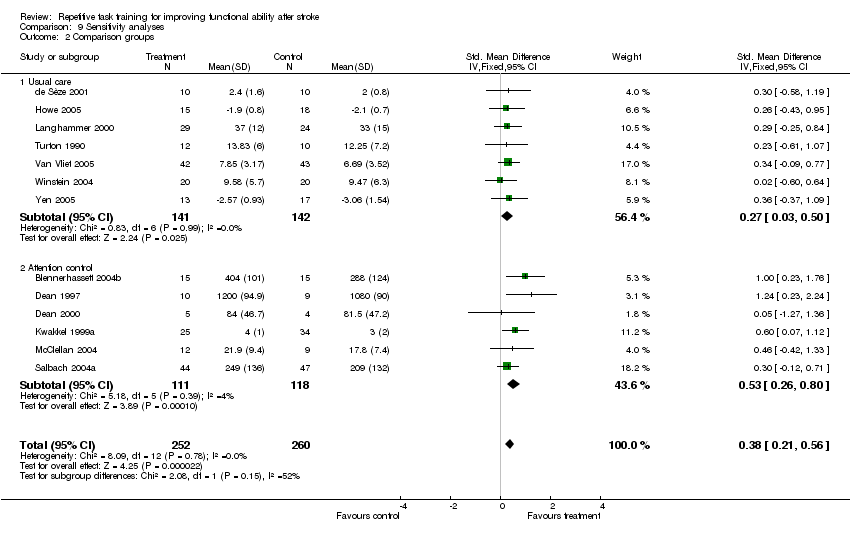
Comparison 9 Sensitivity analyses, Outcome 2 Comparison groups.
Figuras y tablas -
Analysis 9.2

Comparison 9 Sensitivity analyses, Outcome 2 Comparison groups.

Comparison 9 Sensitivity analyses, Outcome 3 Equivalence of therapy time.
Figuras y tablas -
Analysis 9.3

Comparison 9 Sensitivity analyses, Outcome 3 Equivalence of therapy time.

Table 1. Criteria for subgroup and sensitivity analyses

STUDY

Task practice dose

Time since stroke

Type of intervention

Practice intensity

Allocation conceal

Comparison group

Therapy equivalence

Small trials

1 = 20 hours or less

2 = more than 20 hours

1 = 1 to 14 days

2 = 15 days to 6 months

3 = more than 6 months

1 = whole therapy

2 = mixed task

3 = single task

1 = 1 to 4 weeks or less

2 = more than 4 weeks

A = adequate

B = inadequate/unclear

AC = attention control

UC = usual care

EQ = equivalent therapy time

ADD = additional therapy time

1 = less than 25 participants

2 = 25 or more participants

Blennerhassett 2004

1

2

2

1

A

AC

EQ

2

Dean 1997

1

3

3

1

B

AC

EQ

1

Dean 2000

1

3

2

1

A

AC

EQ

1

De Sèze 2001

1

2

3

1

B

UC

EQ

2

Howe 2005

1

2

3

1

A

UC

EQ

2

Kwakkel 1999

2

1

2

2

A

AC

EQ

2

Langhammer 2000

1

1

1

1

B

UC

EQ

2

McClellan 2004

2

3

2

2

A

AC

EQ

2

Salbach 2004

1

3

2

2

A

AC

EQ

2

Turton 1990

2

2

2

2

B

UC

ADD

1

Van Vliet 2005

1

1

1

1

A

UC

EQ

2

Winstein 2004

1

1

2

1

A

UC

ADD

2

Yen 2005

2

3

2

1

B

UC

EQ

2

Figuras y tablas -
Table 1. Criteria for subgroup and sensitivity analyses
Table 2. Outcome measures used from the included trials

Author and year

Global function

Lower limb function

Balance/sit to stand

Upper limb function

Hand function

ADL function

Impairment

QOL, health status

Adverse events

Barreca 2004

Number able to stand

Dartmouth COOP

Falls

Blennerhassett 2004

6 Minute Walk Test, Step Test

Timed Up & Go Test

Motor Assessment Scale arm

Motor Assessment Scale hand

Dean 1997

10 Metre Walk Speed

Reaching distance

Dean 2000

6 Minute Walk Test, 10 Metre Walk Speed, Step Test

De Seze 2001

Functional Ambulation Classification

Sitting and Standing Equilibrium Index

Functional Independence Measure

Trunk Control Test

Howe 2005

Lateral reach ‐ time, sit to stand ‐ time

Kwakkel 1999

Functional Ambulation Classification

Action Research Arm Test

Barthel Index

Nottingham Health Profile

Langhammer 2000

Motor Assessment Scale

Motor Assessment Scale walking, Sodring Motor Evaluation Scale trunk, balance and gait

Motor Assessment Scale balanced sitting, Motor Assessment Scale sit to stand

Motor Assessment Scale arm

Motor Assessment Scale hand

Barthel Index

Sodring Motor Evaluation Scale leg subscale, Sodring Motor Evaluation Scale arm subscale

Nottingham Health Profile

McClellan 2004

Motor Assessment Scale walking

Functional Reach

Salbach 2004, Higgins 2006

6 Minute Walk Test, 5 Metre Walk Speed

Timed Up & Go Test, Berg Balance

Box & Block Test

9 Hole Peg Test

Barthel Index

Turton 1990

Southern Motor Group Assessment ‐ upper extremity

10 Hole Peg Test

Van Vliet 2005

Rivermead Motor Assessment Gross Function

Rivermead Motor Assessment leg and trunk, 6 Minute Walk Test, Motor Assessment Scale walking, Rivermead Motor Assessment leg and trunk

Motor Assessment Scale balanced sitting, Motor Assessment Scale sit to stand

Motor Assessment Scale arm

Motor Assessment Scale hand

Barthel Index

Winstein 2004

Functional Test of the Hemiparetic Upper Extremity

Fugl Meyer Assessment

Yen 2005

Wolf Motor Function Test

Figuras y tablas -
Table 2. Outcome measures used from the included trials
Comparison 1. Upper limb function: post treatment

Outcome or subgroup title

No. of studies

No. of participants

Statistical method

Effect size

1 Arm function Show forest plot

8

412

Std. Mean Difference (IV, Fixed, 95% CI)

0.17 [‐0.03, 0.36]

2 Hand function Show forest plot

5

281

Std. Mean Difference (IV, Fixed, 95% CI)

0.16 [‐0.07, 0.40]

3 Sitting balance/reach Show forest plot

5

210

Std. Mean Difference (IV, Fixed, 95% CI)

0.23 [‐0.05, 0.50]

Figuras y tablas -
Comparison 1. Upper limb function: post treatment
Comparison 2. Upper limb function: follow up

Outcome or subgroup title

No. of studies

No. of participants

Statistical method

Effect size

1 All outcomes Show forest plot

6

246

Std. Mean Difference (IV, Fixed, 95% CI)

0.08 [‐0.17, 0.33]

1.1 Under 6 months post treatment

2

51

Std. Mean Difference (IV, Fixed, 95% CI)

0.50 [‐0.06, 1.06]

1.2 6 to 12 months post treatment

4

195

Std. Mean Difference (IV, Fixed, 95% CI)

‐0.02 [‐0.31, 0.26]

Figuras y tablas -
Comparison 2. Upper limb function: follow up
Comparison 3. Upper limb function: subgroup analyses

Outcome or subgroup title

No. of studies

No. of participants

Statistical method

Effect size

1 Dosage of task practice Show forest plot

11

484

Std. Mean Difference (IV, Fixed, 95% CI)

0.23 [0.05, 0.41]

1.1 0 to 20 hours

8

371

Std. Mean Difference (IV, Fixed, 95% CI)

0.18 [‐0.02, 0.39]

1.2 More than 20 hours

3

113

Std. Mean Difference (IV, Fixed, 95% CI)

0.40 [0.03, 0.78]

2 Time since stroke Show forest plot

11

484

Std. Mean Difference (IV, Fixed, 95% CI)

0.23 [0.05, 0.41]

2.1 0 to 15 days

4

239

Std. Mean Difference (IV, Fixed, 95% CI)

0.21 [‐0.04, 0.47]

2.2 16 days to 6 months

4

105

Std. Mean Difference (IV, Fixed, 95% CI)

0.24 [‐0.14, 0.63]

2.3 More than 6 months

3

140

Std. Mean Difference (IV, Fixed, 95% CI)

0.25 [‐0.08, 0.59]

3 Type of intervention Show forest plot

11

484

Std. Mean Difference (IV, Fixed, 95% CI)

0.23 [0.05, 0.41]

3.1 Whole therapy

2

138

Std. Mean Difference (IV, Fixed, 95% CI)

0.16 [‐0.18, 0.49]

3.2 Mixed training

6

274

Std. Mean Difference (IV, Fixed, 95% CI)

0.20 [‐0.04, 0.44]

3.3 Single task training

3

72

Std. Mean Difference (IV, Fixed, 95% CI)

0.51 [0.03, 0.99]

Figuras y tablas -
Comparison 3. Upper limb function: subgroup analyses
Comparison 4. Lower limb function: post treatment

Outcome or subgroup title

No. of studies

No. of participants

Statistical method

Effect size

1 Walking distance: change from baseline Show forest plot

3

130

Mean Difference (IV, Random, 95% CI)

54.59 [17.50, 91.68]

2 Walking speed Show forest plot

5

263

Std. Mean Difference (IV, Fixed, 95% CI)

0.29 [0.04, 0.53]

3 Functional ambulation Show forest plot

5

238

Std. Mean Difference (IV, Fixed, 95% CI)

0.25 [‐0.00, 0.51]

4 Sit to stand: post treatment/change from baseline Show forest plot

7

346

Standardised effect (Fixed, 95% CI)

0.35 [0.13, 0.56]

5 Lower limb functional measures Show forest plot

4

177

Std. Mean Difference (IV, Fixed, 95% CI)

0.20 [‐0.10, 0.50]

6 Standing balance/reach Show forest plot

3

132

Std. Mean Difference (IV, Fixed, 95% CI)

0.29 [‐0.06, 0.63]

Figuras y tablas -
Comparison 4. Lower limb function: post treatment
Comparison 5. Lower limb function: follow up

Outcome or subgroup title

No. of studies

No. of participants

Statistical method

Effect size

1 All outcomes Show forest plot

7

250

Std. Mean Difference (IV, Fixed, 95% CI)

0.03 [‐0.22, 0.28]

1.1 Under 6 months post treatment

4

80

Std. Mean Difference (IV, Fixed, 95% CI)

0.11 [‐0.33, 0.56]

1.2 6 to 12 months post treatment

3

170

Std. Mean Difference (IV, Fixed, 95% CI)

‐0.01 [‐0.32, 0.29]

Figuras y tablas -
Comparison 5. Lower limb function: follow up
Comparison 6. Lower limb function: subgroup analyses

Outcome or subgroup title

No. of studies

No. of participants

Statistical method

Effect size

1 Dosage of task practice Show forest plot

10

416

Std. Mean Difference (IV, Fixed, 95% CI)

0.26 [0.06, 0.45]

1.1 0 to 20 hours

8

336

Std. Mean Difference (IV, Fixed, 95% CI)

0.19 [‐0.03, 0.40]

1.2 More than 20 hours

2

80

Std. Mean Difference (IV, Fixed, 95% CI)

0.56 [0.11, 1.01]

2 Time since stroke Show forest plot

10

416

Std. Mean Difference (IV, Fixed, 95% CI)

0.26 [0.06, 0.45]

2.1 0 to 15 days

3

197

Std. Mean Difference (IV, Fixed, 95% CI)

0.24 [‐0.04, 0.52]

2.2 16 days to 6 months

4

101

Std. Mean Difference (IV, Fixed, 95% CI)

0.29 [‐0.11, 0.69]

2.3 More than 6 months

3

118

Std. Mean Difference (IV, Fixed, 95% CI)

0.26 [‐0.11, 0.62]

3 Type of intervention Show forest plot

10

416

Std. Mean Difference (IV, Fixed, 95% CI)

0.26 [0.06, 0.45]

3.1 Whole therapy

2

138

Std. Mean Difference (IV, Fixed, 95% CI)

0.10 [‐0.24, 0.43]

3.2 Mixed training

5

210

Std. Mean Difference (IV, Fixed, 95% CI)

0.48 [0.20, 0.75]

3.3 Single task training

3

68

Std. Mean Difference (IV, Fixed, 95% CI)

‐0.07 [‐0.55, 0.41]

Figuras y tablas -
Comparison 6. Lower limb function: subgroup analyses
Comparison 7. Global motor function

Outcome or subgroup title

No. of studies

No. of participants

Statistical method

Effect size

1 Global motor function scales Show forest plot

2

138

Std. Mean Difference (IV, Fixed, 95% CI)

0.32 [‐0.01, 0.66]

Figuras y tablas -
Comparison 7. Global motor function
Comparison 8. Secondary outcomes

Outcome or subgroup title

No. of studies

No. of participants

Statistical method

Effect size

1 Activities of daily living function Show forest plot

5

325

Std. Mean Difference (IV, Fixed, 95% CI)

0.29 [0.07, 0.51]

2 Upper limb impairment Show forest plot

3

184

Std. Mean Difference (IV, Fixed, 95% CI)

0.14 [‐0.15, 0.43]

3 Lower limb impairment Show forest plot

2

73

Std. Mean Difference (IV, Fixed, 95% CI)

0.13 [‐0.33, 0.59]

4 Quality of life/health status Show forest plot

3

148

Std. Mean Difference (IV, Fixed, 95% CI)

0.08 [‐0.24, 0.41]

Figuras y tablas -
Comparison 8. Secondary outcomes
Comparison 9. Sensitivity analyses

Outcome or subgroup title

No. of studies

No. of participants

Statistical method

Effect size

1 Allocation concealment Show forest plot

13

512

Std. Mean Difference (IV, Fixed, 95% CI)

0.38 [0.21, 0.56]

1.1 Adequate

8

368

Std. Mean Difference (IV, Fixed, 95% CI)

0.37 [0.17, 0.58]

1.2 Inadequate/unclear

5

144

Std. Mean Difference (IV, Fixed, 95% CI)

0.40 [0.07, 0.74]

2 Comparison groups Show forest plot

13

512

Std. Mean Difference (IV, Fixed, 95% CI)

0.38 [0.21, 0.56]

2.1 Usual care

7

283

Std. Mean Difference (IV, Fixed, 95% CI)

0.27 [0.03, 0.50]

2.2 Attention control

6

229

Std. Mean Difference (IV, Fixed, 95% CI)

0.53 [0.26, 0.80]

3 Equivalence of therapy time Show forest plot

13

512

Std. Mean Difference (IV, Fixed, 95% CI)

0.38 [0.21, 0.56]

3.1 Additional therapy time

2

62

Std. Mean Difference (IV, Fixed, 95% CI)

0.09 [‐0.41, 0.59]

3.2 Equivalent therapy time

11

450

Std. Mean Difference (IV, Fixed, 95% CI)

0.42 [0.23, 0.61]

Figuras y tablas -
Comparison 9. Sensitivity analyses