| 1 Mortality at 28 days Show forest plot | 2 | 1028 | Risk Ratio (M‐H, Fixed, 95% CI) | 0.79 [0.61, 1.02] |
|
| 2 Mortality at 36 weeks postmenstrual age Show forest plot | 2 | 1028 | Risk Ratio (M‐H, Fixed, 95% CI) | 0.81 [0.64, 1.03] |
|
| 3 Chronic lung disease at 28 days Show forest plot | 2 | 1028 | Risk Ratio (M‐H, Fixed, 95% CI) | 1.00 [0.89, 1.12] |
|
| 4 Chronic lung disease at 36 weeks Show forest plot | 2 | 1028 | Risk Ratio (M‐H, Fixed, 95% CI) | 0.99 [0.84, 1.18] |
|
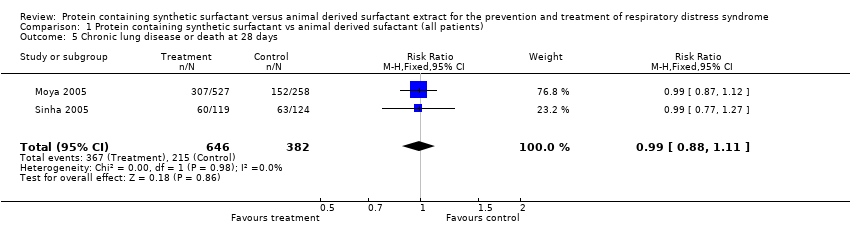
| 5 Chronic lung disease or death at 28 days Show forest plot | 2 | 1028 | Risk Ratio (M‐H, Fixed, 95% CI) | 0.99 [0.88, 1.11] |
|
| 6 Chronic lung disease or death at 36 weeks postmenstrual age Show forest plot | 2 | 1028 | Risk Ratio (M‐H, Fixed, 95% CI) | 0.96 [0.82, 1.12] |
|
| 7 Pulmonary interstitial emphysema Show forest plot | 1 | 785 | Risk Ratio (M‐H, Fixed, 95% CI) | 1.14 [0.73, 1.80] |
|
| 8 Air leaks Show forest plot | 2 | 1028 | Risk Ratio (M‐H, Fixed, 95% CI) | 1.00 [0.73, 1.37] |
|
| 9 Pulmonary hemorrhage Show forest plot | 2 | 1028 | Risk Ratio (M‐H, Fixed, 95% CI) | 0.73 [0.51, 1.06] |
|
| 10 Respiratory distress syndrome at 24 hours Show forest plot | 1 | 785 | Risk Ratio (M‐H, Fixed, 95% CI) | 1.17 [0.96, 1.44] |
|
| 11 Patent ductus arteriosis Show forest plot | 1 | 243 | Risk Ratio (M‐H, Fixed, 95% CI) | 0.98 [0.74, 1.31] |
|
| 12 Proven sepsis Show forest plot | 1 | 785 | Risk Ratio (M‐H, Fixed, 95% CI) | 1.01 [0.85, 1.19] |
|
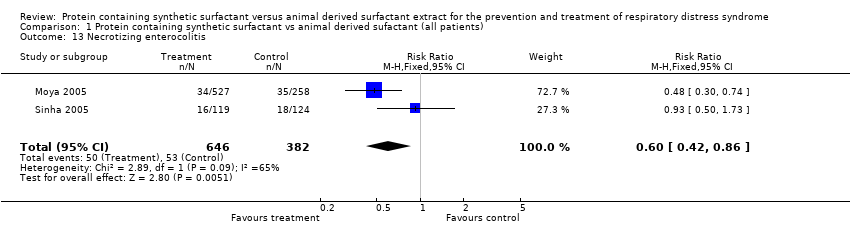
| 13 Necrotizing enterocolitis Show forest plot | 2 | 1028 | Risk Ratio (M‐H, Fixed, 95% CI) | 0.60 [0.42, 0.86] |
|
| 14 Intraventricular hemorrhage Show forest plot | 2 | 1028 | Risk Ratio (M‐H, Fixed, 95% CI) | 1.01 [0.88, 1.15] |
|
| 15 Severe intraventricular hemorrhage (Grade III and IV) Show forest plot | 1 | 243 | Risk Ratio (M‐H, Fixed, 95% CI) | 1.52 [0.73, 3.13] |
|
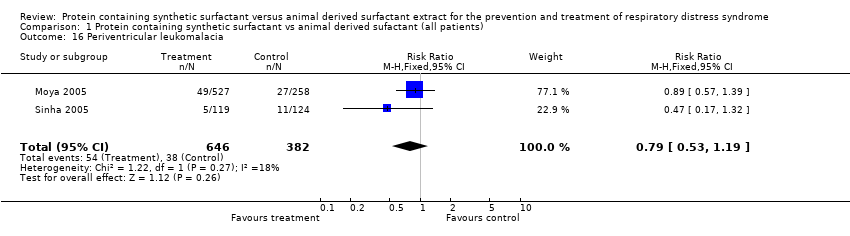
| 16 Periventricular leukomalacia Show forest plot | 2 | 1028 | Risk Ratio (M‐H, Fixed, 95% CI) | 0.79 [0.53, 1.19] |
|
| 17 Retinopathy of prematurity Show forest plot | 2 | 1028 | Risk Ratio (M‐H, Fixed, 95% CI) | 1.07 [0.86, 1.32] |
|
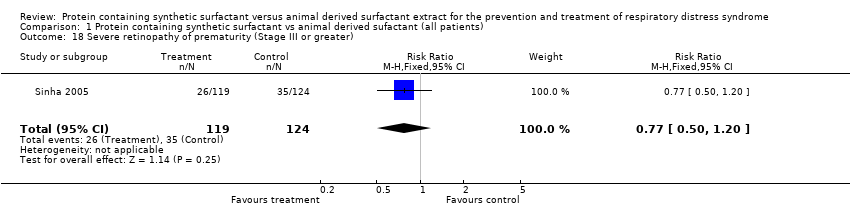
| 18 Severe retinopathy of prematurity (Stage III or greater) Show forest plot | 1 | 243 | Risk Ratio (M‐H, Fixed, 95% CI) | 0.77 [0.50, 1.20] |
|