| 1 No spontaneous vaginal birth within a specified time, as defined by the trial authors Show forest plot | 1 | 120 | Risk Ratio (M‐H, Fixed, 95% CI) | 0.96 [0.71, 1.28] |
|
| 2 Instrumental birth Show forest plot | 1 | 197 | Risk Ratio (M‐H, Fixed, 95% CI) | 3.28 [0.14, 79.65] |
|
| 3 Caesarean section Show forest plot | 1 | 197 | Risk Ratio (M‐H, Fixed, 95% CI) | 1.10 [0.07, 17.27] |
|
| 4 Operative birth ‐ instrumental or caesarean Show forest plot | 2 | 317 | Risk Ratio (M‐H, Random, 95% CI) | 0.66 [0.12, 3.55] |
|
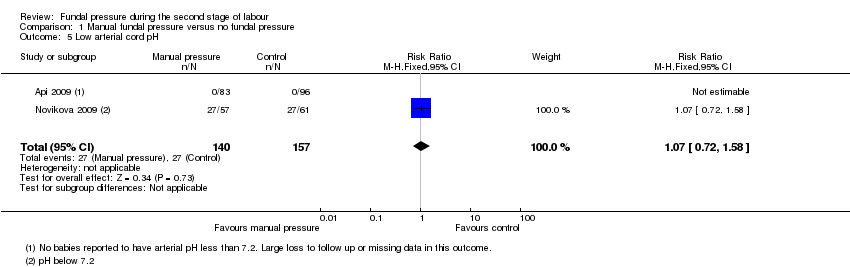
| 5 Low arterial cord pH Show forest plot | 2 | 297 | Risk Ratio (M‐H, Fixed, 95% CI) | 1.07 [0.72, 1.58] |
|
| 6 Apgar score less than 7 at 5 minutes Show forest plot | 4 | 2759 | Risk Ratio (M‐H, Random, 95% CI) | 4.48 [0.28, 71.45] |
|
| 7 Duration of active second stage Show forest plot | 1 | 194 | Mean Difference (IV, Fixed, 95% CI) | ‐0.80 [‐3.66, 2.06] |
|
| 8 Episiotomy Show forest plot | 2 | 317 | Risk Ratio (M‐H, Fixed, 95% CI) | 1.18 [0.92, 1.50] |
|
| 9 Soft tissue damage ‐ perineal Show forest plot | 1 | 209 | Risk Ratio (M‐H, Fixed, 95% CI) | 6.42 [0.79, 52.37] |
|
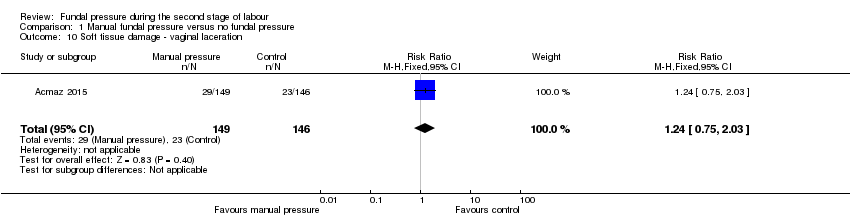
| 10 Soft tissue damage ‐ vaginal laceration Show forest plot | 1 | 295 | Risk Ratio (M‐H, Fixed, 95% CI) | 1.24 [0.75, 2.03] |
|
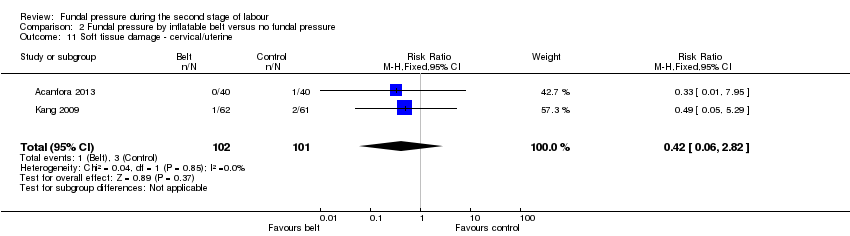
| 11 Soft tissue damage ‐ cervical Show forest plot | 1 | 295 | Risk Ratio (M‐H, Fixed, 95% CI) | 4.90 [1.09, 21.98] |
|
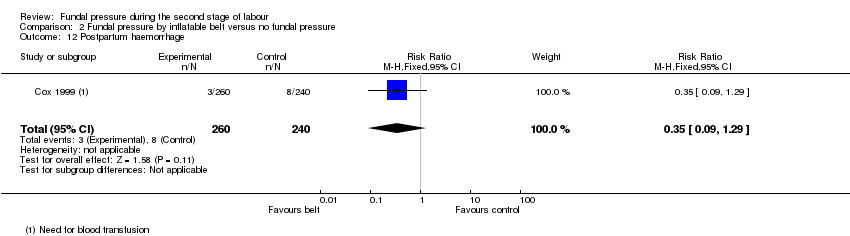
| 12 Postpartum haemorrhage Show forest plot | 1 | 120 | Risk Ratio (M‐H, Fixed, 95% CI) | 1.87 [0.58, 6.06] |
|
| 13 Pain after enrolment as defined by trial authors Show forest plot | 1 | 209 | Risk Ratio (M‐H, Fixed, 95% CI) | 4.54 [2.21, 9.34] |
|
| 14 Neonatal trauma ‐ fractures Show forest plot | 1 | 209 | Risk Ratio (M‐H, Fixed, 95% CI) | 0.0 [0.0, 0.0] |
|
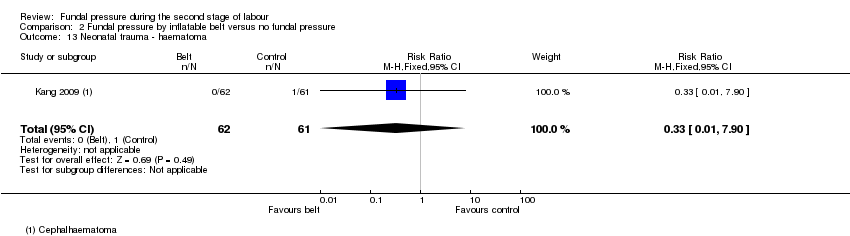
| 15 Neonatal trauma ‐ haematoma Show forest plot | 1 | 209 | Risk Ratio (M‐H, Fixed, 95% CI) | 0.0 [0.0, 0.0] |
|
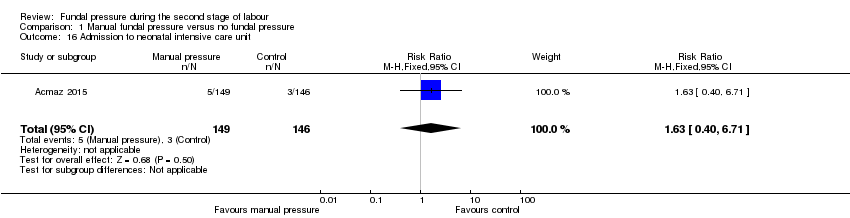
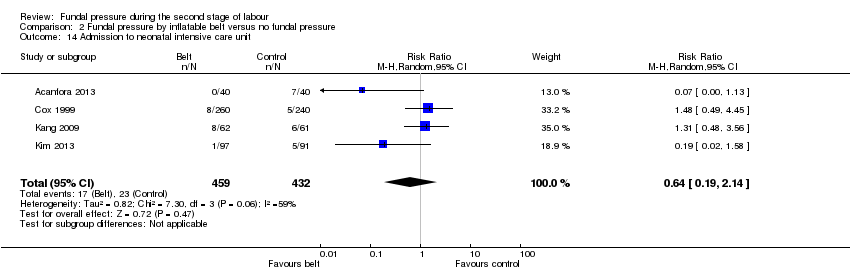
| 16 Admission to neonatal intensive care unit Show forest plot | 1 | 295 | Risk Ratio (M‐H, Fixed, 95% CI) | 1.63 [0.40, 6.71] |
|
| 17 Neonatal death Show forest plot | 2 | 2445 | Risk Ratio (M‐H, Fixed, 95% CI) | 0.0 [0.0, 0.0] |
|
| 18 Sensitivity analysis: low arterial cord pH Show forest plot | 1 | 118 | Risk Ratio (M‐H, Fixed, 95% CI) | 1.07 [0.72, 1.58] |
|