Posición y movilidad de la madre durante el período dilatante del trabajo de parto
Resumen
Antecedentes
En las mujeres que residen en países desarrollados y de bajos ingresos y tienen un parto en establecimientos sanitarios, es más frecuente pasar el trabajo de parto en cama. No existen pruebas de que esta práctica se asocie con alguna ventaja para la madre o el feto, aunque puede ser más conveniente para el personal sanitario. Estudios observacionales han indicado que si las pacientes se mantienen acostadas en posición supina durante el trabajo de parto, esta posición puede tener efectos adversos sobre las contracciones uterinas e impedir el progreso del trabajo de parto y, en algunas pacientes, puede reducir el flujo sanguíneo placentario.
Objetivos
Evaluar los efectos de estimular a las pacientes en período dilatante a que asuman diferentes posiciones verticales (que incluye caminar, sentarse, pararse y arrodillarse) versus posiciones en decúbito (supina, semirrecostada y lateral) sobre la duración del trabajo de parto, la forma del parto y otros resultados importantes para la madre y el feto.
Métodos de búsqueda
Se hicieron búsquedas en el Registro de Ensayos del Grupo Cochrane de Embarazo y Parto (Cochrane Pregnancy and Childbirth Group) (31 de enero de 2013).
Criterios de selección
Ensayos aleatorios y cuasialeatorios que compararan a mujeres asignadas al azar a posiciones verticales versus posiciones en decúbito durante el período dilatante del trabajo de parto.
Obtención y análisis de los datos
Se utilizaron los métodos descritos en el Manual Cochrane para Revisiones Sistemáticas de Intervenciones para la obtención de los datos, la evaluación de la calidad de los estudios y el análisis de los resultados. Dos revisores de forma independiente evaluaron la calidad metodológica y extrajeron los datos de cada estudio. Se solicitó información adicional a los autores de los ensayos cuando fue necesario. Se utilizó el análisis de efectos aleatorios para las comparaciones en las que hubo heterogeneidad alta. Los resultados se presentaron mediante el cociente de riesgos (CR) promedio para los datos categóricos y la diferencia de medias (DM) para los datos continuos.
Resultados principales
Los resultados se deben interpretar con precaución ya que la calidad metodológica de los 25 ensayos incluidos (5218 mujeres) fue variable.
Para la Comparación 1: Posiciones verticales y deambulación versus posiciones en decúbito y atención en cama: el período dilatante fue aproximadamente una hora y 22 minutos más corto en las pacientes asignadas al azar a posición vertical en contraposición con las posiciones en decúbito (DM promedio ‐1,36; intervalo de confianza [IC] del 95%: ‐2,22 a ‐0,51; 15 estudios, 2503 pacientes; efectos aleatorios, T2 = 2,39; Chi2 = 203,55; gl = 14, (p < 0,00001); I2 = 93%). También fue menos probable que a las pacientes que asumieron posiciones verticales se les realizara una cesárea (CR 0,71; IC del 95%: 0,54 a 0,94; 14 estudios, 2682 pacientes) y menos probable que recibieran una epidural (CR 0,81; IC del 95%: 0,66 a 0,99; nueve estudios, 2107 pacientes; efectos aleatorios, T2 = 0,02; I2 = 61%). Los recién nacidos de madres que asumieron posiciones verticales tuvieron menos probabilidades de ser ingresados en la unidad de cuidados intensivos neonatales; sin embargo, este resultado se basó en un ensayo (CR 0,20; IC del 95%: 0,04 a 0,89; un estudio, 200 pacientes). No hubo diferencias significativas entre los grupos en otros resultados que incluyen la duración del período expulsivo u otros resultados relacionados con el bienestar de las madres y los recién nacidos.
Para la Comparación 2: Posiciones verticales y deambulación versus posiciones en decúbito y en cama (con epidural: todas las pacientes): no hubo diferencias significativas entre los grupos en los resultados que incluyen la duración del período expulsivo u otros resultados relacionados con el bienestar de las madres y los recién nacidos.
Conclusiones de los autores
Hay pruebas claras e importantes de que caminar y las posiciones verticales en el período dilatante reducen la duración del trabajo de parto, el riesgo de parto por cesárea y la necesidad de epidural, y no parecen asociarse con un aumento en las intervenciones ni con efectos negativos sobre el bienestar de las madres y los recién nacidos. Debido a la gran heterogeneidad y al importante sesgo de realización de las situaciones de estudio, aún se necesitan ensayos de mejor calidad para confirmar con cierta confianza los verdaderos riesgos y efectos beneficiosos de las posiciones verticales y la movilidad comparadas con las posiciones en decúbito en todas las pacientes. Según los hallazgos actuales, se recomienda que las pacientes en trabajo de parto con bajo riesgo deben estar informadas de los efectos beneficiosos de las posiciones verticales, y estimularlas y ayudarlas a que asuman la posición que deseen.
PICO
Resumen en términos sencillos
Posición de la madre durante el período dilatante
Hay pocas dudas de que a las pacientes se les debe estimular a que utilicen las posiciones que les proporcionen la mayor comodidad, control y efectos beneficiosos durante el período dilatante del trabajo de parto. Como actualmente las pacientes en la mayoría de las sociedades occidentales permanecen en cama durante todo el trabajo de parto, es importante que comprendan los riesgos y los efectos beneficiosos de las posiciones que eligen.
Esta revisión incluyó 25 estudios (con 5218 pacientes). Aunque muchos estudios no fueron de alta calidad, y en su mayoría las pacientes tenían bajo riesgo, indicaron que el período dilatante puede ser aproximadamente una hora y veinte minutos más corto en las pacientes que asumen la posición vertical o caminan. Como cada contracción es potencialmente dolorosa y el trabajo de parto prolongado puede ser un proceso abrumador y agotador y provocar una mayor necesidad de intervención médica, éste es un resultado significativo para las pacientes. De hecho, otros resultados importantes para las pacientes que asumieron la posición vertical y la movilidad en comparación con mantenerse acostadas en la cama incluyeron una reducción del riesgo de parto por cesárea, menos uso de epidural como método de alivio del dolor y menos probabilidades de que los recién nacidos fueran ingresados en la unidad neonatal. Aún se necesitan más estudios de investigación de mejor calidad para validar estos resultados en todas las pacientes en trabajo de parto. Sin embargo, según los resultados de esta revisión se recomienda que siempre que sea posible a las pacientes se les debe estimular y apoyar para que utilicen las posiciones verticales y móviles de su elección durante el período dilatante del trabajo de parto, ya que puede mejorar el progreso del trabajo de parto y dar lugar a mejores resultados para ellas mismas y sus recién nacidos.
Authors' conclusions
Summary of findings
| Comparison 1: Upright and ambulant positions versus recumbent positions and bed care Outcomes showing significance | ||
|
| Primary Outcomes | Secondary Outcomes |
| Maternal | 1. Shorter duration of labour if upright. Subgroup analysis demonstrated this when:
Sensitivity analysis, which excluded lower quality trials, comparing sitting, standing, squatting, kneeling or walking with recumbent/supine/lateral did confirm this result.
2. More likely to have a vaginal birth if upright. Subgroup analysis demonstrated this when:
Sensitivity analysis, which excluded lower quality trials, comparing sitting, standing, squatting, kneeling or walking with recumbent/supine/lateral did confirm this result. 3. Less likely to have operative birth if upright. Subgroup analysis demonstrated this when:
Sensitivity analysis, which excluded lower quality trials, did confirm this result.
3. Less likely to have caesarean birth if upright. Subgroup analysis demonstrated this when:
Sensitivity analysis, which excluded lower quality trials, comparing sitting, standing, squatting, kneeling or walking with recumbent/supine/lateral did confirm this result. | 1. Less likely to have an epidural if upright. 2. Lower pain scores if upright. 3. BUT More anxiety for nulliparous women if upright. However this outcome is only from 1 study of 206 women.
Note: there were no data for: spontaneous rupture of membranes or hypotension requiring intervention. |
| Fetal / Neonatal |
| 1. Less likely to have admission to NICU if mother is upright. |
|
| ||
| Comparison 2: Upright and ambulant positions versus recumbent positions and bed care (all women: epidural) Outcomes showing significance | ||
|
| Primary Outcomes | Secondary Outcomes |
| Maternal | 1. More likely to have operative vaginal birth if multiparous and upright (subgroup analysis: parity only). Note: there were no data for: duration of first stage labour; maternal satisfaction. |
Note: there was no data for: artificial rupture of membranes; spontaneous rupture of membranes; estimated blood loss > 500 mL; perineal trauma. |
| Fetal / Neonatal | Note: there were no data for: fetal distress requiring immediate birth or use of neonatal mechanical ventilation. | Note: there were no data for: admission to the NICU. |
| NICU: neonatal intensive care unit | ||
Background
In cultures not influenced by Western society, women progress through the first stage of labour in upright positions and change position as they wish with no evidence of harmful effects to either the mother or the baby (Andrews 1990; Gupta 2012; Roberts 1989). Women in the developed world too, when encouraged, will choose a number of different positions as the first stage of labour progresses (Carlson 1986; Fenwick 1987; Roberts 1989; Rooks 1999), even though it is more common nowadays for them to labour in bed (Boyle 2000; Roberts 1989; Simkin 1989). Some studies have suggested that as a woman reaches five to six centimetres dilatation, there is a preference to lie down (Roberts 1980; Roberts 1984; Williams 1980). This may explain why women in randomised trials frequently have difficulty maintaining the position to which they have been assigned (Goer 1999), and suggests that there may not be a perfect universal position for women in the first stage of labour.
Description of the condition
Heralding the onset of second stage labour, first stage labour involves a co‐ordinated series of complex physiological changes which results in full dilatation of the cervix. In readiness for birth of the baby (second stage) and separation and delivery of the placenta and membranes (third stage), the process of first stage labour may occur gradually over a period of days, or rapidly over a period of minutes. There are many factors which influence the duration and successful completion of first stage labour. These include the intensity and frequency of uterine contractions, whether the membranes have ruptured or not, the position and size of the baby or babies, the positioning and functioning of the placenta, the adequacy of the pelvis, and the physical and psychological well being of the mother.
Description of the intervention
Women who are in early labour are encouraged to remain in upright and mobile positions such as sitting, standing and walking until they are ready to give birth to their babies. There are many variations to being upright and mobile, but the key component is the ability for women to move and change position more quickly and easily as their labour progresses. Upright and mobile positions can be commenced and maintained in different places such as the home, shower or bath. They can be used with a variety of props such as a recliner chair or birthing ball. They can be alternated with other upright positions and can include comfort measures such as rocking the hips from side to side, leaning on a partner for support and intimacy and providing access to the lower back for massage or heat therapy.
How the intervention might work
Upright and mobile positions use gravity to aid descent of the fetal head into the pelvis. As the head is applied directly and evenly on the cervix, uterine contractions are intensified in strength, regularity and frequency. It is this uterine efficiency which aids cervical dilatation and successful completion of the first stage of labour. Study findings (Caldeyro‐Barcia 1960; Lupe 1986; Mendez‐Bauer 1980; Roberts 1983; Roberts 1984; Ueland 1969) have indicated that although contractions increased in strength in the upright or lateral position compared to the supine position, they were often negatively affected when a labouring woman lay down after being upright or mobile. This effect can often be reversed if the woman returns to an upright position. As effective contractions are vital to aid cervical dilatation and fetal descent, they have an important role in helping to reduce dystocia (slow progress in labour) (Roberts 1989; Rooks 1999; Walsh 2000).
Upright and mobile positions are also less likely to cause compression of the abdominal blood vessels by the pregnant uterus and this maximises uterine blood flow to the placenta and fetus during labour. Numerous studies show that a supine position in labour may have adverse physiological effects on the condition of the woman and her baby and on the progression of labour. The weight of the pregnant uterus can compress the abdominal blood vessels, compromising the mother's circulatory function including uterine blood flow (Abitbol 1985; Huovinen 1979; Marx 1982; Ueland 1969), and this may negatively affect the blood flow to the placenta (Cyna 2006; Roberts 1989; Rooks 1999; Walsh 2000). A recent study found an association between women who sleep supine during pregnancy and stillbirth (Stacey 2011). A related Cochrane review focuses on maternal position for fetal malpresentation in labour Hunter 2007.
Moving about can increase a woman's sense of control in labour by providing a self‐regulated distraction from the challenge of labour (Albers 1997). Women who labour in water can move more easily than on land (Cluett 2009) and there is evidence to suggest immersion in water may reduce pain in labour (Jones 2012). Support from another person also appears to facilitate normal labour (Hodnett 2012). Increasing a woman's sense of control may have the effect of decreasing her need for analgesia (Albers 1997; Hodnett 2012; Lupe 1986; Rooks 1999) and it has also been suggested that upright positions in the first stage of labour may increase women's comfort (Simkin 2002).
Why it is important to do this review
Recumbent (lying down) positions in the first stage of labour are often promoted by care providers because they provide convenient access to the mother for abdominal palpation, fetal monitoring and vaginal examinations. Indeed some developments in technology such as fetal monitoring, epidurals for pain relief and the use of intravenous infusions have made it difficult and potentially unsafe for women to move about during labour. It is important, therefore, to assess the available evidence so that maternal positions which are shown to be safe and effective during first stage labour are actively encouraged. Clinicians providing care in first stage labour also need to provide clear, consistent, and evidence based explanation, so that women will understand both the risks and benefits of the positions they use and enable them to make informed decisions about the position choices they think will afford them most comfort.
Objectives
The purpose of this review is to assess the effects of different upright and recumbent positions and mobilisation for women in the first stage of labour on duration of labour, type of birth and other important outcomes for mothers and babies.
The primary objective is:
-
to compare the effects of upright (defined as walking and upright non‐walking, e.g. sitting, standing, kneeling, squatting and all fours) positions with recumbent positions (supine, semi‐recumbent and lateral) assumed by women in the first stage of labour on maternal, fetal and neonatal outcomes.
The secondary objectives are:
-
to compare the effects of semi‐recumbent and supine positions with lateral positions assumed by women in the first stage of labour on maternal, fetal and neonatal outcomes;
-
to compare the effects of walking with upright non‐walking positions (sitting, standing, kneeling, squatting, all fours) assumed by women in the first stage of labour on maternal, fetal and neonatal outcomes;
-
to compare the effects of walking with recumbent positions (supine, semi‐recumbent and lateral) assumed by women in the first stage of labour on maternal, fetal and neonatal outcomes;
-
to compare allowing women to assume the position/s they choose with recumbent positions (supine, semi‐recumbent and lateral) assumed by women in the first stage of labour on maternal, fetal and neonatal outcomes.
Methods
Criteria for considering studies for this review
Types of studies
Randomised or quasi‐randomised trials. We planned to include cluster randomised‐trials which were otherwise eligible. Cross‐over trials might be useful for short‐term outcomes such as fetal heart rate patterns, but would not be appropriate for the main outcomes of this review and were not included.
Types of participants
Women in the first stage of labour.
Types of interventions
The type of intervention was the position or positions assumed by women in the first stage of labour. The positions assumed by a woman in the first stage of labour can be broadly categorised as being either upright or recumbent.
The positions considered recumbent were:
-
semi recumbent;
-
lateral;
-
supine;
-
dorsal (not prespecified in the protocol).
-
bed care (not prespecified in the protocol).
The positions considered upright included:
-
sitting;
-
standing;
-
walking;
-
kneeling;
-
squatting;
-
all fours (hands and knees).
Types of outcome measures
-
Maternal outcomes
-
Fetal outcomes
-
Neonatal outcomes
Primary outcomes
Primary maternal outcomes:
-
duration of first stage of labour;
-
mode of birth (spontaneous vaginal, operative vaginal or caesarean);
-
maternal satisfaction with positioning and with the childbirth experience.
Primary fetal and neonatal outcomes:
-
fetal distress requiring immediate birth;
-
use of neonatal mechanical ventilation.
Secondary outcomes
Secondary maternal outcomes:
-
pain as experienced by the woman;
-
use of analgesics (amount and type, e.g. epidural/opioid);
-
duration of second stage of labour;
-
augmentation of labour using oxytocin;
-
artificial rupture of membranes;
-
hypotension requiring intervention;
-
estimated blood loss > 500 mL;
-
perineal trauma (including episiotomy and third and fourth degree tears).
Secondary neonatal outcomes:
-
Apgar scores of less than seven at five minutes following birth; less than three at five minutes following birth and less than four at birth;
-
admission to the neonatal intensive care unit;
-
perinatal death (not prespecified in the protocol).
Search methods for identification of studies
Electronic searches
We searched the Cochrane Pregnancy and Childbirth Group’s Trials Register by contacting the Trials Search Co‐ordinator (31 January 2013).
The Cochrane Pregnancy and Childbirth Group’s Trials Register is maintained by the Trials Search Co‐ordinator and contains trials identified from:
-
monthly searches of the Cochrane Central Register of Controlled Trials (CENTRAL);
-
weekly searches of MEDLINE;
-
weekly searches of Embase;
-
handsearches of 30 journals and the proceedings of major conferences;
-
weekly current awareness alerts for a further 44 journals plus monthly BioMed Central email alerts.
Details of the search strategies for CENTRAL, MEDLINE and Embase, the list of handsearched journals and conference proceedings, and the list of journals reviewed via the current awareness service can be found in the ‘Specialized Register’ section within the editorial information about the Cochrane Pregnancy and Childbirth Group.
Trials identified through the searching activities described above are each assigned to a review topic (or topics). The Trials Search Co‐ordinator searches the register for each review using the topic list rather than keywords.
Searching other resources
We performed a manual search of the references of all retrieved articles and contacted expert informants.
We did not apply any language restrictions.
Data collection and analysis
We used methods described in the Cochrane Handbook for Systematic Reviews of Interventions for data collection, assessing study quality and analysing results (Higgins 2011).
Selection of studies
A minimum of two review authors independently assessed for inclusion all the potential studies identified as a result of the search strategy. We resolved any disagreement through discussion, or when required, we consulted an additional person.
Data extraction and management
For methods used in previous updates, please see Appendix 1.
For this update, we used the following methods.
We designed a form to extract data. At least two review authors extracted the data using the agreed form. We resolved discrepancies through discussion, or if required we consulted a third author. We entered data into Review Manager software (RevMan 2012), and checked for accuracy.
When information regarding any of the above was unclear, we attempted to contact authors of the original reports to provide further details.
Assessment of risk of bias in included studies
Two review authors independently assessed risk of bias for each study using the criteria outlined in the Cochrane Handbook for Systematic Reviews of Interventions (Higgins 2011). We resolved any disagreement by discussion or by involving a third assessor. Please see the 'Risk of bias' tables following the Characteristics of included studies tables for the assessment of bias for each study.
(1) Sequence generation (checking for possible selection bias)
We described for each included study the methods used to generate the allocation sequence to assess whether methods were truly random.
We assessed the methods as:
-
low risk of bias (any truly random process, e.g. random number table; computer random number generator);
-
high risk of bias (any non‐random process, e.g. odd or even date of birth; hospital or clinic record number);
-
unclear risk of bias.
(2) Allocation concealment (checking for possible selection bias)
We described for each included study the method used to conceal the allocation sequence in sufficient detail and determined whether group allocation could have been foreseen in advance of, or during, recruitment, or changed afterwards.
We assessed the methods as:
-
low risk of bias (e.g. telephone or central randomisation; consecutively numbered sealed opaque envelopes);
-
high risk of bias (open random allocation; unsealed or non‐opaque envelopes; alternation; date of birth);
-
unclear risk of bias.
(3.1) Blinding of participants and personnel (checking for possible performance bias)
We described for each included study the methods used, if any, to blind study participants and personnel from knowledge of which intervention a participant received. We considered that studies were at low risk of bias if they were blinded, or if we judged that the lack of blinding would be unlikely to affect results. We assessed blinding separately for different outcomes or classes of outcomes.
We assessed the methods as:
-
low, high or unclear risk of bias for participants;
-
low, high or unclear risk of bias for personnel.
(3.2) Blinding of outcome assessment (checking for possible detection bias)
We described for each included study the methods used, if any, to blind outcome assessors from knowledge of which intervention a participant received. We assessed blinding separately for different outcomes or classes of outcomes.
We assessed methods used to blind outcome assessment as:
-
low, high or unclear risk of bias.
(4) Incomplete outcome data (checking for possible attrition bias through withdrawals, dropouts, protocol deviations)
We described for each included study the completeness of outcome data, including attrition and exclusions from the analysis. We state whether attrition and exclusions were reported, the numbers (compared with the total randomised participants), reasons for attrition/exclusion where reported, and any re‐inclusions in analyses which we have undertaken.
We assessed the methods as:
-
low risk of bias (e.g. no missing outcome data; missing outcome data balanced across groups);
-
high risk of bias (e.g. numbers or reasons for missing data imbalanced across groups; ‘as treated’ analysis done with substantial departure of intervention received from that assigned at randomisation);
-
unclear risk of bias.
(5) Selective reporting (checking for reporting bias)
We described for each included study how we investigated the possibility of selective outcome reporting bias and what we found.
We assessed the methods as:
-
low risk of bias (where it is clear that all of the study’s pre‐specified outcomes and all expected outcomes of interest to the review have been reported);
-
high risk of bias (where not all the study’s pre‐specified outcomes have been reported; one or more reported primary outcomes were not prespecified; outcomes of interest are reported incompletely and so cannot be used; study fails to include results of a key outcome that would have been expected to have been reported);
-
unclear risk of bias.
(6) Other bias (checking for bias due to problems not covered by 1 to 5 above)
We described for each included study any important concerns we have about other possible sources of bias.
We assessed whether each study was free of other problems that could put it at risk of bias:
-
low risk of other bias;
-
high risk of other bias;
-
unclear whether there is risk of other bias.
(7) Overall risk of bias
We made explicit judgements about whether studies were at high risk of bias, according to the criteria given in the Handbook (Higgins 2011). With reference to (1) to (6) above, we assessed the likely magnitude and direction of the bias and whether we considered it is likely to impact on the findings. We explored the impact of the level of bias through undertaking sensitivity analyses ‐ see 'Sensitivity analysis' below.
Measures of treatment effect
We carried out statistical analysis using the Review Manager software (RevMan 2012). We used fixed‐effect meta‐analysis for combining data in the absence of significant heterogeneity if trials were sufficiently similar. When significant heterogeneity was present, we used a random‐effects meta‐analysis.
Dichotomous data
For dichotomous data, we have presented results as summary risk ratio (RR) with 95% confidence intervals (CI).
Continuous data
For continuous data (e.g. maternal pain and satisfaction when measured as scores or on visual analogue scales) we used the mean difference (MD) if outcomes were measured in the same way between trials. We planned to use the standardised mean difference (SMD) to combine trials that measured the same outcome, but used different methods.
Unit of analysis issues
Cluster‐randomised trials
We intended to include cluster‐randomised trials in the analyses along with individually‐randomised trials, and to adjust sample sizes using the methods described in Gates 2005 and Higgins 2011.
We identified no cluster randomised trials in this version of the review, but if we identify such trials in future searches we will include them in updates.
Cross‐over Trials
Cross‐over trials might be useful for short‐term outcomes such as fetal heart rate patterns, but would not be appropriate for the main outcomes of this review and were not included.
Dealing with missing data
For included studies, we noted levels of attrition. Where data were not reported for some outcomes or groups, we attempted to contact the study authors for further information.
Intention‐to‐treat analysis (ITT)
We had intended to analyse data on all participants with available data in the group to which they were allocated, regardless of whether or not they received the allocated intervention. If in the original reports participants were not analysed in the group to which they were randomised, and there was sufficient information in the trial report, we attempted to restore them to the correct group (e.g. this applied to data from the Calvert 1982 study).
Assessment of heterogeneity
We assessed statistical heterogeneity in each meta‐analysis using the T², I² and Chi² statistics. We regarded heterogeneity as substantial if the T² was greater than zero and either the I² was greater than 30% or there was a low P value (less than 0.10) in the Chi² test for heterogeneity. In such cases we took the following steps:
-
we performed a sensitivity analysis, in which methodological weak trials were removed from the analyses and results compared for the primary outcomes;
-
we visually inspected forest plots for evidence of inconsistency in results;
-
we compared the results of fixed‐effect and random‐effects analyses.
Assessment of reporting biases
If there were 10 or more studies in the meta‐analysis for any particular outcome, we investigated reporting biases (such as publication bias) using funnel plots. We assessed possible asymmetry visually. If asymmetry was suggested by a visual assessment, we performed exploratory analyses to investigate it.
Data synthesis
We carried out statistical analysis using the RevMan software (RevMan 2012). We used fixed‐effect meta‐analysis for combining data where it was reasonable to assume that studies were estimating the same underlying treatment effect: i.e. where trials examined the same intervention, and where we judged the trials’ populations and methods to be sufficiently similar. If we suspected clinical heterogeneity was sufficient to expect the underlying treatment effects differed between trials, or if substantial statistical heterogeneity was detected, we used random‐effects meta‐analysis to produce an overall summary. We only performed this analysis if we considered the average treatment effect across trials was clinically meaningful. We defined heterogeneity as substantial if a given meta‐analysis resulted in an I² value greater than 30%, and there was inconsistency among trials in the direction or magnitude of effects (judged visually in the forest plot), or a low (less than 0.10) P value in the Chi² test for heterogeneity. The random‐effects summary was treated as the average range of possible treatment effects and the clinical implications of treatment effects differing between trials is discussed. If the average treatment effect was not clinically meaningful, we did not combine trials. Where we used random‐effects analyses, the results were presented as the average treatment effect with 95% confidence intervals, and the estimates of T² and I².
Subgroup analysis and investigation of heterogeneity
For the main outcomes of duration of first stage labour and method of birth, we performed subgroup analyses by:
-
Parity: nulliparous women versus multiparous women;
-
Onset of labour: spontaneous labour versus induction of labour;
-
Position types: specific upright positions and or combinations versus specific recumbent positions:
-
sitting versus recumbent/supine lateral;
-
walking versus recumbent/supine lateral;
-
sitting, standing, squatting, kneeling and/or walking (mixed) versus recumbent/supine lateral;
-
sitting versus bed care;
-
walking versus bed care;
-
sitting, standing, squatting, kneeling and/or walking (mixed) versus bed care;
-
sitting, standing, squatting, kneeling and/or walking versus supine only.
-
We had also planned subgroup analysis by women with a low‐risk pregnancy (no complications, greater than or equal to 37 weeks' gestation, singleton with a cephalic presentation) versus high‐risk pregnancy, but data were not available to carry out this analysis.
We assessed subgroup differences by interaction tests available within RevMan (RevMan 2012). We reported the results of subgroup analyses quoting the χ2 statistic and P value, and the interaction test I² value.
Sensitivity analysis
We carried out sensitivity analyses to explore the effect of trial quality for important outcomes in the review. Where there was high or unclear risk of bias associated with allocation concealment, we excluded poor quality studies from the analyses in order to assess whether this made any difference to the overall result.
Results
Description of studies
See: Characteristics of included studies; Characteristics of excluded studies
Results of the search
We identified a total of 84 reports representing 57 studies by the search strategy.
Included studies
We included 25 studies with a total of 5218 women in the review Table 1.
| Trial and participant numbers, grouped by comparison and sorted alphabetically | ||||||||
| Comparison 1: Upright and ambulant positions versus recumbent positions and bed care | Comparison 2: Upright and ambulant positions versus recumbent positions and bed care (with epidural: all women) | |||||||
| No. of studies | Author | Year | No. | No. of studies | Author | Year | No. | |
| 1 | Andrews | 1990 | 40 | 1 | Boyle | 2002 | 409 | |
| 2 | Ben Regaya | 2010 | 200 | 2 | Collis | 1999 | 229 | |
| 3 | Bloom | 1998 | 1067 | 3 | Fernando | 1994 | 40 | |
| 4 | Bundsen | 1982 | 60 | 4 | Frenea | 2004 | 61 | |
| 5 | Calvert | 1982 | 200 | 5 | Karraz | 2003 | 221 | |
| 6 | Chan | 1963 | 200 | 6 | Nageotte | 1997 | 761 | |
| 7 | Chen | 1987 | 185 | 7 | Vallejo | 2001 | 160 | |
| 8 | Flynn | 1978 | 68 | |||||
| 9 | Gau | 2011 | 188 | |||||
| 10 | Haukkama | 1982 | 60 | |||||
| 11 | MacLennan | 1994 | 196 | |||||
| 12 | Mathew | 2012 | 60 | |||||
| 13 | McManus | 1978 | 40 | |||||
| 14 | Miquelutti | 2007 | 107 | |||||
| 15 | Mitre | 1974 | 100 | |||||
| 16 | Phumduong | 2007 | 204 | |||||
| 17 | Taavoni | 2011 | 62 | |||||
| 18 | Williams | 1980 | 300 | |||||
| 18 | 3337 | 7 | 1881 | |||||
| Total number of studies for comparisons 1&2: | 25 | |||||||
| Total number of participants for comparisons 1&2: | 5218 | |||||||
Studies were carried out in 13 countries from 1963 to 2012 (almost 50 years): seven in the UK (Boyle 2002; Calvert 1982; Collis 1999; Fernando 1994; Flynn 1978; McManus 1978; Williams 1980); five in the USA (Andrews 1990; Bloom 1998; Mitre 1974; Nageotte 1997; Vallejo 2001); two in France (Frenea 2004; Karraz 2003); and one each in Australia (MacLennan 1994), Brazil (Miquelutti 2007), Finland (Haukkama 1982;), Hong Kong (Chan 1963), India (Mathew 2012), Iran (Taavoni 2011), Japan (Chen 1987), Sweden (Bundsen 1982), Taiwan (Gau 2011), Thailand (Phumdoung 2007) and Tunisia Ben Regaya 2010.
Most trials had small numbers of participants of between 40 to 300 women. Exceptions to this included Boyle 2002 (409 women); Nageotte 1997 (761 women) and Bloom 1998 (1067 women).
The majority of the trials included women at more than 36 weeks' gestation with no obstetric or medical complications (Andrews 1990; Ben Regaya 2010; Bloom 1998; Calvert 1982; Chen 1987; Collis 1999; Frenea 2004; Haukkama 1982; Karraz 2003; MacLennan 1994; Miquelutti 2007; Mitre 1974; Nageotte 1997; Phumdoung 2007; Taavoni 2011; Vallejo 2001).
Twelve studies included only nulliparous women (Andrews 1990; Ben Regaya 2010; Chan 1963; Collis 1999; Fernando 1994; Mathew 2012: Miquelutti 2007; Mitre 1974; Nageotte 1997; Phumdoung 2007; Taavoni 2011; Vallejo 2001);
There was considerable variation about the combinations of upright, mobile and recumbent used in the study protocols. Variations included:
-
walking compared with lateral position (Flynn 1978); walking compared with dorsal or lateral positions (Ben Regaya 2010; Frenea 2004); walking compared with supine, semi supine or lateral position (Karraz 2003); walking compared with care in bed (Bloom 1998; Boyle 2002; Bundsen 1982; Nageotte 1997; Williams 1980);
-
walking or sitting compared with supine or lateral positions (Chan 1963); walking or sitting compared with lateral position (McManus 1978; Vallejo 2001); walking or sitting compared with care in bed (Calvert 1982; Haukkama 1982; MacLennan 1994; Mathew 2012); walking, sitting or standing compared with care in bed (Collis 1999; Fernando 1994); walking, sitting, squatting, kneeling, or standing compared with supine, lateral or prone positions (Andrews 1990); walking, sitting, standing, crouching or kneeling compared with care in bed (Miquelutti 2007);
-
sitting compared with supine position (Mitre 1974); sitting compared with dorsal or lateral position (Chen 1987); sitting, standing, kneeling or squatting compared with care in bed (Gau 2011); and sitting compared with care in bed (Taavoni 2011);
-
kneeling compared with supine position (Phumdoung 2007).
Excluded studies
We excluded 32 studies from the review. Several of the studies were not randomised trials or it was not clear that there had been random allocation to groups (Allahbadia 1992; Asselineau 1996; Caldeyro‐Barcia 1960; Li 2010; Solano 1982); three of the studies used cross‐over designs (Melzack 1991; Molina 1997; Roberts 1984). One study (Diaz 1980 ) was excluded because more than 30% of the intervention group were excluded post‐randomisation, as they did not comply with the protocol. This high rate of attrition meant it was difficult to interpret results. In the Hemminki 1983 study, women in the two groups received different packages of care, so it was not possible to separate out the treatment effect of maternal position on outcomes. It remains unclear if McCormick 2007 was successfully completed or not.
In some studies, the intervention did not compare mobility or upright positions with recumbent positions; for example, Cobo 1968 and Wu 2001 examined lying in bed on one side rather than the other, or lying supine. Liu 1989 compared semi‐upright position with the lying flat position. These positions were both defined as recumbent positions for the purpose of this review. In some studies position/mobility was compared with an alternative intervention, for example the Hemminki 1985 study included women experiencing delay in labour and compared the use of immediate oxytocin with ambulation and delayed oxytocin. Similarly, Read 1981 examined oxytocin in labour. There were a couple of epidural studies, the COMET 2001 study compared women receiving different types of epidural, whereas, Ducloy‐Bouthors 2006 compared epidural spread. One study (Weiniger 2009) compared walking to the toilet to void with using a bedpan in bed. In another (Hodnett 1982) the primary outcome was electronic fetal monitoring, with all women having bed care receiving an epidural, which was not the case for the ambulating women. Two studies focused on interventions in the second, rather than in the first stage of labour (Stewart 1983; Radkey 1991).
Several studies, which may otherwise have been eligible, focused on outcomes which had not been pre‐specified in this review. For example, Danilenko‐Dixon 1996 focused on cardiac output, while the study by Schmidt 2001 and those by Ahmed 1985; Cohen 2002; Divon 1985, and Schneider‐Affeld 1982 (reported in brief abstracts) did not provide sufficient information on outcomes or present outcome data in a form that we were able to use in the review.
Risk of bias in included studies
The overall quality of the included studies was difficult to assess as many of the studies gave very little information about the methods used.
The methodological quality graph Figure 1 shows the review authors' judgements about each methodological quality item presented as percentages across all included studies.

Methodological quality graph: review authors' judgements about each methodological quality item presented as percentages across all included studies.
The methodological quality summary Figure 2 shows the review authors' judgements about each methodological quality item for each included study.
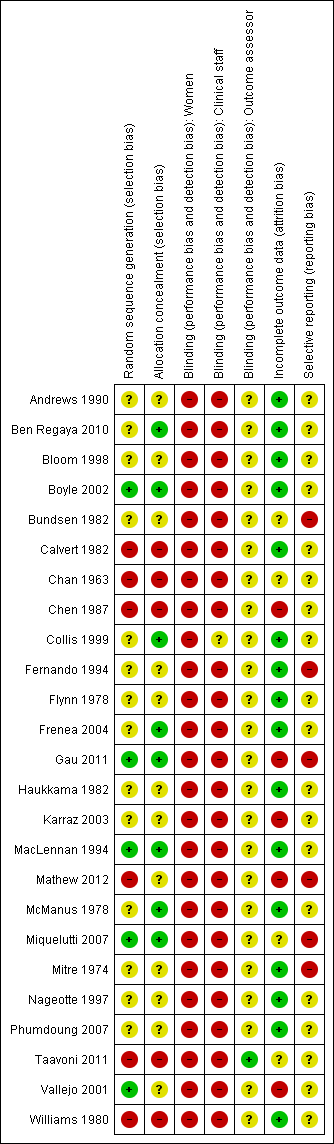
Methodological quality summary: review authors' judgements about each methodological quality item for each included study.
Allocation
The method of sequence generation was often not mentioned in the included studies. In the studies by Boyle 2002, Gau 2011, Miquelutti 2007 and Vallejo 2001, a computer‐generated list of random numbers was used; MacLennan 1994 used variable blocks with stratification; six of the included studies utilised a quasi‐randomised design, where the allocation to groups was according to hospital or case‐note number or by alternate allocation (Calvert 1982; Chan 1963; Chen 1987; Mathew 2012; Taavoni 2011; Williams 1980); for the remaining 14 studies, the method of sequence generation was not stated.
The methods used to conceal group allocation from those recruiting women to the trials were also frequently not described. Eight studies referred to group allocation details being contained in envelopes. In the studies by Boyle 2002, Collis 1999, Gau 2011, MacLennan 1994, and Miquelutti 2007 the envelopes were described as sealed and opaque, and in the other studies envelopes were described as plain, numbered or sealed (Ben Regaya 2010, Frenea 2004; McManus 1978). In sensitivity analysis where studies of better and poorer quality have been separated, we regarded the eight studies that gave details of allocation concealment as the better quality studies, while we regarded those studies where allocation concealment was inadequate (e.g. in the quasi‐randomised studies), or where methods were unclear as poorer quality.
Blinding
In the type of interventions we were considering (maternal positions and mobility), blinding women and their clinical carers to group allocation was not feasible. It was possible that partial blinding of outcome assessors could have been performed for some types of outcomes, but it was not clear that this was achieved in any of the included studies. The lack of blinding may introduce bias, and this should be kept in mind when interpreting the results.
Incomplete outcome data
Some studies failed to report on the outcomes of the total population recruited. An example of incomplete data is method of birth. The study by Miquelutti 2007 reported data for the number of women having spontaneous vaginal birth, but not for operative vaginal births or caesarean births. The study by Taavoni 2011 reported intention‐to‐treat data for the number of women having caesarean births, but no data were reported for the number having spontaneous vaginal or operative vaginal births.
Selective reporting
Several studies had limited outcomes to report, or claimed evidence of an outcome with little or no data to support it. For example, Bundsen 1982 concluded that telemetric monitoring (ambulation) had great value both psychologically and for medical reasons, but the only data provided was for the numbers of vacuum extractions and caesarean sections in each group. Mitre 1974 claimed that women in the sitting group had more comfort, but provided no supporting detail. In the study by Fernando 1994 no maternal outcomes were reported, and in many studies no neonatal outcomes were reported (Andrews 1990; Bundsen 1982; Karraz 2003; Mathew 2012; Phumdoung 2007; Taavoni 2011).
Other potential sources of bias
There was wide variation in the types of interventions tested in the included studies. Some authors gave very little information on the intervention employed, for example, how many centimetres dilated was the woman when the intervention was started, what exactly women were asked to do and what instructions were given to women in the control groups. Further, co‐interventions in included studies also varied. This lack of detail means that the interpretation of results is not simple and readers should bear this variability in mind when reading the results of the review.
This review update includes pooled analyses for four comparisons with more than 10 studies. We constructed funnel plots for these comparisons (Figure 3; Figure 4; Figure 5; Figure 6). Visual assessment of the plots did not show asymmetry, suggesting there is no evidence of publication bias.

Funnel plot of comparison: 1 Upright and ambulant positions versus recumbent positions and bed care, outcome: 1.1 Duration of first stage labour (hours).

Funnel plot of comparison: 1 Upright and ambulant positions versus recumbent positions and bed care, outcome: 1.8 Mode of birth: spontaneous vaginal.

Funnel plot of comparison: 1 Upright and ambulant positions versus recumbent positions and bed care, outcome: 1.15 Mode of birth: operative vaginal: all women.

Funnel plot of comparison: 1 Upright and ambulant positions versus recumbent positions and bed care, outcome: 1.22 Mode of birth: caesarean birth.
Effects of interventions
See: Summary of findings for the main comparison Summary of Outcomes
Comparison 1: Upright and ambulant positions versus recumbent positions and bed care (without epidural: all women) ‐ 18 trials, 3337 women.
Primary outcomes
Duration of the first stage of labour
The duration of the first stage of labour varied considerably within and between trials. There were high levels of heterogeneity when studies were pooled (I2 = 93%). Hence, results need to be interpreted with caution. In view of the high levels of heterogeneity, we used a random‐effects model for these analyses.
Overall the first stage of labour was approximately one hour and twenty‐two minutes shorter for those randomised to upright compared with supine and recumbent positions. This analysis included pooled results from 15 trials (involving 2503 women) and the average effect between groups was statistically significant (average mean difference (MD) ‐1.36, 95% confidence interval (CI) ‐2.22 to ‐0.51; random‐effects, T2 = 2.39, Chi2 = 203.55, df=14, (P < 0.00001), I2 = 93%) (Analysis 1.1).
-
Subgroup analysis: Parity
The duration of first stage was approximately one hour and thirteen minutes shorter for nulliparous women randomised to upright positions compared with supine and recumbent positions (average MD ‐1.21, 95% CI ‐2.35 to ‐0.07; 12 trials, 1486 women; random‐effects, T2 = 3.42, Chi2 = 195.59, df = 11, (P < 0.00001), I2 = 94%) (Analysis 1.2). For multiparous women the duration of first stage was approximately half an hour shorter for those randomised to upright positions, but the evidence of a difference between groups did not reach statistical significance.
-
Subgroup analysis: Onset of labour
It was not possible to perform this subgroup analysis as there were no trials that reported that labour had been induced. For women with spontaneous labour, the duration of the first stage of labour was approximately one hour and twenty‐five minutes shorter for those randomised to upright compared with supine and recumbent positions (average MD ‐1.43, 95% CI ‐2.35 to ‐0.50; 11 trials, 2114 women; random‐effects, T2 = 2.08, Chi2 = 154.40, df = 10, (P < 0.00001), I2 = 94%) (Analysis 1.3).
-
Subgroup analysis: Position types and combinations
For women who were randomised to sit, compared to those who were randomised to a recumbent, supine or lateral position, the duration of the first stage of labour was approximately two hours and twenty‐three minutes shorter (average MD ‐2.39, 95% CI ‐4.06 to ‐0.72; three trials, 252 women; random‐effects, T2 = 1.96, Chi2 = 26.07, df = 2, (P < 0.00001), I2 = 92%) (Analysis 1.4).
For women who were randomised to walk, compared to those who were randomised to a recumbent, supine or lateral position, the duration of the first stage of labour was approximately three hours and fifty‐seven minutes shorter (average MD ‐3.96, 95% CI ‐5.36 to ‐2.57; three trials, 302 women; random‐effects, T2 = 1.04, Chi2 = 6.58, df = 2, (P < 0.04), I2 = 70%) (Analysis 1.4).
For women who were randomised to sit, stand, squat, kneel or walk compared with those who were randomised to a recumbent, supine or lateral position, the duration of the first stage of labour was approximately two hours and eleven minutes shorter (average MD ‐2.19, 95% CI ‐3.49 to ‐0.89; eight trials, 849 women; random‐effects, T2 = 3.24, Chi2 = 119.83, df = 7, (P < 0.00001), I2 = 94%) (Analysis 1.5). For women who were randomised to sit, stand, squat, kneel or walk compared to those who were randomised to bed care, there was no difference in the duration of the first stage of labour. There was a difference between the two subgroups, those randomised to recumbent, supine or lateral position, compared with those randomised to bed care, and substantial heterogeneity was indicated (Chi2 = 10.17, df = 1, (P = 0.001), I2 = 90.2%) (Analysis 1.5).
For women who were randomised to sit, stand, squat, kneel or walk compared to those who were randomised to a supine only position, the duration of the first stage of labour was approximately two hours and fourteen minutes shorter (average MD ‐2.24, 95% CI ‐3.23 to ‐1.26; two trials, 183 women; random‐effects, T2 = 0.36, Chi2 = 3.32, df = 1, (P = 0.07), I2 = 70%) (Analysis 1.6).
-
Sensitivity Analysis
When trials of lower quality were excluded, and women who were randomised to sit, stand, squat, kneel or walk were compared to those who were randomised to a recumbent, supine or lateral position, the duration of the first stage of labour was approximately five hours shorter. However, this analysis only included results from one trial of 200 women (average MD ‐5.00, 95% CI ‐6.05 to ‐3.95) (Analysis 1.7).
Mode of birth
Spontaneous vaginal birth
Overall, more women had a spontaneous vaginal birth when randomised to upright versus recumbent positions, but these results were not quite statistically significant (Analysis 1.8).
-
Subgroup analysis: Parity
More nulliparous women had a spontaneous vaginal birth when randomised to upright versus recumbent positions, but these results were not statistically significant (Analysis 1.9). There were no differences between subgroups of nulliparous and multiparous women (test for subgroup differences: Chi² = 0.53, df = 1 (P = 0.46), I² = 0%).
-
Subgroup analysis: Onset of labour
More women with spontaneous onset of labour had a spontaneous vaginal birth when randomised to upright versus recumbent positions, but these results were not statistically significant (Analysis 1.10). There were no differences between subgroups (test for subgroup differences: Chi² = 1.95, df = 1 (P = 0.16), I² = 48.8%).
-
Subgroup analysis: Position types and combinations
Women who were randomised to walk, compared to those who were randomised to a recumbent, supine or lateral position, were more likely to have spontaneous vaginal birth (risk ratio (RR) 1.26, 95% CI 1.11 to 1.42; three trials, 306 women; random‐effects, T2 = 0.00, Chi2 = 1.05, df = 2, (P = 0.59), I2 = 0%) (Analysis 1.11).
Women who were randomised to sit, stand, squat, kneel or walk compared to those who were randomised to a recumbent, supine or lateral position, were more likely to have spontaneous vaginal birth (RR 1.14, 95% CI 1.03 to 1.26; six trials, 746 women; random‐effects, T2 = 0.01, Chi2 = 8.33, df = 5, (P = 0.14), I2 = 40%) (Analysis 1.12). For women who were randomised to sit, stand, squat, kneel or walk compared to those who were randomised to bed care, there was no difference in the number of women achieving spontaneous vaginal birth. There was a difference between the two subgroups, those randomised to recumbent, supine or lateral position, compared with those randomised to bed care, and substantial heterogeneity was indicated (Chi2 = 5.06, df = 1, (P=0.02), I2 = 80.2%) (Analysis 1.12).
No trials comparing upright and mobile positions with supine only positions (Mitre 1974; Phumdoung 2007) reported mode of birth outcome data (Analysis 1.13).
-
Sensitivity Analysis
When trials of lower quality were excluded, and women who were randomised to sit, stand, squat, kneel or walk were compared to those who were randomised to a recumbent, supine or lateral position, women were more likely to have spontaneous vaginal birth (RR 1.20, 95% CI 1.05 to 1.38; two trials, 240 women; Chi2 = 0.42, df = 1, (P = 0.52), I2 = 0%) (Analysis 1.14).
Operative vaginal birth
Overall, fewer women had operative vaginal birth when randomised to upright versus recumbent positions, however these results were not statistically significant (Analysis 1.15).
-
Subgroup analysis: Parity
Fewer nulliparous women had operative vaginal birth when randomised to upright versus recumbent positions, however these results were not statistically significant (Analysis 1.16). There were no differences between subgroups of nulliparous and multiparous women (test for subgroup differences: Chi² = 0.00, df = 1 (P = 0.95), I² = 0%).
-
Subgroup analysis: Onset of labour
Fewer women required operative vaginal birth when randomised to upright versus recumbent positions, irrespective of onset of labour, although results were not statistically significant (Analysis 1.17). There were no differences between subgroups (test for subgroup differences: Chi² = 0.64, df = 1 (P = 0.42), I² = 0%).
-
Subgroup analysis: Position types and combinations
Women who were randomised to sit, compared to those who were randomised to a recumbent, supine or lateral position, were less likely to have operative vaginal birth (RR 0.18, 95% CI 0.04 to 0.75; two trials, 225 women; Chi2 = 0.10, df = 1, (P = 0.75), I2 = 0%) (Analysis 1.18).
Women who were randomised to walk, compared to those who were randomised to a recumbent, supine or lateral position, were less likely to have operative vaginal birth (RR 0.50, 95% CI 0.28 to 0.89; three trials, 306 women; Chi2 = 2.32, df = 2, (P = 0.31), I2 = 14%) (Analysis 1.18). There was a difference between subgroups, (Chi² = 12.06, df = 4 (P = 0.02), I² = 66.8%) (Analysis 1.18).
Women who were randomised to sit, stand, squat, kneel or walk compared to those who were randomised to a recumbent, supine or lateral position, were less likely to have operative vaginal birth (RR 0.62, 95% CI 0.43 to 0.89; six trials, 746 women; Chi2 = 6.76, df = 5, (P = 0.24), I2 = 26%) (Analysis 1.19). For women who were randomised to sit, stand, squat, kneel or walk compared to those who were randomised to bed care, there was no difference in the number of women having operative vaginal birth. There was a difference between the two subgroups, those randomised to recumbent, supine or lateral position, compared with those randomised to bed care, and substantial heterogeneity was indicated (Chi2 = 7.29, df = 1, (P=0.007), I2 = 86.3%) (Analysis 1.19).
Neither of the two trials comparing upright and mobile positions with supine only positions (Mitre 1974; Phumdoung 2007) reported mode of birth outcome data (Analysis 1.20).
-
Sensitivity Analysis
When trials of lower quality were excluded, and women who were randomised to sit, stand, squat, kneel or walk were compared to those who were randomised to a recumbent, supine or lateral position, there was no statistically significant difference (Analysis 1.21).
Caesarean birth
Overall, women encouraged to maintain upright and mobile positions had lower rates of caesarean birth compared with those in the comparison recumbent groups. The analysis included pooled results from 14 trials (including 2682 women) and the difference between groups was statistically significant (RR 0.71, 95% CI 0.54 to 0.94, Chi2 = 9.27, df = 12, (P = 0.68), I2 = 0%) (Analysis 1.22).
Subgroup analysis: Parity
Fewer women required caesarean birth, regardless of parity, but these results were not statistically significant (Analysis 1.23). There we no differences between nulliparous and multiparous women (test for subgroup differences: Chi² = 0.64, df = 1 (P = 0.42), I² = 0%).
-
Subgroup analysis: Onset of labour
Fewer women required caesarean birth, regardless of onset of labour, but these results were not statistically significant (Analysis 1.24). There were no differences between subgroups (test for subgroup differences: Chi² = 0.45, df = 1 (P = 0.50), I² = 0%).
-
Subgroup analysis: Position types and combinations
For women who were randomised to walk, compared to those who were randomised to a recumbent, supine or lateral position, those who were randomised to upright compared with recumbent positions had less caesarean births (RR 0.31, 95% CI 0.12 to 0.79; three trials, 306 women; Chi2 = 0.00, df = 1, (P = 0.97), I2 = 0%) (Analysis 1.25).
Women who were randomised to sit, stand, squat, kneel or walk compared to those who were randomised to a recumbent, supine or lateral position, were less likely to have caesarean birth, however this result did not reach significance (Analysis 1.26). Women who were randomised to sit, stand, squat, kneel or walk compared to those who were randomised to bed care, were also less likely to have caesarean birth, however these results did not reach significance. For this outcome there was no difference between the two subgroups, those randomised to recumbent, supine or lateral position, compared with those randomised to bed care, (Chi2 = 0.09, df = 1, (P = 0.77), I2 = 0%) (Analysis 1.26).
Neither of the trials comparing upright and mobile positions with supine only positions (Mitre 1974; Phumdoung 2007) reported mode of birth outcome data (Analysis 1.27).
-
Sensitivity Analysis
When trials of lower quality were excluded, women who were randomised to sit, stand, squat, kneel or walk compared to those who were randomised to a recumbent, supine or lateral position, were less likely to have caesarean birth (RR 0.35, 95% CI 0.14 to 0.86; two trials, 240 women; Chi2 = 0.63, df = 1, (P = 0.43), I2 = 0%) (Analysis 1.28).
Maternal satisfaction
While some studies collected information on satisfaction with specific aspects of care (e.g. satisfaction with position, position preference and comfort score), the results were inconclusive. (Analysis 1.30; Analysis 1.31).
Fetal and neonatal outcomes
There were no significant differences between groups in terms of fetal distress requiring immediate delivery or use of neonatal mechanical ventilation (Analysis 1.43; Analysis 1.44).
Secondary outcomes
Maternal pain and analgesia
There were no statistically significant differences between the two trials reporting pain and anxiety outcomes for women in upright positions compared to those who received bed care (Analysis 1.33; Analysis 1.35), however women in recumbent positions reported higher pain scores at 4 cm and 8 cm dilatation using a Visual Analogue Scale (VAS) and the Verbal Response Scale (VRS) in one trial (87 women) (Analysis 1.34).
There were no differences between groups in terms of complaints of discomfort (RR 0.68, 95% CI 0.12 to 3.72; three trials, 338 women; Chi2 = 9.15, df = 2, (P = 0.01), I2 = 78%) (Analysis 1.32), although the results for this outcome were very inconsistent, with results strongly in both directions reflected in the very high I2 values. A random‐effects analysis was used because of the heterogeneity, but it is important to note that the average treatment effect may not be a good summary. There were also no differences in the use of opioid analgesia (Analysis 1.29). However, women randomised to upright positions were less likely to have epidural analgesia, with the difference reaching statistical significance (RR 0.81, 95% CI 0.66 to 0.99, nine studies, 2107 women; random‐effects) (Analysis 1.29).
The amount of analgesia received by women in the two groups was measured in one trial, but the difference between groups was not statistically significant (Analysis 1.36).
Interventions in labour
Augmentation of labour using oxytocin
Women randomised to upright versus recumbent positions had less requirement for augmentation of labour, with the difference not quite reaching statistical significance (RR 0.89, 95% CI 0.76 to 1.05; eight studies, 1826 women) (Analysis 1.38). In three studies, amniotomy was carried out routinely on all women (Bundsen 1982; Chen 1987; McManus 1978) and in two studies, all women's labours were induced (Bundsen 1982; McManus 1978) (Analysis 1.39).
Duration of the second stage of labour
There was no difference between groups in the duration of the second stage of labour in the nine trials that reported this outcome (Analysis 1.37).
Maternal outcomes
No studies reported outcomes for hypotension requiring intervention Analysis 1.40. There was no difference for estimated blood loss greater than 500 mL Analysis 1.41. Women randomised to upright positions did have less use of episiotomy, but the difference did not reach statistical significance (RR 0.92, 95% CI 0.82 to 1.04; three studies, 1374 women) Analysis 1.42. No studies reported outcomes for second or third degree perineal tears Analysis 1.42.
Fetal and neonatal outcomes
There were no significant differences between groups in Apgar scores or admission to level I or II nursery (Analysis 1.45; Analysis 1.46).
Admission to neonatal intensive care units was reported in one study (200 women) as being less for babies born to mothers randomised to upright positions (RR 0.20, 95% CI 0.04 to 0.89) (Analysis 1.46).
Five studies examined perinatal deaths; three deaths were reported in one study (Chan 1963). One less death occurred in the group where mothers were assigned to upright positions, but the results were not statistically significant (Analysis 1.47).
Comparison 2: Upright and ambulant positions versus recumbent positions and bed care (with epidural: all women) ‐ seven trials, 1881 women
Primary outcomes
Duration of the first stage of labour
Duration of labour times were not used because they were recorded as either insertion of epidural time (which was highly variable) to 10 cm cervical dilatation (Frenea 2004; Vallejo 2001), or to delivery (at the end of second stage) (Collis 1999; Karraz 2003) (Analysis 2.1).
Mode of birth
Rates of spontaneous vaginal, operative vaginal and caesarean birth were similar for women randomised to upright versus recumbent positions (Analysis 2.2; Analysis 2.8; Analysis 2.14).
-
Subgroup analysis: Parity
There were no differences between subgroups of multiparous women compared to nulliparous women in spontaneous vaginal births, operative vaginal births or caesarean sections (Analysis 2.3; Analysis 2.9; Analysis 2.15).
-
Subgroup analysis: Onset of labour
Due to lack of data, it was not possible to perform subgroup analysis for onset of labour (Analysis 2.4; Analysis 2.10; Analysis 2.16).
-
Subgroup analysis: Position types and combinations
For women who were randomised to sit, stand, squat, kneel or walk compared to those who were randomised to recumbent/supine/lateral or bed care, there was no differences between subgroups in spontaneous vaginal births, operative vaginal births or caesarean sections (Analysis 2.6; Analysis 2.12; Analysis 2.18).
-
Sensitivity Analysis
There were no significant differences in the sensitivity analysis results relating to spontaneous vaginal births, operative vaginal births or caesarean births (Analysis 2.7; Analysis 2.13; Analysis 2.19).
Secondary outcomes
Maternal pain and other outcomes
There were no differences between groups in terms of number of women requiring additional bupivacaine bolus doses for pain relief (RR 0.57, 95% CI 0.22 to 1.48; two trials, 720 women; Chi2 = 7.46, df = 1, (P = 0.006), I2 = 87%) (Analysis 2.21), although the results for this outcome were very inconsistent, with results strongly in both directions reflected in the very high I2 values. A random‐effects analysis was used because of the heterogeneity, but it is important to note that the average treatment effect may not be a good summary. There were no statistically significant differences between groups in terms of the amount of analgesia women required for pain relief (Analysis 2.22), the number of women receiving oxytocin augmentation (Analysis 2.24), and the number of women experiencing hypotension (Analysis 2.26).
Neonatal outcomes
There was no information on perinatal mortality or admission to neonatal care units. There were no differences between groups in the incidence of Apgar scores of less than seven at one and five minutes (Analysis 2.31).
Discussion
The objectives of this review were to assess the effects of positions and mobility during first stage of labour on duration of labour, type of birth and other important outcomes for mothers and babies.
The decision to treat trials comparing upright with recumbent positions (Comparison 1) differently from trials comparing upright with recumbent positions whereby all women have epidural at time of study entry (Comparison 2), was based on the opinion that epidurals are associated with prolonged labour, an increased requirement for augmentation and an increased incidence of operative vaginal birth (Anim‐Somuah 2011; Kemp 2013; Simmons 2012). When mode of birth outcomes for both comparisons were pooled (Table 2), we did find that women in the Comparison 1 group were more likely to have vaginal birth (83% compared to 59%), and women in Comparison 2 group were more likely to have operative vaginal birth (26% compared to 10%), and caesarean birth (16% compared to 7%). This demonstrated a difference in comparison characteristics and affirms our decision to treat the studies differently.
| Method of birth outcomes, grouped by comparison | ||||||||||||||
|
| Comparison 1: Upright and ambulant positions versus recumbent positions and bed care | Comparison 2: Upright and ambulant positions versus recumbent positions and bed care (with epidural: all women) | ||||||||||||
|
| Upright | Recumbent | Comp. 1 | Upright | Recumbent | Comp. 2 | ||||||||
|
| n | total | % | n | total | % | Total | n | total | % | n | total | % | Total |
| Vaginal Birth | 1105 | 1306 | 85% | 1084 | 1320 | 82% | 83% | 475 | 808 | 59% | 447 | 758 | 59% | 59% |
| Operative Vaginal Birth | 125 | 1252 | 10% | 135 | 1267 | 11% | 10% | 206 | 808 | 25% | 195 | 758 | 26% | 26% |
| Caesarean Birth | 72 | 1329 | 5% | 106 | 1353 | 8% | 7% | 127 | 808 | 16% | 116 | 758 | 15% | 16% |
Summary of main results
We performed 80 meta‐analyses in order to evaluate how a variety of maternal positions used during first stage labour affect the birth process and outcomes for mothers and babies.
For Comparison 1, women who were upright or mobile compared to those who were recumbent had a shorter first stage of labour (Analysis 1.1); were less likely to have a caesarean birth (Analysis 1.22); had less pain (Analysis 1.34); were less likely to have an epidural (Analysis 1.29); and their babies were less likely to be admitted to the neonatal intensive care unit (Analysis 1.46).
Subgroup analysis demonstrated that nulliparous women and those who had spontaneous labour at trial entry were more likely to have a shorter duration of labour when upright or mobile (Analysis 1.2; Analysis 1.3). Women who laboured with sitting, standing, squatting, kneeling or walking positions, compared with supine, dorsal or lateral recumbent positions, had shorter durations of labour (Analysis 1.4; Analysis 1.5; Analysis 1.6); more spontaneous vaginal births (Analysis 1.11; Analysis 1.12); less operative births (Analysis 1.18; Analysis 1.19); and less caesarean births (Analysis 1.25).
Sensitivity analysis was performed to exclude those trials of lower quality. Comparison was made between women who used sitting, standing, squatting, kneeling or walking positions, and those who used supine, dorsal or lateral recumbent positions. This analysis confirmed that being upright or mobile during first stage labour was more likely to result in a shorter duration of first stage labour (Analysis 1.7), more likely to result in spontaneous vaginal birth (Analysis 1.14) and less likely to result in caesarean birth (Analysis 1.28).
For Comparison 2, where all women had epidural at trial entry, subgroup analysis demonstrated that nulliparous women who were upright were more likely to have operative vaginal births, compared with multiparous women who were supine (Analysis 2.9).
The outcomes of this review demonstrate benefit to the well being of mothers and babies. There is evidence that adopting an upright or mobile position during first stage labour reduces the duration of first stage, with no additional risk to mother or baby. Therefore, women in low‐risk labour should be informed of the benefits of upright positions, and encouraged and assisted to assume whatever position they choose. Moving around in labour often requires continuous one‐to‐one support from a midwife/nurse, this reduces the need for pain medication and increases the likelihood of spontaneous vaginal delivery (Hodnett 2012).
Overall completeness and applicability of evidence
When considering the results of this review, it is important to consider the new evidence that women encouraged to maintain upright positions had lower rates of caesarean birth. This is an important finding as rates of caesarean birth continue to rise worldwide and most women and healthcare clinicians would like to see a reduction in caesarean birth as the procedure is not without risk for both mother and baby. Another new finding was that babies of mothers who were upright were less likely to be admitted to the neonatal unit. However, it would be prudent to treat this finding with caution as it is based on the results of one study only.
Most of the included studies collected information on mode of birth, but few had the statistical power to detect differences between groups. Few included studies collected outcome data on review outcomes such as pain, maternal satisfaction, and neonatal outcomes. Disappointingly, the many studies reporting Apgar scores, did so by different methods and at differing end points. Most reported the numbers of babies with Apgar scores less that seven at one and or five minutes (Calvert 1982; Haukkama 1982; MacLennan 1994; McManus 1978; Miquelutti 2007; Williams 1980), but Bloom 1998 reported scores less than three at five minutes, Gau 2011 reported scores less than eight at five minutes, and others only reported scores as means (Ben Regaya 2010; Boyle 2002; Mitre 1974), meaning that outcome data could not be pooled uniformly in these instances.
Studies were carried out over a long period: from the early 1960s (Chan 1963) through to 2012 (Mathew 2012); and in a number of different healthcare settings Table 3. The cultural and healthcare context is likely to have been different at different times and in different settings, and there have also been changes in healthcare technologies. Within these changing contexts, the attitudes and expectations of healthcare staff, women and their partners towards pain, pain relief and appropriate behaviour during labour and childbirth have shifted. All of these factors are important in the interpretation of results.
| Characteristics of all studies, sorted by year of publication | |||||||||
| Author | Year | Upright | Recumbent | Country | Parity | No. | All women: epidural | All women: other | |
| 1 | Chan | 1963 | sit or walk | supine or lateral | Hong Kong | nulliparous | 200 | ||
| 2 | Mitre | 1974 | sit | supine | U.S.A. | nulliparous | 100 | ||
| 3 | Flynn | 1978 | walk | lateral | U.K. | mixed | 68 | External monitoring | |
| 4 | McManus | 1978 | walk or sit | lateral | U.K. | mixed | 40 | Induction; Amniotomy | |
| 5 | Williams | 1980 | walk | bed care | U.K. | mixed | 300 | ||
| 6 | Bundsen | 1982 | walking | bed care | Sweden | mixed | 60 | Induction; Amniotomy; Internal Monitoring | |
| 7 | Calvert | 1982 | walk or sit | bed care | U.K. | mixed | 200 | External monitoring | |
| 8 | Haukkama | 1982 | sit or walk | bed care | Finland | mixed | 60 | External monitoring | |
| 9 | Chen | 1987 | sit | dorsal or lateral | Japan | mixed | 185 | Amniotomy | |
| 10 | Andrews | 1990 | standing, walking, sitting, squatting, kneeling | supine, lateral, prone | U.S.A. | nulliparous | 40 | ||
| 11 | Fernando | 1994 | walking, standing, sitting | bed care | U.K. | nulliparous | 40 | Epidural | |
| 12 | MacLennan | 1994 | walk | bed care | Australia | mixed | 196 | External monitoring | |
| 13 | Nageotte | 1997 | walk | bed care | U.S.A. | nulliparous | 761 | Epidural | |
| 14 | Bloom | 1998 | walking as desired | bed care | U.S.A. | mixed | 1067 | ||
| 15 | Collis | 1999 | walking, standing, sitting | bed care | U.K. | nulliparous | 229 | Epidural | External Monitoring |
| 16 | Vallejo | 2001 | walk or sit | lateral | U.S.A. | nulliparous | 160 | Epidural | Induction; External Monitoring |
| 17 | Boyle | 2002 | walk | bed care | U.K. | mixed | 409 | Epidural | |
| 18 | Karraz | 2003 | walk | supine, semi supine or lateral | France | mixed | 221 | Epidural | Induction |
| 19 | Frenea | 2004 | ambulation | dorsal or lateral | France | mixed | 61 | Epidural | External Monitoring |
| 20 | Miquelutti | 2007 | stand, walk, sit, crouch, kneel | bed care | Brazil | nulliparous | 107 | ||
| 21 | Phumduong | 2007 | kneeling | supine | Thailand | nulliparous | 204 | ||
| 22 | Ben Regaya | 2010 | ambulation | dorsal or lateral | Tunisia, North Africa | nulliparous | 200 | ||
| 23 | Gau | 2011 | sitting, standing, kneeling, squatting | bed care | Taiwan | mixed | 188 | External Monitoring | |
| 24 | Taavoni | 2011 | sitting | bed care | Iran | nulliparous | 62 | ||
| 25 | Mathew | 2012 | walk or sit | dorsal or lateral | India | nulliparous | 60 | ||
Quality of the evidence
As labour is a dynamic and complex process with many physical and emotional variables, designing trials that examine interventions related to women in labour is challenging and it is difficult to avoid bias (Gupta 2000; Hollins Martin 2013; McNabb 1989; Stewart 1989). It is not possible to blind women or their caregivers to group allocation. In addition, it is difficult to standardise interventions. Due to the heterogeneity of trial interventions and participants, the inconsistencies within trials, and the variable trial quality, study findings are difficult to interpret, and the results of this review should be interpreted with caution.
For the main outcome, duration of first stage labour, there was considerable variation within and between studies in terms of average duration of first stage labour (hours). For nulliparous women means varied from 1.67 hours to 18.22 hours and for multiparous women means varied from 1.2 hours to 7.8 hours. Studies defined and measured the duration of the first stage of labour in different ways. For example, Chen 1987 recorded the duration as 5 to 10 cm, Taavoni 2011 as 4 to 8 cm, and Andrews 1990 as 4 to 9 cm.
The review included women from many countries around the world, all with differing ages, obstetric and medical histories, ethnicity, customs, beliefs and supports. There was considerable variation in the position interventions women received and how these positions were described. In the studies by Nageotte 1997 and Vallejo 2001, ambulation was defined as a minimum of five minutes of walking per hour, in the study by Frenea 2004 women were asked to walk 15 minutes each hour, and in the study by Andrews 1990 the position intervention was assumed when the woman was anywhere between 4 to 9 cm.
There was also variability in the amount of time women adhered to the protocol in terms of ambulation or staying in bed. In the study by Bloom 1998, of the 536 women assigned to the walking group only 380 women actually walked. In the study by Calvert 1982, of the 100 women assigned to telemetry, only 45 women actually got out of bed. In the study by MacLennan 1994, of the 96 women randomised to ambulate, only 37 women actually chose to ambulate for half an hour or more. In the study by Miquelutti 2007, women assigned to be upright only managed to achieve this for 57% of the time. It is clear that many of the women in these studies had difficulty maintaining the intervention position though out the whole duration of their first stage and preferred and often used alternative positions.
Further, there was also variation in the models of birth care, institutional procedures, and caregiver behaviour in relation to study protocols. In some studies, women were strongly encouraged by staff to mobilise (e.g. in the study by Miquelutti 2007 any woman in the intervention group that remained in bed for more than 30 minutes was asked to get out again) and in other studies, women had more choice and only gentle encouragement (Boyle 2002). In one study the intervention was only encouraged during the day as it was not felt that women would like to walk around at night (Karraz 2003), additionally women in the comparison group were not allowed out of bed even to walk to the toilet.
Potential biases in the review process
In order to minimise the potential for bias during the process of preparing this Cochrane Review, we have made every attempt to adhere to the study protocol (Lewis 2002). Any rationales for post hoc decisions to vary study protocol outcome data or methods of meta‐analyses are clearly stated within the review.
Agreements and disagreements with other studies or reviews
The findings of this review should be considered alongside other related Cochrane reviews focusing on care during labour (e.g. Cluett 2009; Gupta 2012; Hodnett 2012; Hunter 2007; Kemp 2013). While position in the first stage of labour may have an independent effect, the position in second stage and other variables (e.g. the presence of a birth companion) are also important.

Methodological quality graph: review authors' judgements about each methodological quality item presented as percentages across all included studies.

Methodological quality summary: review authors' judgements about each methodological quality item for each included study.

Funnel plot of comparison: 1 Upright and ambulant positions versus recumbent positions and bed care, outcome: 1.1 Duration of first stage labour (hours).
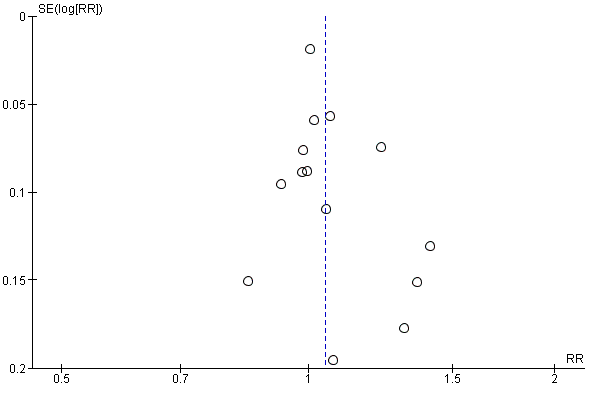
Funnel plot of comparison: 1 Upright and ambulant positions versus recumbent positions and bed care, outcome: 1.8 Mode of birth: spontaneous vaginal.
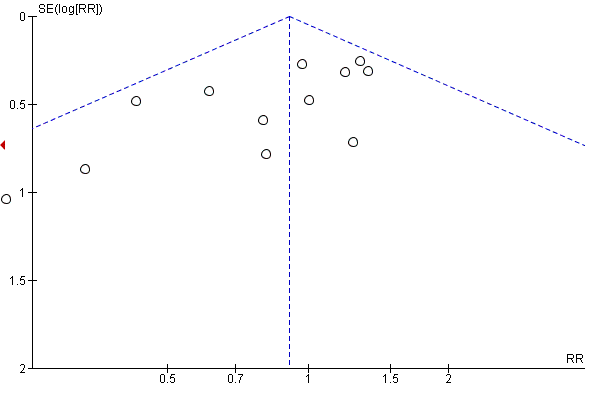
Funnel plot of comparison: 1 Upright and ambulant positions versus recumbent positions and bed care, outcome: 1.15 Mode of birth: operative vaginal: all women.

Funnel plot of comparison: 1 Upright and ambulant positions versus recumbent positions and bed care, outcome: 1.22 Mode of birth: caesarean birth.

Comparison 1 Upright and ambulant positions versus recumbent positions and bed care, Outcome 1 Duration of first stage labour (hours).

Comparison 1 Upright and ambulant positions versus recumbent positions and bed care, Outcome 2 Duration of first stage labour (hours): subgroup analysis: parity.

Comparison 1 Upright and ambulant positions versus recumbent positions and bed care, Outcome 3 Duration of first stage labour (hours): subgroup analysis: onset of labour.
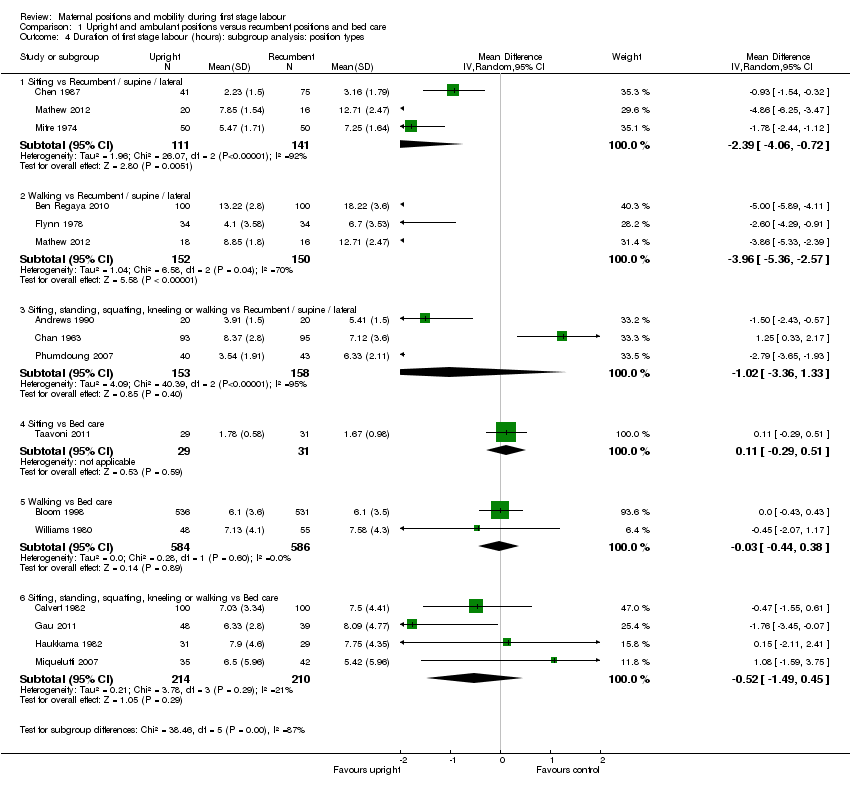
Comparison 1 Upright and ambulant positions versus recumbent positions and bed care, Outcome 4 Duration of first stage labour (hours): subgroup analysis: position types.

Comparison 1 Upright and ambulant positions versus recumbent positions and bed care, Outcome 5 Duration of first stage labour (hours): subgroup analysis: position types.
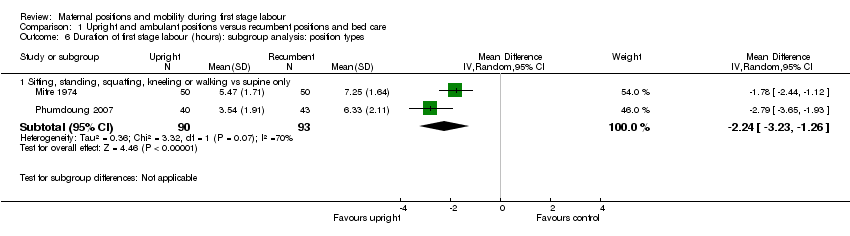
Comparison 1 Upright and ambulant positions versus recumbent positions and bed care, Outcome 6 Duration of first stage labour (hours): subgroup analysis: position types.

Comparison 1 Upright and ambulant positions versus recumbent positions and bed care, Outcome 7 Duration of first stage labour (hours): sensitivity analysis ‐ positions.

Comparison 1 Upright and ambulant positions versus recumbent positions and bed care, Outcome 8 Mode of birth: spontaneous vaginal.

Comparison 1 Upright and ambulant positions versus recumbent positions and bed care, Outcome 9 Mode of birth: spontaneous vaginal: subgroup analysis: parity.

Comparison 1 Upright and ambulant positions versus recumbent positions and bed care, Outcome 10 Mode of birth: spontaneous vaginal: subgroup analysis: onset of labour.

Comparison 1 Upright and ambulant positions versus recumbent positions and bed care, Outcome 11 Mode of birth: spontaneous vaginal: subgroup analysis: position types.

Comparison 1 Upright and ambulant positions versus recumbent positions and bed care, Outcome 12 Mode of birth: spontaneous vaginal: subgroup analysis: position types.
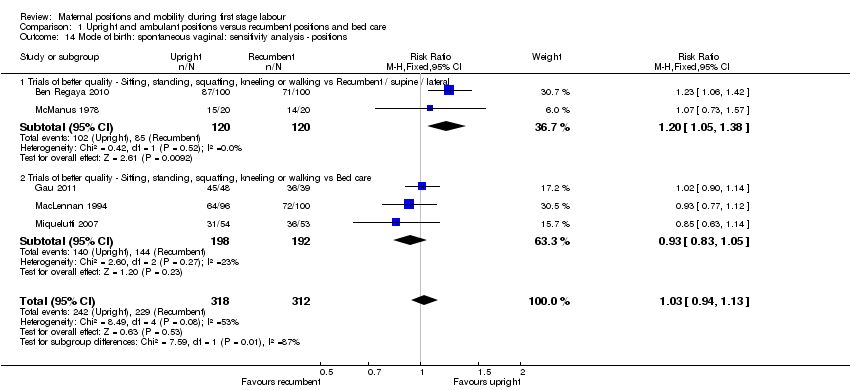
Comparison 1 Upright and ambulant positions versus recumbent positions and bed care, Outcome 14 Mode of birth: spontaneous vaginal: sensitivity analysis ‐ positions.
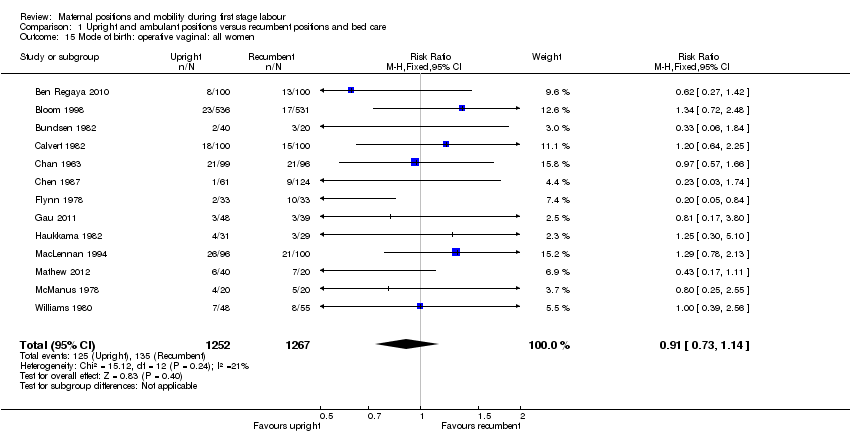
Comparison 1 Upright and ambulant positions versus recumbent positions and bed care, Outcome 15 Mode of birth: operative vaginal: all women.

Comparison 1 Upright and ambulant positions versus recumbent positions and bed care, Outcome 16 Mode of birth: operative vaginal: subgroup analysis: parity.

Comparison 1 Upright and ambulant positions versus recumbent positions and bed care, Outcome 17 Mode of birth: operative vaginal: subgroup analysis: onset of labour.

Comparison 1 Upright and ambulant positions versus recumbent positions and bed care, Outcome 18 Mode of birth: operative vaginal: subgroup analysis: position types.
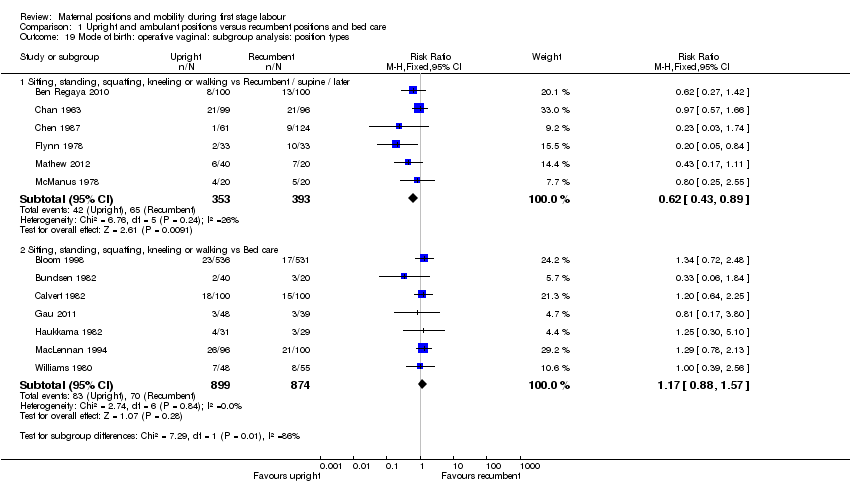
Comparison 1 Upright and ambulant positions versus recumbent positions and bed care, Outcome 19 Mode of birth: operative vaginal: subgroup analysis: position types.
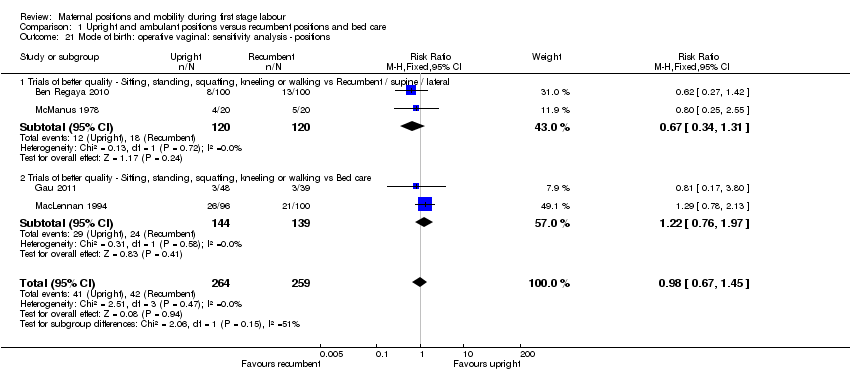
Comparison 1 Upright and ambulant positions versus recumbent positions and bed care, Outcome 21 Mode of birth: operative vaginal: sensitivity analysis ‐ positions.

Comparison 1 Upright and ambulant positions versus recumbent positions and bed care, Outcome 22 Mode of birth: caesarean birth.

Comparison 1 Upright and ambulant positions versus recumbent positions and bed care, Outcome 23 Mode of birth: caesarean birth: subgroup analysis: parity.
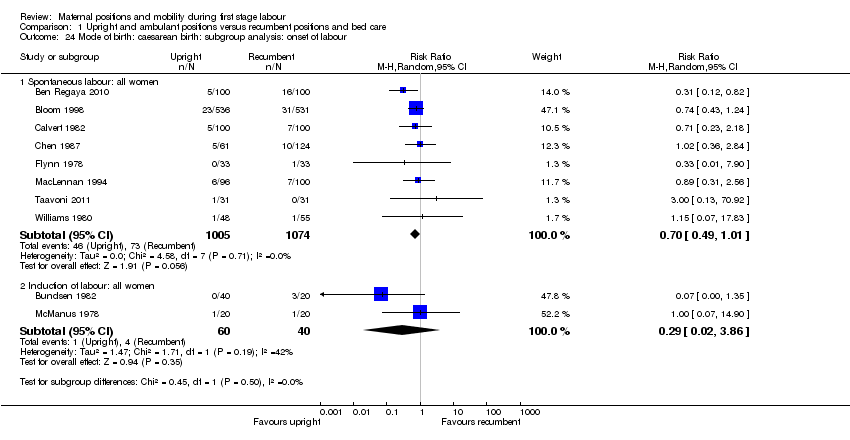
Comparison 1 Upright and ambulant positions versus recumbent positions and bed care, Outcome 24 Mode of birth: caesarean birth: subgroup analysis: onset of labour.
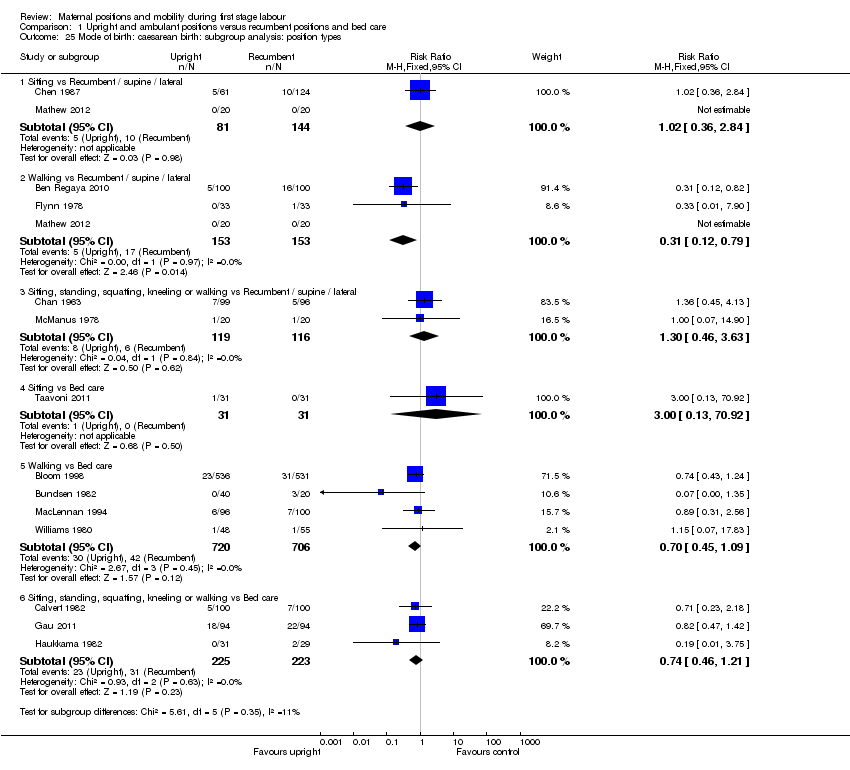
Comparison 1 Upright and ambulant positions versus recumbent positions and bed care, Outcome 25 Mode of birth: caesarean birth: subgroup analysis: position types.

Comparison 1 Upright and ambulant positions versus recumbent positions and bed care, Outcome 26 Mode of birth: caesarean birth: subgroup analysis: position types.
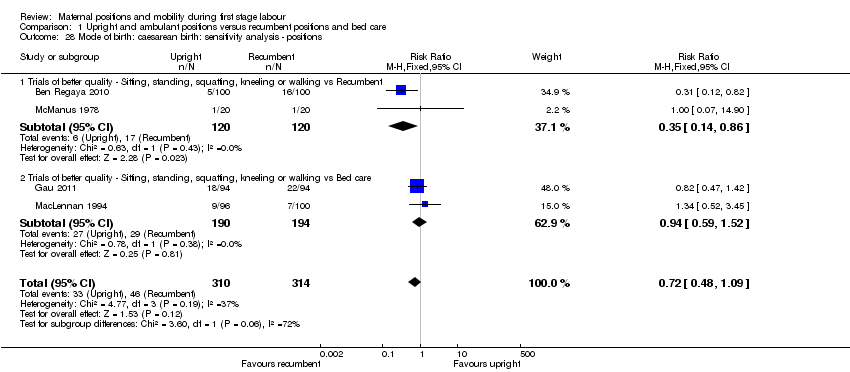
Comparison 1 Upright and ambulant positions versus recumbent positions and bed care, Outcome 28 Mode of birth: caesarean birth: sensitivity analysis ‐ positions.
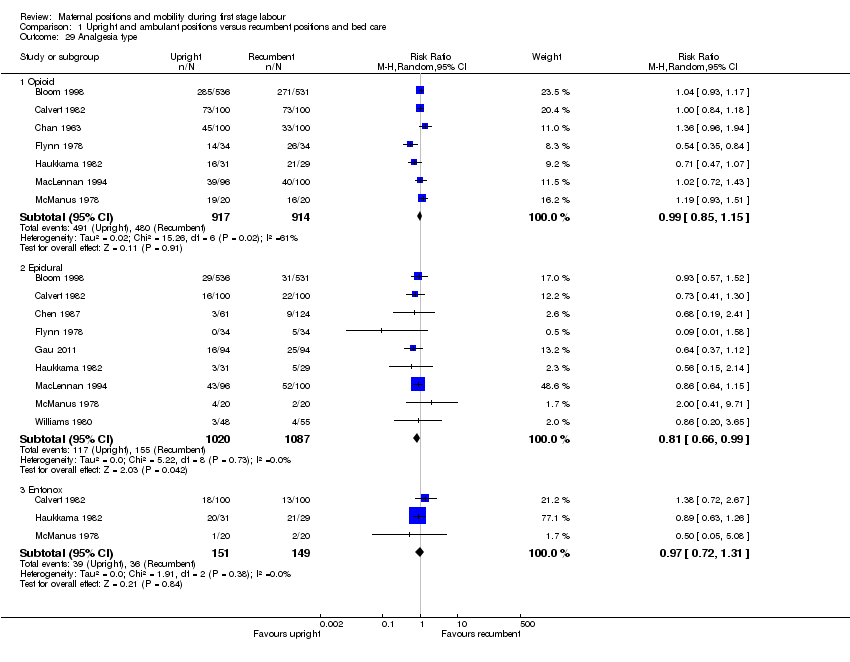
Comparison 1 Upright and ambulant positions versus recumbent positions and bed care, Outcome 29 Analgesia type.

Comparison 1 Upright and ambulant positions versus recumbent positions and bed care, Outcome 30 Maternal satisfaction.

Comparison 1 Upright and ambulant positions versus recumbent positions and bed care, Outcome 31 Maternal comfort.

Comparison 1 Upright and ambulant positions versus recumbent positions and bed care, Outcome 32 Maternal pain.
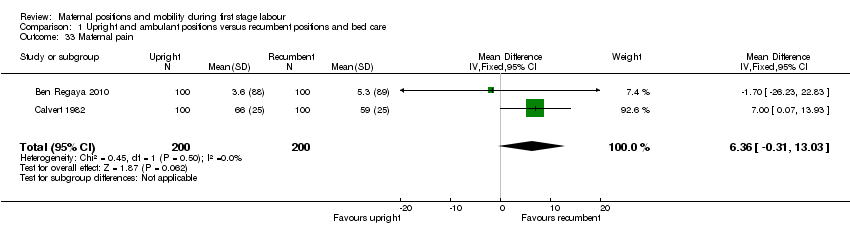
Comparison 1 Upright and ambulant positions versus recumbent positions and bed care, Outcome 33 Maternal pain.

Comparison 1 Upright and ambulant positions versus recumbent positions and bed care, Outcome 34 Maternal pain.
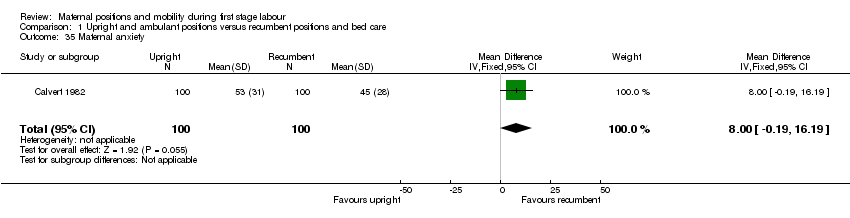
Comparison 1 Upright and ambulant positions versus recumbent positions and bed care, Outcome 35 Maternal anxiety.

Comparison 1 Upright and ambulant positions versus recumbent positions and bed care, Outcome 36 Analgesia amount.

Comparison 1 Upright and ambulant positions versus recumbent positions and bed care, Outcome 37 Duration of second stage of labour (minutes).

Comparison 1 Upright and ambulant positions versus recumbent positions and bed care, Outcome 38 Augmentation of labour using oxytocin.

Comparison 1 Upright and ambulant positions versus recumbent positions and bed care, Outcome 39 Artificial rupture of membranes.

Comparison 1 Upright and ambulant positions versus recumbent positions and bed care, Outcome 41 Estimated blood loss > 500 mL.

Comparison 1 Upright and ambulant positions versus recumbent positions and bed care, Outcome 42 Perineal trauma.

Comparison 1 Upright and ambulant positions versus recumbent positions and bed care, Outcome 43 Fetal distress (requiring immediate delivery).
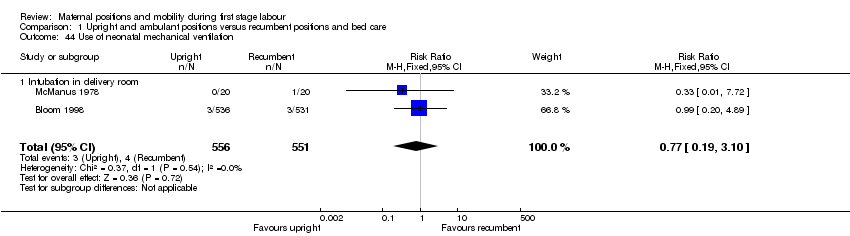
Comparison 1 Upright and ambulant positions versus recumbent positions and bed care, Outcome 44 Use of neonatal mechanical ventilation.

Comparison 1 Upright and ambulant positions versus recumbent positions and bed care, Outcome 45 Apgar scores.

Comparison 1 Upright and ambulant positions versus recumbent positions and bed care, Outcome 46 Admission to NICU.

Comparison 1 Upright and ambulant positions versus recumbent positions and bed care, Outcome 47 Perinatal mortality.

Comparison 2 Upright and ambulant positions versus recumbent positions and bed care (with epidural: all women), Outcome 2 Mode of birth: spontaneous vaginal.

Comparison 2 Upright and ambulant positions versus recumbent positions and bed care (with epidural: all women), Outcome 3 Mode of birth: spontaneous vaginal: subgroup analysis: parity.

Comparison 2 Upright and ambulant positions versus recumbent positions and bed care (with epidural: all women), Outcome 4 Mode of birth: spontaneous vaginal: subgroup analysis: onset of labour.

Comparison 2 Upright and ambulant positions versus recumbent positions and bed care (with epidural: all women), Outcome 5 Mode of birth: spontaneous vaginal: subgroup analysis: position types.

Comparison 2 Upright and ambulant positions versus recumbent positions and bed care (with epidural: all women), Outcome 6 Mode of birth: spontaneous vaginal: subgroup analysis: position types.

Comparison 2 Upright and ambulant positions versus recumbent positions and bed care (with epidural: all women), Outcome 7 Mode of birth: spontaneous vaginal: sensitivity analysis.

Comparison 2 Upright and ambulant positions versus recumbent positions and bed care (with epidural: all women), Outcome 8 Mode of birth: operative vaginal.

Comparison 2 Upright and ambulant positions versus recumbent positions and bed care (with epidural: all women), Outcome 9 Mode of birth: operative vaginal: subgroup analysis: parity.
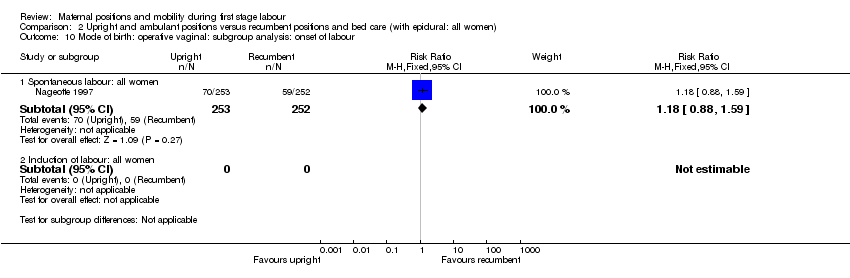
Comparison 2 Upright and ambulant positions versus recumbent positions and bed care (with epidural: all women), Outcome 10 Mode of birth: operative vaginal: subgroup analysis: onset of labour.

Comparison 2 Upright and ambulant positions versus recumbent positions and bed care (with epidural: all women), Outcome 11 Mode of birth: operative vaginal: subgroup analysis: position types.

Comparison 2 Upright and ambulant positions versus recumbent positions and bed care (with epidural: all women), Outcome 12 Mode of birth: operative vaginal: subgroup analysis: position types.

Comparison 2 Upright and ambulant positions versus recumbent positions and bed care (with epidural: all women), Outcome 13 Mode of birth: operative vaginal: sensitivity analysis.

Comparison 2 Upright and ambulant positions versus recumbent positions and bed care (with epidural: all women), Outcome 14 Mode of birth: caesarean birth.

Comparison 2 Upright and ambulant positions versus recumbent positions and bed care (with epidural: all women), Outcome 15 Mode of birth: caesarean birth: subgroup analysis: parity.

Comparison 2 Upright and ambulant positions versus recumbent positions and bed care (with epidural: all women), Outcome 16 Mode of birth: caesarean birth: subgroup analysis: onset of labour.
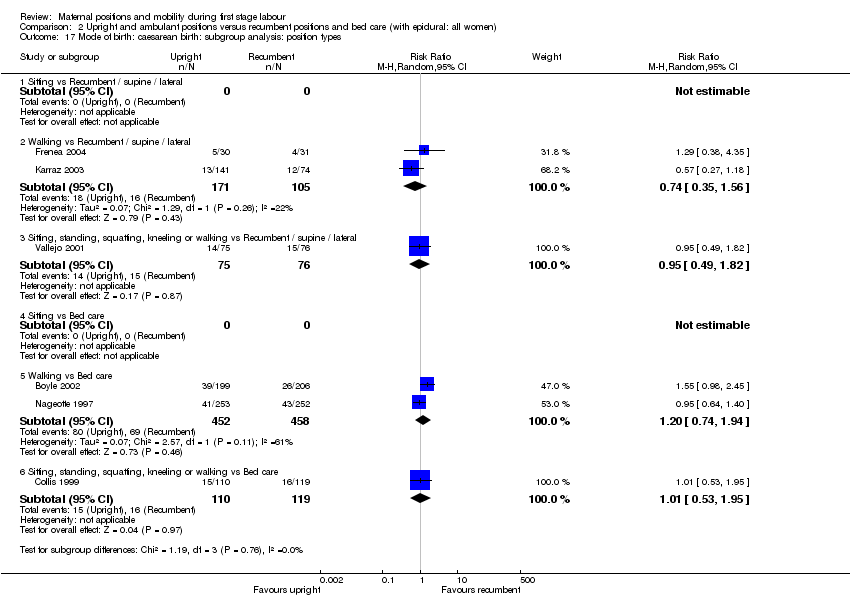
Comparison 2 Upright and ambulant positions versus recumbent positions and bed care (with epidural: all women), Outcome 17 Mode of birth: caesarean birth: subgroup analysis: position types.

Comparison 2 Upright and ambulant positions versus recumbent positions and bed care (with epidural: all women), Outcome 18 Mode of birth: caesarean birth: subgroup analysis: position types.

Comparison 2 Upright and ambulant positions versus recumbent positions and bed care (with epidural: all women), Outcome 19 Mode of birth: caesarean birth: sensitivity analysis.
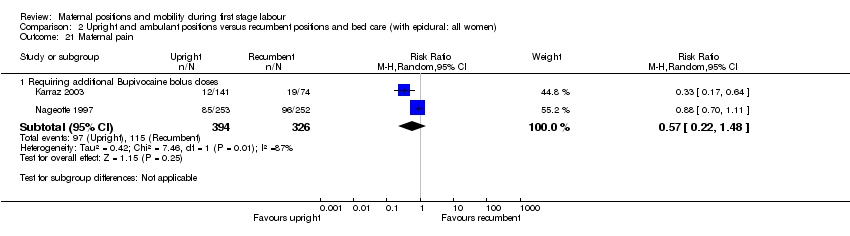
Comparison 2 Upright and ambulant positions versus recumbent positions and bed care (with epidural: all women), Outcome 21 Maternal pain.
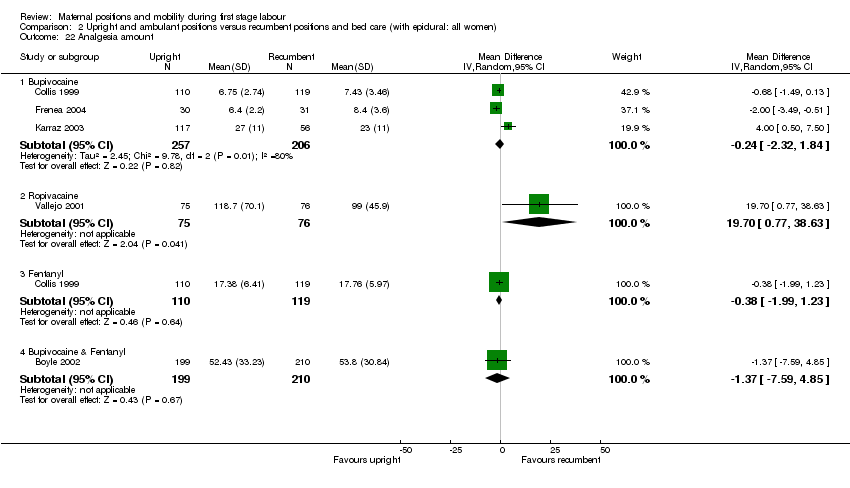
Comparison 2 Upright and ambulant positions versus recumbent positions and bed care (with epidural: all women), Outcome 22 Analgesia amount.

Comparison 2 Upright and ambulant positions versus recumbent positions and bed care (with epidural: all women), Outcome 23 Duration of second stage of labour (minutes).

Comparison 2 Upright and ambulant positions versus recumbent positions and bed care (with epidural: all women), Outcome 24 Augmentation of labour using oxytocin.

Comparison 2 Upright and ambulant positions versus recumbent positions and bed care (with epidural: all women), Outcome 26 Hypotension requiring intervention.
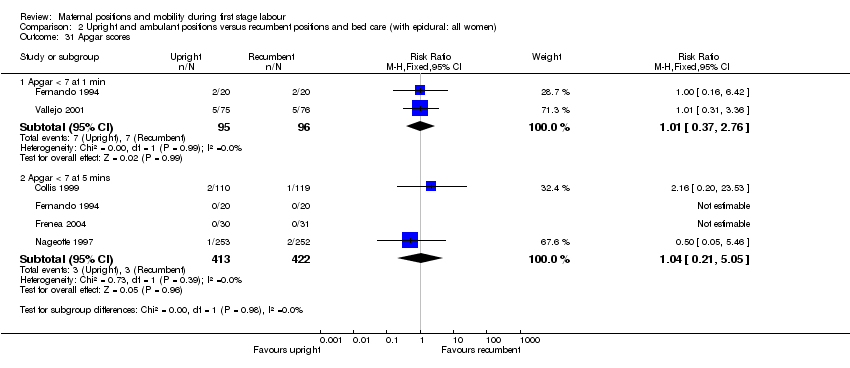
Comparison 2 Upright and ambulant positions versus recumbent positions and bed care (with epidural: all women), Outcome 31 Apgar scores.
| Comparison 1: Upright and ambulant positions versus recumbent positions and bed care Outcomes showing significance | ||
|
| Primary Outcomes | Secondary Outcomes |
| Maternal | 1. Shorter duration of labour if upright. Subgroup analysis demonstrated this when:
Sensitivity analysis, which excluded lower quality trials, comparing sitting, standing, squatting, kneeling or walking with recumbent/supine/lateral did confirm this result.
2. More likely to have a vaginal birth if upright. Subgroup analysis demonstrated this when:
Sensitivity analysis, which excluded lower quality trials, comparing sitting, standing, squatting, kneeling or walking with recumbent/supine/lateral did confirm this result. 3. Less likely to have operative birth if upright. Subgroup analysis demonstrated this when:
Sensitivity analysis, which excluded lower quality trials, did confirm this result.
3. Less likely to have caesarean birth if upright. Subgroup analysis demonstrated this when:
Sensitivity analysis, which excluded lower quality trials, comparing sitting, standing, squatting, kneeling or walking with recumbent/supine/lateral did confirm this result. | 1. Less likely to have an epidural if upright. 2. Lower pain scores if upright. 3. BUT More anxiety for nulliparous women if upright. However this outcome is only from 1 study of 206 women.
Note: there were no data for: spontaneous rupture of membranes or hypotension requiring intervention. |
| Fetal / Neonatal |
| 1. Less likely to have admission to NICU if mother is upright. |
|
| ||
| Comparison 2: Upright and ambulant positions versus recumbent positions and bed care (all women: epidural) Outcomes showing significance | ||
|
| Primary Outcomes | Secondary Outcomes |
| Maternal | 1. More likely to have operative vaginal birth if multiparous and upright (subgroup analysis: parity only). Note: there were no data for: duration of first stage labour; maternal satisfaction. |
Note: there was no data for: artificial rupture of membranes; spontaneous rupture of membranes; estimated blood loss > 500 mL; perineal trauma. |
| Fetal / Neonatal | Note: there were no data for: fetal distress requiring immediate birth or use of neonatal mechanical ventilation. | Note: there were no data for: admission to the NICU. |
| NICU: neonatal intensive care unit | ||
| Trial and participant numbers, grouped by comparison and sorted alphabetically | ||||||||
| Comparison 1: Upright and ambulant positions versus recumbent positions and bed care | Comparison 2: Upright and ambulant positions versus recumbent positions and bed care (with epidural: all women) | |||||||
| No. of studies | Author | Year | No. | No. of studies | Author | Year | No. | |
| 1 | Andrews | 1990 | 40 | 1 | Boyle | 2002 | 409 | |
| 2 | Ben Regaya | 2010 | 200 | 2 | Collis | 1999 | 229 | |
| 3 | Bloom | 1998 | 1067 | 3 | Fernando | 1994 | 40 | |
| 4 | Bundsen | 1982 | 60 | 4 | Frenea | 2004 | 61 | |
| 5 | Calvert | 1982 | 200 | 5 | Karraz | 2003 | 221 | |
| 6 | Chan | 1963 | 200 | 6 | Nageotte | 1997 | 761 | |
| 7 | Chen | 1987 | 185 | 7 | Vallejo | 2001 | 160 | |
| 8 | Flynn | 1978 | 68 | |||||
| 9 | Gau | 2011 | 188 | |||||
| 10 | Haukkama | 1982 | 60 | |||||
| 11 | MacLennan | 1994 | 196 | |||||
| 12 | Mathew | 2012 | 60 | |||||
| 13 | McManus | 1978 | 40 | |||||
| 14 | Miquelutti | 2007 | 107 | |||||
| 15 | Mitre | 1974 | 100 | |||||
| 16 | Phumduong | 2007 | 204 | |||||
| 17 | Taavoni | 2011 | 62 | |||||
| 18 | Williams | 1980 | 300 | |||||
| 18 | 3337 | 7 | 1881 | |||||
| Total number of studies for comparisons 1&2: | 25 | |||||||
| Total number of participants for comparisons 1&2: | 5218 | |||||||
| Method of birth outcomes, grouped by comparison | ||||||||||||||
|
| Comparison 1: Upright and ambulant positions versus recumbent positions and bed care | Comparison 2: Upright and ambulant positions versus recumbent positions and bed care (with epidural: all women) | ||||||||||||
|
| Upright | Recumbent | Comp. 1 | Upright | Recumbent | Comp. 2 | ||||||||
|
| n | total | % | n | total | % | Total | n | total | % | n | total | % | Total |
| Vaginal Birth | 1105 | 1306 | 85% | 1084 | 1320 | 82% | 83% | 475 | 808 | 59% | 447 | 758 | 59% | 59% |
| Operative Vaginal Birth | 125 | 1252 | 10% | 135 | 1267 | 11% | 10% | 206 | 808 | 25% | 195 | 758 | 26% | 26% |
| Caesarean Birth | 72 | 1329 | 5% | 106 | 1353 | 8% | 7% | 127 | 808 | 16% | 116 | 758 | 15% | 16% |
| Characteristics of all studies, sorted by year of publication | |||||||||
| Author | Year | Upright | Recumbent | Country | Parity | No. | All women: epidural | All women: other | |
| 1 | Chan | 1963 | sit or walk | supine or lateral | Hong Kong | nulliparous | 200 | ||
| 2 | Mitre | 1974 | sit | supine | U.S.A. | nulliparous | 100 | ||
| 3 | Flynn | 1978 | walk | lateral | U.K. | mixed | 68 | External monitoring | |
| 4 | McManus | 1978 | walk or sit | lateral | U.K. | mixed | 40 | Induction; Amniotomy | |
| 5 | Williams | 1980 | walk | bed care | U.K. | mixed | 300 | ||
| 6 | Bundsen | 1982 | walking | bed care | Sweden | mixed | 60 | Induction; Amniotomy; Internal Monitoring | |
| 7 | Calvert | 1982 | walk or sit | bed care | U.K. | mixed | 200 | External monitoring | |
| 8 | Haukkama | 1982 | sit or walk | bed care | Finland | mixed | 60 | External monitoring | |
| 9 | Chen | 1987 | sit | dorsal or lateral | Japan | mixed | 185 | Amniotomy | |
| 10 | Andrews | 1990 | standing, walking, sitting, squatting, kneeling | supine, lateral, prone | U.S.A. | nulliparous | 40 | ||
| 11 | Fernando | 1994 | walking, standing, sitting | bed care | U.K. | nulliparous | 40 | Epidural | |
| 12 | MacLennan | 1994 | walk | bed care | Australia | mixed | 196 | External monitoring | |
| 13 | Nageotte | 1997 | walk | bed care | U.S.A. | nulliparous | 761 | Epidural | |
| 14 | Bloom | 1998 | walking as desired | bed care | U.S.A. | mixed | 1067 | ||
| 15 | Collis | 1999 | walking, standing, sitting | bed care | U.K. | nulliparous | 229 | Epidural | External Monitoring |
| 16 | Vallejo | 2001 | walk or sit | lateral | U.S.A. | nulliparous | 160 | Epidural | Induction; External Monitoring |
| 17 | Boyle | 2002 | walk | bed care | U.K. | mixed | 409 | Epidural | |
| 18 | Karraz | 2003 | walk | supine, semi supine or lateral | France | mixed | 221 | Epidural | Induction |
| 19 | Frenea | 2004 | ambulation | dorsal or lateral | France | mixed | 61 | Epidural | External Monitoring |
| 20 | Miquelutti | 2007 | stand, walk, sit, crouch, kneel | bed care | Brazil | nulliparous | 107 | ||
| 21 | Phumduong | 2007 | kneeling | supine | Thailand | nulliparous | 204 | ||
| 22 | Ben Regaya | 2010 | ambulation | dorsal or lateral | Tunisia, North Africa | nulliparous | 200 | ||
| 23 | Gau | 2011 | sitting, standing, kneeling, squatting | bed care | Taiwan | mixed | 188 | External Monitoring | |
| 24 | Taavoni | 2011 | sitting | bed care | Iran | nulliparous | 62 | ||
| 25 | Mathew | 2012 | walk or sit | dorsal or lateral | India | nulliparous | 60 | ||
| Outcome or subgroup title | No. of studies | No. of participants | Statistical method | Effect size |
| 1 Duration of first stage labour (hours) Show forest plot | 15 | 2503 | Mean Difference (IV, Random, 95% CI) | ‐1.36 [‐2.22, ‐0.51] |
| 2 Duration of first stage labour (hours): subgroup analysis: parity Show forest plot | 12 | Mean Difference (IV, Random, 95% CI) | Subtotals only | |
| 2.1 Nulliparous women | 12 | 1486 | Mean Difference (IV, Random, 95% CI) | ‐1.21 [‐2.35, ‐0.07] |
| 2.2 Multiparous women | 4 | 662 | Mean Difference (IV, Random, 95% CI) | ‐0.56 [‐1.19, 0.06] |
| 3 Duration of first stage labour (hours): subgroup analysis: onset of labour Show forest plot | 11 | Mean Difference (IV, Random, 95% CI) | Subtotals only | |
| 3.1 Spontaneous labour: all women | 11 | 2114 | Mean Difference (IV, Random, 95% CI) | ‐1.43 [‐2.35, ‐0.50] |
| 3.2 Induction of labour: all women | 0 | 0 | Mean Difference (IV, Random, 95% CI) | 0.0 [0.0, 0.0] |
| 4 Duration of first stage labour (hours): subgroup analysis: position types Show forest plot | 15 | Mean Difference (IV, Random, 95% CI) | Subtotals only | |
| 4.1 Sitting vs Recumbent / supine / lateral | 3 | 252 | Mean Difference (IV, Random, 95% CI) | ‐2.39 [‐4.06, ‐0.72] |
| 4.2 Walking vs Recumbent / supine / lateral | 3 | 302 | Mean Difference (IV, Random, 95% CI) | ‐3.96 [‐5.36, ‐2.57] |
| 4.3 Sitting, standing, squatting, kneeling or walking vs Recumbent / supine / lateral | 3 | 311 | Mean Difference (IV, Random, 95% CI) | ‐1.02 [‐3.36, 1.33] |
| 4.4 Sitting vs Bed care | 1 | 60 | Mean Difference (IV, Random, 95% CI) | 0.11 [‐0.29, 0.51] |
| 4.5 Walking vs Bed care | 2 | 1170 | Mean Difference (IV, Random, 95% CI) | ‐0.03 [‐0.44, 0.38] |
| 4.6 Sitting, standing, squatting, kneeling or walking vs Bed care | 4 | 424 | Mean Difference (IV, Random, 95% CI) | ‐0.52 [‐1.49, 0.45] |
| 5 Duration of first stage labour (hours): subgroup analysis: position types Show forest plot | 15 | Mean Difference (IV, Random, 95% CI) | Subtotals only | |
| 5.1 Sitting, standing, squatting, kneeling or walking vs Recumbent / supine / lateral | 8 | 849 | Mean Difference (IV, Random, 95% CI) | ‐2.19 [‐3.49, ‐0.89] |
| 5.2 Sitting, standing, squatting, kneeling or walking vs Bed care | 7 | 1654 | Mean Difference (IV, Random, 95% CI) | ‐0.03 [‐0.30, 0.25] |
| 6 Duration of first stage labour (hours): subgroup analysis: position types Show forest plot | 2 | Mean Difference (IV, Random, 95% CI) | Subtotals only | |
| 6.1 Sitting, standing, squatting, kneeling or walking vs supine only | 2 | 183 | Mean Difference (IV, Random, 95% CI) | ‐2.24 [‐3.23, ‐1.26] |
| 7 Duration of first stage labour (hours): sensitivity analysis ‐ positions Show forest plot | 3 | 364 | Mean Difference (IV, Fixed, 95% CI) | ‐3.86 [‐4.73, ‐2.99] |
| 7.1 Trials of better quality ‐ Sitting, standing, squatting, kneeling or walking vs Recumbent / supine / lateral | 1 | 200 | Mean Difference (IV, Fixed, 95% CI) | ‐3.00 [‐6.05, ‐3.95] |
| 7.2 Trials of better quality ‐ Sitting, standing, squatting, kneeling or walking vs Bed care | 2 | 164 | Mean Difference (IV, Fixed, 95% CI) | ‐1.33 [‐2.89, 0.23] |
| 8 Mode of birth: spontaneous vaginal Show forest plot | 14 | 2626 | Risk Ratio (M‐H, Random, 95% CI) | 1.05 [0.99, 1.11] |
| 9 Mode of birth: spontaneous vaginal: subgroup analysis: parity Show forest plot | 8 | Risk Ratio (M‐H, Random, 95% CI) | Subtotals only | |
| 9.1 Nulliparous women | 8 | 1282 | Risk Ratio (M‐H, Random, 95% CI) | 1.06 [0.96, 1.17] |
| 9.2 Multiparous women | 4 | 675 | Risk Ratio (M‐H, Random, 95% CI) | 1.02 [0.99, 1.05] |
| 10 Mode of birth: spontaneous vaginal: subgroup analysis: onset of labour Show forest plot | 10 | Risk Ratio (M‐H, Random, 95% CI) | Subtotals only | |
| 10.1 Spontaneous labour: all women | 8 | 2124 | Risk Ratio (M‐H, Random, 95% CI) | 1.04 [0.97, 1.12] |
| 10.2 Induction of labour: all women | 2 | 100 | Risk Ratio (M‐H, Random, 95% CI) | 1.24 [0.98, 1.57] |
| 11 Mode of birth: spontaneous vaginal: subgroup analysis: position types Show forest plot | 14 | Risk Ratio (M‐H, Random, 95% CI) | Subtotals only | |
| 11.1 Sitting vs Recumbent / supine / lateral | 2 | 225 | Risk Ratio (M‐H, Random, 95% CI) | 1.20 [0.88, 1.64] |
| 11.2 Walking vs Recumbent / supine / lateral | 3 | 306 | Risk Ratio (M‐H, Random, 95% CI) | 1.26 [1.11, 1.42] |
| 11.3 Sitting, standing, squatting, kneeling or walking vs Recumbent / supine / lateral | 2 | 235 | Risk Ratio (M‐H, Random, 95% CI) | 1.00 [0.85, 1.17] |
| 11.4 Sitting vs Bed care | 0 | 0 | Risk Ratio (M‐H, Random, 95% CI) | 0.0 [0.0, 0.0] |
| 11.5 Walking vs Bed care | 4 | 1426 | Risk Ratio (M‐H, Random, 95% CI) | 1.01 [0.93, 1.11] |
| 11.6 Sitting, standing, squatting, kneeling or walking vs Bed care | 4 | 454 | Risk Ratio (M‐H, Random, 95% CI) | 1.00 [0.92, 1.08] |
| 12 Mode of birth: spontaneous vaginal: subgroup analysis: position types Show forest plot | 14 | Risk Ratio (M‐H, Random, 95% CI) | Subtotals only | |
| 12.1 Sitting, standing, squatting, kneeling or walking vs Recumbent / supine / lateral | 6 | 746 | Risk Ratio (M‐H, Random, 95% CI) | 1.14 [1.03, 1.26] |
| 12.2 Sitting, standing, squatting, kneeling or walking vs Bed care | 8 | 1880 | Risk Ratio (M‐H, Random, 95% CI) | 1.00 [0.97, 1.04] |
| 13 Mode of birth: spontaneous vaginal: subgroup analysis: position types | 0 | Risk Ratio (M‐H, Random, 95% CI) | Subtotals only | |
| 13.1 Sitting, standing, squatting, kneeling or walking vs supine only | 0 | 0 | Risk Ratio (M‐H, Random, 95% CI) | 0.0 [0.0, 0.0] |
| 14 Mode of birth: spontaneous vaginal: sensitivity analysis ‐ positions Show forest plot | 5 | 630 | Risk Ratio (M‐H, Fixed, 95% CI) | 1.03 [0.94, 1.13] |
| 14.1 Trials of better quality ‐ Sitting, standing, squatting, kneeling or walking vs Recumbent / supine / lateral | 2 | 240 | Risk Ratio (M‐H, Fixed, 95% CI) | 1.2 [1.05, 1.38] |
| 14.2 Trials of better quality ‐ Sitting, standing, squatting, kneeling or walking vs Bed care | 3 | 390 | Risk Ratio (M‐H, Fixed, 95% CI) | 0.93 [0.83, 1.05] |
| 15 Mode of birth: operative vaginal: all women Show forest plot | 13 | 2519 | Risk Ratio (M‐H, Fixed, 95% CI) | 0.91 [0.73, 1.14] |
| 16 Mode of birth: operative vaginal: subgroup analysis: parity Show forest plot | 7 | Risk Ratio (M‐H, Fixed, 95% CI) | Subtotals only | |
| 16.1 Nulliparous women | 7 | 1175 | Risk Ratio (M‐H, Fixed, 95% CI) | 0.87 [0.65, 1.18] |
| 16.2 Multiparous women | 4 | 675 | Risk Ratio (M‐H, Fixed, 95% CI) | 0.91 [0.24, 3.51] |
| 17 Mode of birth: operative vaginal: subgroup analysis: onset of labour Show forest plot | 9 | Risk Ratio (M‐H, Random, 95% CI) | Subtotals only | |
| 17.1 Spontaneous labour: all women | 7 | 2017 | Risk Ratio (M‐H, Random, 95% CI) | 0.93 [0.62, 1.39] |
| 17.2 Induction of labour: all women | 2 | 100 | Risk Ratio (M‐H, Random, 95% CI) | 0.61 [0.23, 1.58] |
| 18 Mode of birth: operative vaginal: subgroup analysis: position types Show forest plot | 13 | Risk Ratio (M‐H, Fixed, 95% CI) | Subtotals only | |
| 18.1 Sitting vs Recumbent / supine / lateral | 2 | 225 | Risk Ratio (M‐H, Fixed, 95% CI) | 0.18 [0.04, 0.75] |
| 18.2 Walking vs Recumbent / supine / lateral | 3 | 306 | Risk Ratio (M‐H, Fixed, 95% CI) | 0.5 [0.28, 0.89] |
| 18.3 Sitting, standing, squatting, kneeling or walking vs Recumbent / supine / later | 2 | 235 | Risk Ratio (M‐H, Fixed, 95% CI) | 0.94 [0.58, 1.52] |
| 18.4 Sitting vs Bed care | 0 | 0 | Risk Ratio (M‐H, Fixed, 95% CI) | 0.0 [0.0, 0.0] |
| 18.5 Walking vs Bed care | 4 | 1426 | Risk Ratio (M‐H, Fixed, 95% CI) | 1.19 [0.84, 1.68] |
| 18.6 Sitting, standing, squatting, kneeling or walking vs Bed care | 3 | 347 | Risk Ratio (M‐H, Fixed, 95% CI) | 1.15 [0.67, 1.96] |
| 19 Mode of birth: operative vaginal: subgroup analysis: position types Show forest plot | 13 | Risk Ratio (M‐H, Fixed, 95% CI) | Subtotals only | |
| 19.1 Sitting, standing, squatting, kneeling or walking vs Recumbent / supine / later | 6 | 746 | Risk Ratio (M‐H, Fixed, 95% CI) | 0.62 [0.43, 0.89] |
| 19.2 Sitting, standing, squatting, kneeling or walking vs Bed care | 7 | 1773 | Risk Ratio (M‐H, Fixed, 95% CI) | 1.17 [0.88, 1.57] |
| 20 Mode of birth: operative vaginal: subgroup analysis: position types | 0 | Risk Ratio (M‐H, Fixed, 95% CI) | Subtotals only | |
| 20.1 Sitting, standing, squatting, kneeling or walking vs supine only | 0 | 0 | Risk Ratio (M‐H, Fixed, 95% CI) | 0.0 [0.0, 0.0] |
| 21 Mode of birth: operative vaginal: sensitivity analysis ‐ positions Show forest plot | 4 | 523 | Risk Ratio (M‐H, Fixed, 95% CI) | 0.98 [0.67, 1.45] |
| 21.1 Trials of better quality ‐ Sitting, standing, squatting, kneeling or walking vs Recumbent / supine / lateral | 2 | 240 | Risk Ratio (M‐H, Fixed, 95% CI) | 0.67 [0.34, 1.31] |
| 21.2 Trials of better quality ‐ Sitting, standing, squatting, kneeling or walking vs Bed care | 2 | 283 | Risk Ratio (M‐H, Fixed, 95% CI) | 1.22 [0.76, 1.97] |
| 22 Mode of birth: caesarean birth Show forest plot | 14 | 2682 | Risk Ratio (M‐H, Fixed, 95% CI) | 0.71 [0.54, 0.94] |
| 23 Mode of birth: caesarean birth: subgroup analysis: parity Show forest plot | 8 | Risk Ratio (M‐H, Fixed, 95% CI) | Subtotals only | |
| 23.1 Nulliparous women | 8 | 1237 | Risk Ratio (M‐H, Fixed, 95% CI) | 0.79 [0.52, 1.18] |
| 23.2 Multiparous women | 4 | 675 | Risk Ratio (M‐H, Fixed, 95% CI) | 0.55 [0.22, 1.38] |
| 24 Mode of birth: caesarean birth: subgroup analysis: onset of labour Show forest plot | 10 | Risk Ratio (M‐H, Random, 95% CI) | Subtotals only | |
| 24.1 Spontaneous labour: all women | 8 | 2079 | Risk Ratio (M‐H, Random, 95% CI) | 0.70 [0.49, 1.01] |
| 24.2 Induction of labour: all women | 2 | 100 | Risk Ratio (M‐H, Random, 95% CI) | 0.29 [0.02, 3.86] |
| 25 Mode of birth: caesarean birth: subgroup analysis: position types Show forest plot | 14 | Risk Ratio (M‐H, Fixed, 95% CI) | Subtotals only | |
| 25.1 Sitting vs Recumbent / supine / lateral | 2 | 225 | Risk Ratio (M‐H, Fixed, 95% CI) | 1.02 [0.36, 2.84] |
| 25.2 Walking vs Recumbent / supine / lateral | 3 | 306 | Risk Ratio (M‐H, Fixed, 95% CI) | 0.31 [0.12, 0.79] |
| 25.3 Sitting, standing, squatting, kneeling or walking vs Recumbent / supine / lateral | 2 | 235 | Risk Ratio (M‐H, Fixed, 95% CI) | 1.30 [0.46, 3.63] |
| 25.4 Sitting vs Bed care | 1 | 62 | Risk Ratio (M‐H, Fixed, 95% CI) | 3.0 [0.13, 70.92] |
| 25.5 Walking vs Bed care | 4 | 1426 | Risk Ratio (M‐H, Fixed, 95% CI) | 0.70 [0.45, 1.09] |
| 25.6 Sitting, standing, squatting, kneeling or walking vs Bed care | 3 | 448 | Risk Ratio (M‐H, Fixed, 95% CI) | 0.74 [0.46, 1.21] |
| 26 Mode of birth: caesarean birth: subgroup analysis: position types Show forest plot | 14 | Risk Ratio (M‐H, Fixed, 95% CI) | Subtotals only | |
| 26.1 Sitting, standing, squatting, kneeling or walking vs Recumbent / supine / lateral | 6 | 746 | Risk Ratio (M‐H, Fixed, 95% CI) | 0.67 [0.39, 1.15] |
| 26.2 Sitting, standing, squatting, kneeling or walking vs Bed care | 8 | 1936 | Risk Ratio (M‐H, Fixed, 95% CI) | 0.73 [0.53, 1.02] |
| 27 Mode of birth: caesarean birth: subgroup analysis: position types | 0 | Risk Ratio (M‐H, Fixed, 95% CI) | Subtotals only | |
| 27.1 Sitting, standing, squatting, kneeling or walking vs supine only | 0 | 0 | Risk Ratio (M‐H, Fixed, 95% CI) | 0.0 [0.0, 0.0] |
| 28 Mode of birth: caesarean birth: sensitivity analysis ‐ positions Show forest plot | 4 | 624 | Risk Ratio (M‐H, Fixed, 95% CI) | 0.72 [0.48, 1.09] |
| 28.1 Trials of better quality ‐ Sitting, standing, squatting, kneeling or walking vs Recumbent | 2 | 240 | Risk Ratio (M‐H, Fixed, 95% CI) | 0.35 [0.14, 0.86] |
| 28.2 Trials of better quality ‐ Sitting, standing, squatting, kneeling or walking vs Bed care | 2 | 384 | Risk Ratio (M‐H, Fixed, 95% CI) | 0.94 [0.59, 1.52] |
| 29 Analgesia type Show forest plot | 10 | Risk Ratio (M‐H, Random, 95% CI) | Subtotals only | |
| 29.1 Opioid | 7 | 1831 | Risk Ratio (M‐H, Random, 95% CI) | 0.99 [0.85, 1.15] |
| 29.2 Epidural | 9 | 2107 | Risk Ratio (M‐H, Random, 95% CI) | 0.81 [0.66, 0.99] |
| 29.3 Entonox | 3 | 300 | Risk Ratio (M‐H, Random, 95% CI) | 0.97 [0.72, 1.31] |
| 30 Maternal satisfaction Show forest plot | 1 | Risk Ratio (M‐H, Fixed, 95% CI) | Subtotals only | |
| 30.1 Satisfaction with position reported at 6 cm | 1 | 107 | Risk Ratio (M‐H, Fixed, 95% CI) | 1.31 [0.60, 2.85] |
| 30.2 Preferred upright position | 1 | 107 | Risk Ratio (M‐H, Fixed, 95% CI) | 1.25 [0.97, 1.61] |
| 31 Maternal comfort Show forest plot | 1 | 40 | Mean Difference (IV, Fixed, 95% CI) | 0.74 [‐0.27, 1.75] |
| 31.1 Comfort score | 1 | 40 | Mean Difference (IV, Fixed, 95% CI) | 0.74 [‐0.27, 1.75] |
| 32 Maternal pain Show forest plot | 6 | Risk Ratio (M‐H, Random, 95% CI) | Subtotals only | |
| 32.1 Complaints of discomfort/labour more uncomfortable | 3 | 338 | Risk Ratio (M‐H, Random, 95% CI) | 0.68 [0.12, 3.72] |
| 32.2 Requiring analgesia | 4 | 1536 | Risk Ratio (M‐H, Random, 95% CI) | 0.95 [0.84, 1.08] |
| 33 Maternal pain Show forest plot | 2 | 400 | Mean Difference (IV, Fixed, 95% CI) | 6.36 [‐0.31, 13.03] |
| 34 Maternal pain Show forest plot | 2 | Mean Difference (IV, Fixed, 95% CI) | Subtotals only | |
| 34.1 Visual Analogue Scale (VAS) Score | 1 | 60 | Mean Difference (IV, Fixed, 95% CI) | ‐1.74 [‐2.51, ‐0.97] |
| 34.2 Visual Analogue Scale (VAS) Score @ 4 cm | 1 | 87 | Mean Difference (IV, Fixed, 95% CI) | ‐2.0 [‐2.70, ‐1.30] |
| 34.3 Visual Analogue Scale (VAS) Score @ 8 cm | 1 | 87 | Mean Difference (IV, Fixed, 95% CI) | ‐1.70 [‐2.20, ‐1.20] |
| 34.4 Verbal Response Scale (VRS) Score @ 4 cm | 1 | 87 | Mean Difference (IV, Fixed, 95% CI) | ‐10.40 [‐13.27, ‐7.53] |
| 34.5 Verbal Response Scale (VRS) Score@ 8 cm | 1 | 87 | Mean Difference (IV, Fixed, 95% CI) | ‐5.00 [‐11.33, ‐2.67] |
| 34.6 Present Pain Intensity Scale (PPI) @ 4 cm | 1 | 87 | Mean Difference (IV, Fixed, 95% CI) | ‐1.40 [‐3.61, 0.81] |
| 34.7 Present Pain Intensity Scale (PPI) @ 8 cm | 1 | 87 | Mean Difference (IV, Fixed, 95% CI) | ‐0.80 [‐3.76, 2.16] |
| 35 Maternal anxiety Show forest plot | 1 | 200 | Mean Difference (IV, Fixed, 95% CI) | 8.0 [‐0.19, 16.19] |
| 36 Analgesia amount Show forest plot | 1 | 40 | Mean Difference (IV, Fixed, 95% CI) | ‐17.5 [‐36.89, 1.89] |
| 36.1 Narcotics and other analgesia | 1 | 40 | Mean Difference (IV, Fixed, 95% CI) | ‐17.5 [‐36.89, 1.89] |
| 37 Duration of second stage of labour (minutes) Show forest plot | 9 | 2077 | Mean Difference (IV, Random, 95% CI) | ‐3.71 [‐9.37, 1.94] |
| 38 Augmentation of labour using oxytocin Show forest plot | 8 | 1826 | Risk Ratio (M‐H, Fixed, 95% CI) | 0.89 [0.76, 1.05] |
| 39 Artificial rupture of membranes Show forest plot | 4 | 276 | Risk Ratio (M‐H, Fixed, 95% CI) | 1.02 [0.95, 1.10] |
| 40 Hypotension requiring intervention | 0 | 0 | Risk Ratio (M‐H, Fixed, 95% CI) | 0.0 [0.0, 0.0] |
| 41 Estimated blood loss > 500 mL Show forest plot | 2 | 240 | Risk Ratio (M‐H, Fixed, 95% CI) | 0.71 [0.14, 3.55] |
| 42 Perineal trauma Show forest plot | 3 | Risk Ratio (M‐H, Fixed, 95% CI) | Subtotals only | |
| 42.1 Episiotomy | 3 | 1374 | Risk Ratio (M‐H, Fixed, 95% CI) | 0.92 [0.82, 1.04] |
| 42.2 Second‐degree tears | 0 | 0 | Risk Ratio (M‐H, Fixed, 95% CI) | 0.0 [0.0, 0.0] |
| 42.3 Third‐degree tears | 0 | 0 | Risk Ratio (M‐H, Fixed, 95% CI) | 0.0 [0.0, 0.0] |
| 43 Fetal distress (requiring immediate delivery) Show forest plot | 6 | 1757 | Risk Ratio (M‐H, Fixed, 95% CI) | 0.69 [0.35, 1.33] |
| 44 Use of neonatal mechanical ventilation Show forest plot | 2 | 1107 | Risk Ratio (M‐H, Fixed, 95% CI) | 0.77 [0.19, 3.10] |
| 44.1 Intubation in delivery room | 2 | 1107 | Risk Ratio (M‐H, Fixed, 95% CI) | 0.77 [0.19, 3.10] |
| 45 Apgar scores Show forest plot | 8 | Risk Ratio (M‐H, Fixed, 95% CI) | Subtotals only | |
| 45.1 Apgar < 4 at birth | 1 | 40 | Risk Ratio (M‐H, Fixed, 95% CI) | 0.2 [0.01, 3.92] |
| 45.2 Apgar < 7 at 1 min | 6 | 706 | Risk Ratio (M‐H, Fixed, 95% CI) | 0.84 [0.54, 1.31] |
| 45.3 Apgar < 7 at 5 mins | 4 | 466 | Risk Ratio (M‐H, Fixed, 95% CI) | 3.27 [0.34, 31.05] |
| 45.4 Apgar < 3 at 5 mins | 1 | 1067 | Risk Ratio (M‐H, Fixed, 95% CI) | 0.0 [0.0, 0.0] |
| 45.5 Apgar < 8 at 5 mins | 1 | 87 | Risk Ratio (M‐H, Fixed, 95% CI) | 0.12 [0.01, 2.19] |
| 46 Admission to NICU Show forest plot | 2 | 396 | Risk Ratio (M‐H, Fixed, 95% CI) | 0.58 [0.25, 1.36] |
| 46.1 Admission to NICU | 1 | 200 | Risk Ratio (M‐H, Fixed, 95% CI) | 0.2 [0.04, 0.89] |
| 46.2 Admission to Level I or II nursery | 1 | 196 | Risk Ratio (M‐H, Fixed, 95% CI) | 1.56 [0.45, 5.37] |
| 47 Perinatal mortality Show forest plot | 5 | 1564 | Risk Ratio (M‐H, Fixed, 95% CI) | 0.50 [0.05, 5.37] |
| Outcome or subgroup title | No. of studies | No. of participants | Statistical method | Effect size |
| 1 Duration of first stage labour: (minutes) | 0 | 0 | Mean Difference (IV, Fixed, 95% CI) | 0.0 [0.0, 0.0] |
| 2 Mode of birth: spontaneous vaginal Show forest plot | 6 | 1566 | Risk Ratio (M‐H, Fixed, 95% CI) | 0.96 [0.89, 1.05] |
| 3 Mode of birth: spontaneous vaginal: subgroup analysis: parity Show forest plot | 4 | Risk Ratio (M‐H, Fixed, 95% CI) | Subtotals only | |
| 3.1 Nulliparous women | 4 | 1179 | Risk Ratio (M‐H, Fixed, 95% CI) | 0.94 [0.84, 1.04] |
| 3.2 Multiparous women | 1 | 111 | Risk Ratio (M‐H, Fixed, 95% CI) | 1.02 [0.81, 1.27] |
| 4 Mode of birth: spontaneous vaginal: subgroup analysis: onset of labour Show forest plot | 1 | Risk Ratio (M‐H, Random, 95% CI) | Subtotals only | |
| 4.1 Spontaneous labour: all women | 1 | 505 | Risk Ratio (M‐H, Random, 95% CI) | 0.94 [0.81, 1.09] |
| 4.2 Induction of labour: all women | 0 | 0 | Risk Ratio (M‐H, Random, 95% CI) | 0.0 [0.0, 0.0] |
| 5 Mode of birth: spontaneous vaginal: subgroup analysis: position types Show forest plot | 6 | Risk Ratio (M‐H, Random, 95% CI) | Subtotals only | |
| 5.1 Sitting vs Recumbent / supine / lateral | 0 | 0 | Risk Ratio (M‐H, Random, 95% CI) | 0.0 [0.0, 0.0] |
| 5.2 Walking vs Recumbent / supine / lateral | 2 | 276 | Risk Ratio (M‐H, Random, 95% CI) | 1.02 [0.81, 1.28] |
| 5.3 Sitting, standing, squatting, kneeling or walking vs Recumbent / supine / lateral | 1 | 151 | Risk Ratio (M‐H, Random, 95% CI) | 0.92 [0.75, 1.13] |
| 5.4 Sitting vs Bed care | 0 | 0 | Risk Ratio (M‐H, Random, 95% CI) | 0.0 [0.0, 0.0] |
| 5.5 Walking vs Bed care | 2 | 910 | Risk Ratio (M‐H, Random, 95% CI) | 0.93 [0.83, 1.06] |
| 5.6 Sitting, standing, squatting, kneeling or walking vs Bed care | 1 | 229 | Risk Ratio (M‐H, Random, 95% CI) | 1.00 [0.78, 1.27] |
| 6 Mode of birth: spontaneous vaginal: subgroup analysis: position types Show forest plot | 6 | Risk Ratio (M‐H, Random, 95% CI) | Subtotals only | |
| 6.1 Sitting, standing, squatting, kneeling or walking vs Recumbent / supine / lateral | 3 | 427 | Risk Ratio (M‐H, Random, 95% CI) | 0.99 [0.86, 1.15] |
| 6.2 Sitting, standing, squatting, kneeling or walking vs Bed care | 3 | 1139 | Risk Ratio (M‐H, Random, 95% CI) | 0.95 [0.85, 1.06] |
| 7 Mode of birth: spontaneous vaginal: sensitivity analysis Show forest plot | 3 | Risk Ratio (M‐H, Fixed, 95% CI) | Subtotals only | |
| 7.1 Trials of better quality ‐ Sitting, standing, squatting, kneeling or walking vs Recumbent / supine / lateral | 1 | 61 | Risk Ratio (M‐H, Fixed, 95% CI) | 0.85 [0.61, 1.20] |
| 7.2 Trials of better quality ‐ Sitting, standing, squatting, kneeling or walking vs Bed care | 2 | 634 | Risk Ratio (M‐H, Fixed, 95% CI) | 0.95 [0.81, 1.11] |
| 8 Mode of birth: operative vaginal Show forest plot | 6 | 1566 | Risk Ratio (M‐H, Fixed, 95% CI) | 1.06 [0.90, 1.25] |
| 9 Mode of birth: operative vaginal: subgroup analysis: parity Show forest plot | 4 | Risk Ratio (M‐H, Random, 95% CI) | Subtotals only | |
| 9.1 Nulliparous women | 4 | 1084 | Risk Ratio (M‐H, Random, 95% CI) | 1.36 [0.95, 1.94] |
| 9.2 Multiparous women | 1 | 111 | Risk Ratio (M‐H, Random, 95% CI) | 1.09 [0.49, 2.42] |
| 10 Mode of birth: operative vaginal: subgroup analysis: onset of labour Show forest plot | 1 | Risk Ratio (M‐H, Fixed, 95% CI) | Subtotals only | |
| 10.1 Spontaneous labour: all women | 1 | 505 | Risk Ratio (M‐H, Fixed, 95% CI) | 1.18 [0.88, 1.59] |
| 10.2 Induction of labour: all women | 0 | 0 | Risk Ratio (M‐H, Fixed, 95% CI) | 0.0 [0.0, 0.0] |
| 11 Mode of birth: operative vaginal: subgroup analysis: position types Show forest plot | 6 | Risk Ratio (M‐H, Random, 95% CI) | Subtotals only | |
| 11.1 Sitting vs Recumbent / supine / lateral | 0 | 0 | Risk Ratio (M‐H, Random, 95% CI) | 0.0 [0.0, 0.0] |
| 11.2 Walking vs Recumbent / supine / lateral | 2 | 276 | Risk Ratio (M‐H, Random, 95% CI) | 1.17 [0.56, 2.44] |
| 11.3 Sitting, standing, squatting, kneeling or walking vs Recumbent / supine / lateral | 1 | 151 | Risk Ratio (M‐H, Random, 95% CI) | 2.03 [0.73, 5.65] |
| 11.4 Sitting vs Bed care | 0 | 0 | Risk Ratio (M‐H, Random, 95% CI) | 0.0 [0.0, 0.0] |
| 11.5 Walking vs Bed care | 2 | 910 | Risk Ratio (M‐H, Random, 95% CI) | 1.03 [0.81, 1.31] |
| 11.6 Sitting, standing, squatting, kneeling or walking vs Bed care | 1 | 229 | Risk Ratio (M‐H, Random, 95% CI) | 1.00 [0.69, 1.45] |
| 12 Mode of birth: operative vaginal: subgroup analysis: position types Show forest plot | 6 | Risk Ratio (M‐H, Random, 95% CI) | Subtotals only | |
| 12.1 Sitting, standing, squatting, kneeling or walking vs Recumbent / supine / lateral | 3 | 427 | Risk Ratio (M‐H, Random, 95% CI) | 1.41 [0.77, 2.56] |
| 12.2 Sitting, standing, squatting, kneeling or walking vs Bed care | 3 | 1139 | Risk Ratio (M‐H, Random, 95% CI) | 1.02 [0.86, 1.20] |
| 13 Mode of birth: operative vaginal: sensitivity analysis Show forest plot | 3 | Risk Ratio (M‐H, Fixed, 95% CI) | Subtotals only | |
| 13.1 Trials of better quality ‐ Sitting, standing, squatting, kneeling or walking vs Recumbent / supine / lateral | 1 | 61 | Risk Ratio (M‐H, Fixed, 95% CI) | 1.55 [0.49, 4.95] |
| 13.2 Trials of better quality ‐ Sitting, standing, squatting, kneeling or walking vs Bed care | 2 | 634 | Risk Ratio (M‐H, Fixed, 95% CI) | 0.95 [0.77, 1.16] |
| 14 Mode of birth: caesarean birth Show forest plot | 6 | 1566 | Risk Ratio (M‐H, Fixed, 95% CI) | 1.05 [0.83, 1.32] |
| 15 Mode of birth: caesarean birth: subgroup analysis: parity Show forest plot | 4 | Risk Ratio (M‐H, Random, 95% CI) | Subtotals only | |
| 15.1 Nulliparous women | 4 | 1084 | Risk Ratio (M‐H, Random, 95% CI) | 1.14 [0.75, 1.73] |
| 15.2 Multiparous women | 1 | 206 | Risk Ratio (M‐H, Random, 95% CI) | 1.31 [0.55, 3.09] |
| 16 Mode of birth: caesarean birth: subgroup analysis: onset of labour Show forest plot | 1 | Risk Ratio (M‐H, Fixed, 95% CI) | Subtotals only | |
| 16.1 Spontaneous labour: all women | 1 | 505 | Risk Ratio (M‐H, Fixed, 95% CI) | 0.95 [0.64, 1.40] |
| 16.2 Induction of labour: all women | 0 | 0 | Risk Ratio (M‐H, Fixed, 95% CI) | 0.0 [0.0, 0.0] |
| 17 Mode of birth: caesarean birth: subgroup analysis: position types Show forest plot | 6 | Risk Ratio (M‐H, Random, 95% CI) | Subtotals only | |
| 17.1 Sitting vs Recumbent / supine / lateral | 0 | 0 | Risk Ratio (M‐H, Random, 95% CI) | 0.0 [0.0, 0.0] |
| 17.2 Walking vs Recumbent / supine / lateral | 2 | 276 | Risk Ratio (M‐H, Random, 95% CI) | 0.74 [0.35, 1.56] |
| 17.3 Sitting, standing, squatting, kneeling or walking vs Recumbent / supine / lateral | 1 | 151 | Risk Ratio (M‐H, Random, 95% CI) | 0.95 [0.49, 1.82] |
| 17.4 Sitting vs Bed care | 0 | 0 | Risk Ratio (M‐H, Random, 95% CI) | 0.0 [0.0, 0.0] |
| 17.5 Walking vs Bed care | 2 | 910 | Risk Ratio (M‐H, Random, 95% CI) | 1.20 [0.74, 1.94] |
| 17.6 Sitting, standing, squatting, kneeling or walking vs Bed care | 1 | 229 | Risk Ratio (M‐H, Random, 95% CI) | 1.01 [0.53, 1.95] |
| 18 Mode of birth: caesarean birth: subgroup analysis: position types Show forest plot | 6 | Risk Ratio (M‐H, Random, 95% CI) | Subtotals only | |
| 18.1 Sitting, standing, squatting, kneeling or walking vs Recumbent / supine / lateral | 3 | 427 | Risk Ratio (M‐H, Random, 95% CI) | 0.81 [0.52, 1.28] |
| 18.2 Sitting, standing, squatting, kneeling or walking vs Bed care | 3 | 1139 | Risk Ratio (M‐H, Random, 95% CI) | 1.15 [0.83, 1.59] |
| 19 Mode of birth: caesarean birth: sensitivity analysis Show forest plot | 3 | Risk Ratio (M‐H, Fixed, 95% CI) | Subtotals only | |
| 19.1 Trials of better quality ‐ Sitting, standing, squatting, kneeling or walking vs Recumbent / supine / lateral | 1 | 61 | Risk Ratio (M‐H, Fixed, 95% CI) | 1.29 [0.38, 4.35] |
| 19.2 Trials of better quality ‐ Sitting, standing, squatting, kneeling or walking vs Bed care | 2 | 634 | Risk Ratio (M‐H, Fixed, 95% CI) | 1.35 [0.93, 1.96] |
| 20 Maternal satisfaction | 0 | 0 | Risk Ratio (M‐H, Fixed, 95% CI) | 0.0 [0.0, 0.0] |
| 21 Maternal pain Show forest plot | 2 | Risk Ratio (M‐H, Random, 95% CI) | Subtotals only | |
| 21.1 Requiring additional Bupivocaine bolus doses | 2 | 720 | Risk Ratio (M‐H, Random, 95% CI) | 0.57 [0.22, 1.48] |
| 22 Analgesia amount Show forest plot | 5 | Mean Difference (IV, Random, 95% CI) | Subtotals only | |
| 22.1 Bupivocaine | 3 | 463 | Mean Difference (IV, Random, 95% CI) | ‐0.24 [‐2.32, 1.84] |
| 22.2 Ropivacaine | 1 | 151 | Mean Difference (IV, Random, 95% CI) | 19.70 [0.77, 38.63] |
| 22.3 Fentanyl | 1 | 229 | Mean Difference (IV, Random, 95% CI) | ‐0.38 [‐1.99, 1.23] |
| 22.4 Bupivocaine & Fentanyl | 1 | 409 | Mean Difference (IV, Random, 95% CI) | ‐1.37 [‐7.59, 4.85] |
| 23 Duration of second stage of labour (minutes) Show forest plot | 2 | 204 | Mean Difference (IV, Fixed, 95% CI) | 2.35 [‐15.22, 19.91] |
| 24 Augmentation of labour using oxytocin Show forest plot | 5 | 1161 | Risk Ratio (M‐H, Fixed, 95% CI) | 0.98 [0.90, 1.07] |
| 25 Artificial rupture of membranes | 0 | 0 | Risk Ratio (M‐H, Fixed, 95% CI) | 0.0 [0.0, 0.0] |
| 26 Hypotension requiring intervention Show forest plot | 3 | 781 | Risk Ratio (M‐H, Fixed, 95% CI) | 1.12 [0.52, 2.45] |
| 27 Estimated blood loss > 500 mL | 0 | 0 | Risk Ratio (M‐H, Fixed, 95% CI) | 0.0 [0.0, 0.0] |
| 28 Perineal trauma | 0 | Risk Ratio (M‐H, Fixed, 95% CI) | Totals not selected | |
| 28.1 Episiotomy | 0 | Risk Ratio (M‐H, Fixed, 95% CI) | 0.0 [0.0, 0.0] | |
| 28.2 Second‐degree tears | 0 | Risk Ratio (M‐H, Fixed, 95% CI) | 0.0 [0.0, 0.0] | |
| 28.3 Third‐degree tears | 0 | Risk Ratio (M‐H, Fixed, 95% CI) | 0.0 [0.0, 0.0] | |
| 29 Fetal distress (requiring immediate delivery) | 0 | 0 | Risk Ratio (M‐H, Fixed, 95% CI) | 0.0 [0.0, 0.0] |
| 30 Use of neonatal mechanical ventilation | 0 | 0 | Risk Ratio (M‐H, Fixed, 95% CI) | 0.0 [0.0, 0.0] |
| 31 Apgar scores Show forest plot | 5 | Risk Ratio (M‐H, Fixed, 95% CI) | Subtotals only | |
| 31.1 Apgar < 7 at 1 min | 2 | 191 | Risk Ratio (M‐H, Fixed, 95% CI) | 1.01 [0.37, 2.76] |
| 31.2 Apgar < 7 at 5 mins | 4 | 835 | Risk Ratio (M‐H, Fixed, 95% CI) | 1.04 [0.21, 5.05] |
| 32 Admission to NICU | 0 | 0 | Risk Ratio (M‐H, Fixed, 95% CI) | 0.0 [0.0, 0.0] |
| 33 Perinatal mortality | 0 | 0 | Risk Ratio (M‐H, Fixed, 95% CI) | 0.0 [0.0, 0.0] |