Presión del fondo uterino durante el período expulsivo del trabajo de parto
Información
- DOI:
- https://doi.org/10.1002/14651858.CD006067.pub3Copiar DOI

- Base de datos:
-
- Cochrane Database of Systematic Reviews
- Versión publicada:
-
- 07 marzo 2017see what's new
- Tipo:
-
- Intervention
- Etapa:
-
- Review
- Grupo Editorial Cochrane:
-
Grupo Cochrane de Embarazo y parto
- Copyright:
-
- Copyright © 2018 The Cochrane Collaboration. Published by John Wiley & Sons, Ltd.
Cifras del artículo
Altmetric:
Citado por:
Autores
Contributions of authors
E Verheijen assessed the studies for inclusion, extracted data and wrote an earlier version of the review. J Raven assessed the studies for inclusion, extracted data and commented on drafts of the earlier version. GJ Hofmeyr initiated the protocol and review, designed the data‐extraction form and contributed to the development of the review by commenting on drafts.
A Cuthbert and J Vogel assessed studies for inclusion and extracted data for the current version (except for studies in which J Vogel was involved). A Cuthbert conducted the first analysis and interpretation of data for the current version. J Vogel, GJ Hofmeyr and Mandisa Singata reviewed and contributed to the interpretation and the final manuscript.
GJ Hofmeyr is now the contact person and guarantor for this review.
Sources of support
Internal sources
-
No sources of support supplied
External sources
-
UNDP‐UNFPA‐UNICEF‐WHO‐World Bank Special Programme of Research, Development and Research Training in Human Reproduction (HRP), Department of Reproductive Health and Research (RHR), World Health Organization, Switzerland.
Declarations of interest
GJH is an author of one included (Novikova 2009) and one ongoing study (Hofmeyr 2015), but he has not participated in assessment of or data extraction from these studies.
JV is the research project manager on the ongoing Gentle Assisted Pushing Trial (Hofmeyr 2015). No other conflicts of interest to declare.
AC is a research assistant working in the editorial base of Cochrane Pregnancy and Childbirth. She is employed by the University of Liverpool to work as a research assistant in Cochrane Pregnancy and Childbirth (who receives infrastructure funding from the NIHR, UK). She has no other conflicts of interest to declare.
MS is an author of one included (Novikova 2009) and one ongoing study (Hofmeyr 2015), but she has not participated in assessment of or data extraction from these studies.
Acknowledgements
Thanks to Caroline Summers for translating Schulz‐Lobmeyr 1999.
Thanks to Huang Kun for translating Zhao 1991.
The authors would like to acknowledge the enthusiastic contribution of Princess Jafta to the initial version of this review before her untimely death in February 2009, and this review is dedicated to her. Princess Jafta assessed the early studies for inclusion and extracted data.
The authors would also like to thank Therese Dowswell for her assistance with data extraction and support.
As part of the pre‐publication editorial process, this updated review has been commented on by three peers (an editor and two referees who are external to the editorial team), a member of Cochrane Pregnancy and Childbirth's international panel of consumers and the Group's Statistical Adviser.
This project was supported by the National Institute for Health Research, via Cochrane Infrastructure funding to Cochrane Pregnancy and Childbirth. The views and opinions expressed therein are those of the authors and do not necessarily reflect those of the Systematic Reviews Programme, NIHR, NHS or the Department of Health.
The World Health Organization, GJ Hofmeyr, A Cuthbert and M Singata retain copyright and all other rights in their respective contributions to the manuscript of this Review as submitted for publication.
We acknowledge Evelyn C Verheijen and Joanna H Raven's contribution to the to the initial version of this review (Verheijen 2009).
Version history
| Published | Title | Stage | Authors | Version |
| 2017 Mar 07 | Fundal pressure during the second stage of labour | Review | G Justus Hofmeyr, Joshua P Vogel, Anna Cuthbert, Mandisa Singata | |
| 2009 Oct 07 | Fundal pressure during the second stage of labour | Review | Evelyn C Verheijen, Joanna H Raven, G Justus Hofmeyr | |
| 2009 Jul 08 | Fundal pressure for shortening the second stage of labour | Protocol | Evelyn C Verheijen, Joanna H Raven, G Justus Hofmeyr | |
Differences between protocol and review
The background of the protocol has been updated and the methods have been updated to incorporate the current standard methods for Cochrane Pregnancy and Childbirth. We have included the use of GRADE to assess the quality of the body of evidence and included 'Summary of findings' tables (summary of findings Table for the main comparison; summary of findings Table 2).
New co‐authors have joined the review team for this update and Justus Hofmeyr has taken over the role of contact person and guarantor for the review.
Methods/types of interventions ‐ we have edited 'inflatable girdle' to 'inflatable belt' to make it clearer for the reader.
Keywords
MeSH
Medical Subject Headings (MeSH) Keywords
Medical Subject Headings Check Words
Female; Humans; Pregnancy;
PICO

Study flow diagram

Risk of bias summary: review authors' judgements about each risk of bias item for each included study

Risk of bias graph: review authors' judgements about each risk of bias item presented as percentages across all included studies

Comparison 1 Manual fundal pressure versus no fundal pressure, Outcome 1 No spontaneous vaginal birth within a specified time, as defined by the trial authors.

Comparison 1 Manual fundal pressure versus no fundal pressure, Outcome 2 Instrumental birth.

Comparison 1 Manual fundal pressure versus no fundal pressure, Outcome 3 Caesarean section.

Comparison 1 Manual fundal pressure versus no fundal pressure, Outcome 4 Operative birth ‐ instrumental or caesarean.
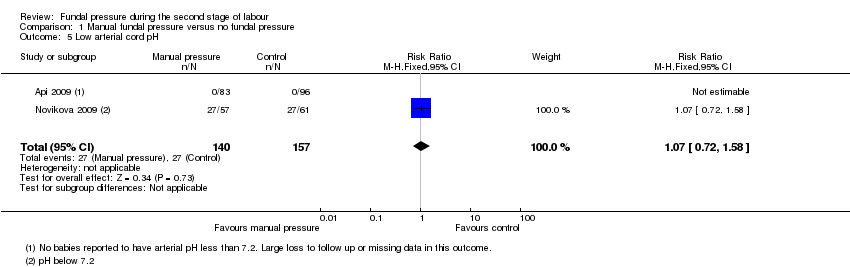
Comparison 1 Manual fundal pressure versus no fundal pressure, Outcome 5 Low arterial cord pH.

Comparison 1 Manual fundal pressure versus no fundal pressure, Outcome 6 Apgar score less than 7 at 5 minutes.

Comparison 1 Manual fundal pressure versus no fundal pressure, Outcome 7 Duration of active second stage.

Comparison 1 Manual fundal pressure versus no fundal pressure, Outcome 8 Episiotomy.

Comparison 1 Manual fundal pressure versus no fundal pressure, Outcome 9 Soft tissue damage ‐ perineal.
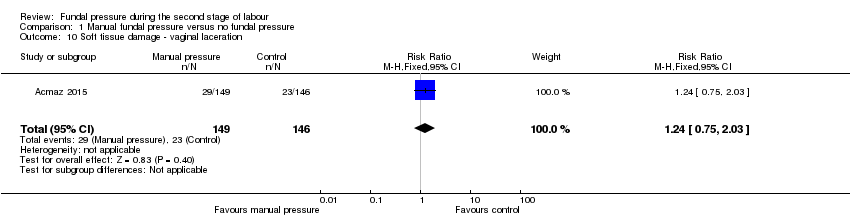
Comparison 1 Manual fundal pressure versus no fundal pressure, Outcome 10 Soft tissue damage ‐ vaginal laceration.

Comparison 1 Manual fundal pressure versus no fundal pressure, Outcome 11 Soft tissue damage ‐ cervical.

Comparison 1 Manual fundal pressure versus no fundal pressure, Outcome 12 Postpartum haemorrhage.

Comparison 1 Manual fundal pressure versus no fundal pressure, Outcome 13 Pain after enrolment as defined by trial authors.

Comparison 1 Manual fundal pressure versus no fundal pressure, Outcome 14 Neonatal trauma ‐ fractures.

Comparison 1 Manual fundal pressure versus no fundal pressure, Outcome 15 Neonatal trauma ‐ haematoma.
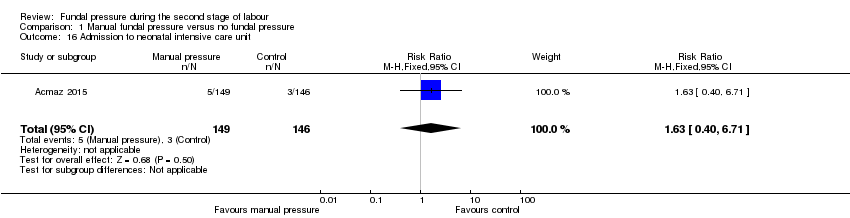
Comparison 1 Manual fundal pressure versus no fundal pressure, Outcome 16 Admission to neonatal intensive care unit.

Comparison 1 Manual fundal pressure versus no fundal pressure, Outcome 17 Neonatal death.

Comparison 1 Manual fundal pressure versus no fundal pressure, Outcome 18 Sensitivity analysis: low arterial cord pH.

Comparison 2 Fundal pressure by inflatable belt versus no fundal pressure, Outcome 1 Instrumental birth.

Comparison 2 Fundal pressure by inflatable belt versus no fundal pressure, Outcome 2 Caesarean section.

Comparison 2 Fundal pressure by inflatable belt versus no fundal pressure, Outcome 3 Operative birth ‐ instrumental or caesarean section.
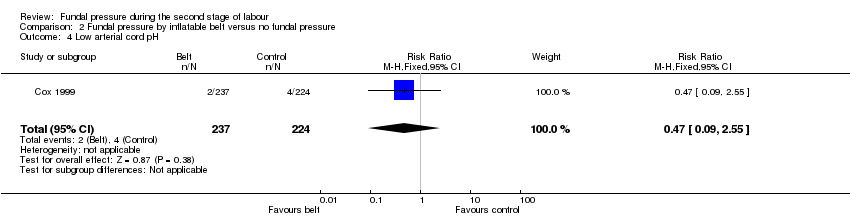
Comparison 2 Fundal pressure by inflatable belt versus no fundal pressure, Outcome 4 Low arterial cord pH.

Comparison 2 Fundal pressure by inflatable belt versus no fundal pressure, Outcome 5 Apgar score less than 7 after 5 minutes.

Comparison 2 Fundal pressure by inflatable belt versus no fundal pressure, Outcome 6 Duration of second stage.

Comparison 2 Fundal pressure by inflatable belt versus no fundal pressure, Outcome 7 Episiotomy.

Comparison 2 Fundal pressure by inflatable belt versus no fundal pressure, Outcome 8 Soft tissue damage ‐ perineal.

Comparison 2 Fundal pressure by inflatable belt versus no fundal pressure, Outcome 9 Soft tissue damage ‐ vaginal.

Comparison 2 Fundal pressure by inflatable belt versus no fundal pressure, Outcome 10 Soft tissue damage ‐ anal sphincter.
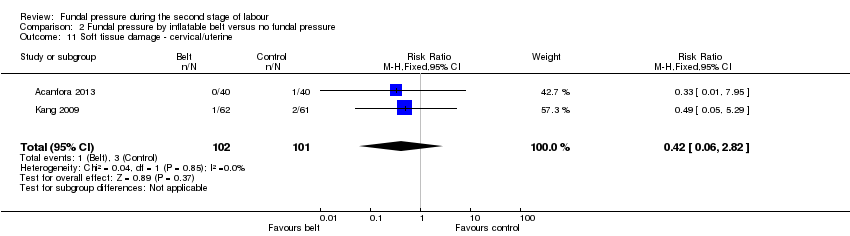
Comparison 2 Fundal pressure by inflatable belt versus no fundal pressure, Outcome 11 Soft tissue damage ‐ cervical/uterine.
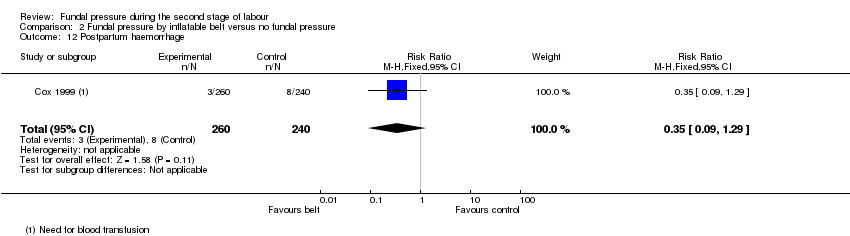
Comparison 2 Fundal pressure by inflatable belt versus no fundal pressure, Outcome 12 Postpartum haemorrhage.
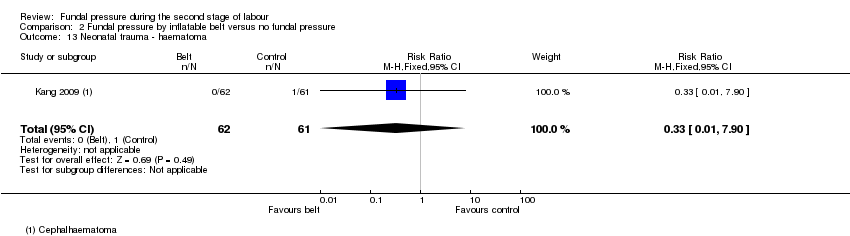
Comparison 2 Fundal pressure by inflatable belt versus no fundal pressure, Outcome 13 Neonatal trauma ‐ haematoma.
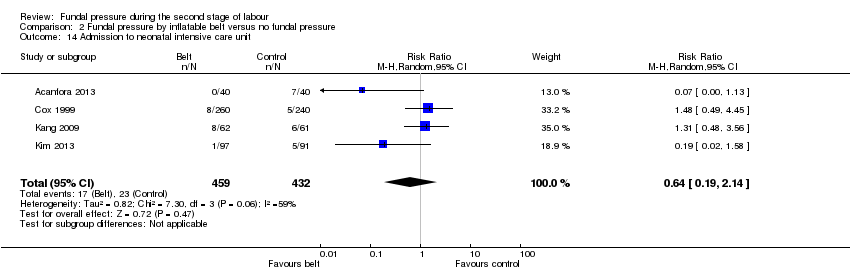
Comparison 2 Fundal pressure by inflatable belt versus no fundal pressure, Outcome 14 Admission to neonatal intensive care unit.

Comparison 2 Fundal pressure by inflatable belt versus no fundal pressure, Outcome 15 Sensitivity analysis: instrumental birth.

Comparison 2 Fundal pressure by inflatable belt versus no fundal pressure, Outcome 16 Sensitivity analysis: caesarean section.
Comparison 2 Fundal pressure by inflatable belt versus no fundal pressure, Outcome 17 Sensitivity analysis: operative delivery ‐ instrumental or caesarean section.
| Manual fundal pressure compared to no fundal pressure for the second stage of labour | ||||||
| Patient or population: women with singleton pregnancy in vertex position in second stage of labour | ||||||
| Outcomes | Anticipated absolute effects* (95% CI) | Relative effect | № of participants | Quality of the evidence | Comments | |
| Risk with no fundal pressure | Risk with manual fundal pressure | |||||
| No spontaneous vaginal birth within a specified time, as defined by the trial authors | Study population | RR 0.96 | 120 | ⊕⊝⊝⊝ | Reported as "Time from bearing down to birth of head =/>30 min or operative delivery". Data may contain instrumental births and should be interpreted with due caution | |
| 613 per 1000 | 588 per 1000 | |||||
| Operative birth ‐ Instrumental or caesarean birth | Study population | Average RR 0.66 (0.12 to 3.55) | 317 (2 RCTs) | ⊕⊝⊝⊝ | ||
| 61 per 1000 | 33 per 1000 (12 to 92) | |||||
| Low arterial cord pH | Study population | RR 1.07 | 297 | ⊕⊝⊝⊝ | ||
| 172 per 1000 | 184 per 1000 | |||||
| APGAR score less than 7 at 5 minutes | Study population | Average RR 4.48 | 2759 | ⊕⊝⊝⊝ | ||
| 5 per 1000 | 23 per 1000 | |||||
| Duration of active second stage | No absolute effects Mean duration of labour 16.6 minutes | No absolute effects Mean duration of labour 17.4 minutes | The mean duration of second stage was 0.8 minutes shorter in the fundal pressure group (3.66 minutes shorter to 2.06 minutes longer) | 194 | ⊕⊝⊝⊝ | |
| Severe maternal morbidity or death | Study population | ‐ | (0 study) | ‐ | No trial reported this outcome | |
| See comment | See comment | |||||
| Neonatal death | Study population | ‐ | 2445 | ⊕⊝⊝⊝ | Zero neonatal deaths reported in both trials | |
| See comment | See comment | |||||
| *The risk in the intervention group (and its 95% confidence interval) is based on the assumed risk in the comparison group and the relative effect of the intervention (and its 95% CI). | ||||||
| GRADE Working Group grades of evidence | ||||||
| 1 Wide confidence interval crossing the line of no effect, few events and small sample size (‐2). | ||||||
| Fundal pressure by inflatable belt compared to no fundal pressure for second stage of labour | ||||||
| Patient or population: women with singleton pregnancy in vertex position in second stage of labour | ||||||
| Outcomes | Anticipated absolute effects* (95% CI) | Relative effect | № of participants | Quality of the evidence | Comments | |
| Risk with no fundal pressure | Risk with fundal pressure by inflatable belt | |||||
| No spontaneous vaginal birth within a specified time | Study population | ‐ | (0 study) | ‐ | No trial reported this outcome | |
| See comment | See comment | |||||
| Operative birth ‐ instrumental or caesarean section | Study population | Average RR 0.62 | 891 | ⊕⊝⊝⊝ | ||
| 516 per 1000 | 320 per 1000 | |||||
| Low arterial cord pH | Study population | RR 0.47 | 461 | ⊕⊕⊝⊝ | ||
| 18 per 1000 | 8 per 1000 | |||||
| Apgar score less than 7 after 5 minutes | Study population | RR 4.62 | 500 | ⊕⊝⊝⊝ | ||
| 0 per 1000 | 0 per 1000 | |||||
| Duration of second stage (minutes) | No absolute effects | No absolute effects | The average mean duration of second stage was 50.8 minutes shorter in the inflatable belt group (94.85 minutes shorter to 6.74 minutes shorter) | 253 (2 RCTs) | ⊕⊝⊝⊝ | Acanfora 2013: mean duration of second stage was 73.47 minutes shorter for women in the inflatable belt group (86.40 minutes shorter to 60.54 minutes shorter) Kim 2013: mean duration of second stage was 28.51 minutes shorter for women in the inflatable belt group (38.50 minutes shorter to 18.52 minutes shorter) |
| Severe maternal morbidity and death | Study population | ‐ | (0 study) | ‐ | No trial reported these outcomes | |
| See comment | See comment | |||||
| Neonatal death | Study population | ‐ | (0 study) | ‐ | No trial reported this outcome | |
| See comment | See comment | |||||
| *The risk in the intervention group (and its 95% confidence interval) is based on the assumed risk in the comparison group and the relative effect of the intervention (and its 95% CI). | ||||||
| GRADE Working Group grades of evidence | ||||||
| 1 Most studies contributing data had design limitations (‐1). | ||||||
| Outcome or subgroup title | No. of studies | No. of participants | Statistical method | Effect size |
| 1 No spontaneous vaginal birth within a specified time, as defined by the trial authors Show forest plot | 1 | 120 | Risk Ratio (M‐H, Fixed, 95% CI) | 0.96 [0.71, 1.28] |
| 2 Instrumental birth Show forest plot | 1 | 197 | Risk Ratio (M‐H, Fixed, 95% CI) | 3.28 [0.14, 79.65] |
| 3 Caesarean section Show forest plot | 1 | 197 | Risk Ratio (M‐H, Fixed, 95% CI) | 1.10 [0.07, 17.27] |
| 4 Operative birth ‐ instrumental or caesarean Show forest plot | 2 | 317 | Risk Ratio (M‐H, Random, 95% CI) | 0.66 [0.12, 3.55] |
| 5 Low arterial cord pH Show forest plot | 2 | 297 | Risk Ratio (M‐H, Fixed, 95% CI) | 1.07 [0.72, 1.58] |
| 6 Apgar score less than 7 at 5 minutes Show forest plot | 4 | 2759 | Risk Ratio (M‐H, Random, 95% CI) | 4.48 [0.28, 71.45] |
| 7 Duration of active second stage Show forest plot | 1 | 194 | Mean Difference (IV, Fixed, 95% CI) | ‐0.80 [‐3.66, 2.06] |
| 8 Episiotomy Show forest plot | 2 | 317 | Risk Ratio (M‐H, Fixed, 95% CI) | 1.18 [0.92, 1.50] |
| 9 Soft tissue damage ‐ perineal Show forest plot | 1 | 209 | Risk Ratio (M‐H, Fixed, 95% CI) | 6.42 [0.79, 52.37] |
| 10 Soft tissue damage ‐ vaginal laceration Show forest plot | 1 | 295 | Risk Ratio (M‐H, Fixed, 95% CI) | 1.24 [0.75, 2.03] |
| 11 Soft tissue damage ‐ cervical Show forest plot | 1 | 295 | Risk Ratio (M‐H, Fixed, 95% CI) | 4.90 [1.09, 21.98] |
| 12 Postpartum haemorrhage Show forest plot | 1 | 120 | Risk Ratio (M‐H, Fixed, 95% CI) | 1.87 [0.58, 6.06] |
| 13 Pain after enrolment as defined by trial authors Show forest plot | 1 | 209 | Risk Ratio (M‐H, Fixed, 95% CI) | 4.54 [2.21, 9.34] |
| 14 Neonatal trauma ‐ fractures Show forest plot | 1 | 209 | Risk Ratio (M‐H, Fixed, 95% CI) | 0.0 [0.0, 0.0] |
| 15 Neonatal trauma ‐ haematoma Show forest plot | 1 | 209 | Risk Ratio (M‐H, Fixed, 95% CI) | 0.0 [0.0, 0.0] |
| 16 Admission to neonatal intensive care unit Show forest plot | 1 | 295 | Risk Ratio (M‐H, Fixed, 95% CI) | 1.63 [0.40, 6.71] |
| 17 Neonatal death Show forest plot | 2 | 2445 | Risk Ratio (M‐H, Fixed, 95% CI) | 0.0 [0.0, 0.0] |
| 18 Sensitivity analysis: low arterial cord pH Show forest plot | 1 | 118 | Risk Ratio (M‐H, Fixed, 95% CI) | 1.07 [0.72, 1.58] |
| Outcome or subgroup title | No. of studies | No. of participants | Statistical method | Effect size |
| 1 Instrumental birth Show forest plot | 4 | 891 | Risk Ratio (M‐H, Random, 95% CI) | 0.73 [0.52, 1.02] |
| 2 Caesarean section Show forest plot | 4 | 891 | Risk Ratio (M‐H, Random, 95% CI) | 0.56 [0.14, 2.26] |
| 3 Operative birth ‐ instrumental or caesarean section Show forest plot | 4 | 891 | Risk Ratio (M‐H, Random, 95% CI) | 0.62 [0.38, 1.01] |
| 4 Low arterial cord pH Show forest plot | 1 | 461 | Risk Ratio (M‐H, Fixed, 95% CI) | 0.47 [0.09, 2.55] |
| 5 Apgar score less than 7 after 5 minutes Show forest plot | 1 | 500 | Risk Ratio (M‐H, Fixed, 95% CI) | 4.62 [0.22, 95.68] |
| 6 Duration of second stage Show forest plot | 2 | 253 | Mean Difference (IV, Random, 95% CI) | ‐50.80 [‐94.85, ‐6.74] |
| 7 Episiotomy Show forest plot | 3 | 811 | Risk Ratio (M‐H, Random, 95% CI) | 0.98 [0.86, 1.12] |
| 8 Soft tissue damage ‐ perineal Show forest plot | 4 | 897 | Risk Ratio (M‐H, Random, 95% CI) | 0.53 [0.20, 1.38] |
| 9 Soft tissue damage ‐ vaginal Show forest plot | 1 | 123 | Risk Ratio (M‐H, Fixed, 95% CI) | 0.74 [0.27, 2.00] |
| 10 Soft tissue damage ‐ anal sphincter Show forest plot | 1 | 500 | Risk Ratio (M‐H, Fixed, 95% CI) | 15.69 [2.10, 117.02] |
| 11 Soft tissue damage ‐ cervical/uterine Show forest plot | 2 | 203 | Risk Ratio (M‐H, Fixed, 95% CI) | 0.42 [0.06, 2.82] |
| 12 Postpartum haemorrhage Show forest plot | 1 | 500 | Risk Ratio (M‐H, Fixed, 95% CI) | 0.35 [0.09, 1.29] |
| 13 Neonatal trauma ‐ haematoma Show forest plot | 1 | 123 | Risk Ratio (M‐H, Fixed, 95% CI) | 0.33 [0.01, 7.90] |
| 14 Admission to neonatal intensive care unit Show forest plot | 4 | 891 | Risk Ratio (M‐H, Random, 95% CI) | 0.64 [0.19, 2.14] |
| 15 Sensitivity analysis: instrumental birth Show forest plot | 3 | 811 | Risk Ratio (M‐H, Random, 95% CI) | 0.81 [0.63, 1.04] |
| 16 Sensitivity analysis: caesarean section Show forest plot | 3 | 811 | Risk Ratio (M‐H, Random, 95% CI) | 0.80 [0.20, 3.19] |
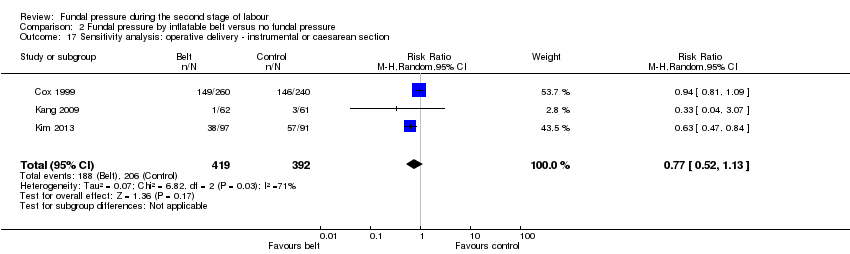
| 17 Sensitivity analysis: operative delivery ‐ instrumental or caesarean section Show forest plot | 3 | 811 | Risk Ratio (M‐H, Random, 95% CI) | 0.77 [0.52, 1.13] |