Pylorus‐preserving pancreaticoduodenectomy (pp Whipple) versus pancreaticoduodenectomy (classic Whipple) for surgical treatment of periampullary and pancreatic carcinoma
Referencias
References to studies included in this review
References to studies excluded from this review
Additional references
References to other published versions of this review
Characteristics of studies
Characteristics of included studies [ordered by study ID]
Ir a:
| Methods | Method of randomisation: unknown | |
| Participants | Age, years: 69 (47 to 76) (median and range in the PPW group); 67 (43 to 78) (median and range in the CW group) | |
| Interventions | PPW and CW (no operation details available) | |
| Outcomes | Description of outcome parameters: insufficient | |
| Notes | Country: Germany | |
| Risk of bias | ||
| Bias | Authors' judgement | Support for judgement |
| Random sequence generation (selection bias) | Unclear risk | Comment: not reported |
| Allocation concealment (selection bias) | Unclear risk | Comment: not reported |
| Blinding (performance bias and detection bias) | Unclear risk | Comment: not reported |
| Blinding of participants and personnel (performance bias) | Unclear risk | Comment: not reported |
| Blinding of outcome assessment (detection bias) | Unclear risk | Comment: not reported |
| Incomplete outcome data (attrition bias) | High risk | Comment: Postrandomisation dropouts could have influenced effect estimates |
| Selective reporting (reporting bias) | Unclear risk | Comment: no study protocol available |
| Other bias | High risk | Comment: sample size calculation not reported |
| Methods | Method of randomisation: unknown | |
| Participants | Age, years: 64.5 (48 to 77) (mean and range in the PPW group); 66.7 (46 to 84) (mean and range in the CW group) | |
| Interventions | PPW and CW (no operation details available) | |
| Outcomes | Operation time (minutes): PPW: 221 ± 35; CW: 271 ± 65 | |
| Notes | Country: Taiwan All operations performed by the same surgeon | |
| Risk of bias | ||
| Bias | Authors' judgement | Support for judgement |
| Random sequence generation (selection bias) | Unclear risk | Comment: not reported |
| Allocation concealment (selection bias) | Unclear risk | Comment: not reported |
| Blinding (performance bias and detection bias) | Unclear risk | Comment: not reported |
| Blinding of participants and personnel (performance bias) | Unclear risk | Comment: not reported |
| Blinding of outcome assessment (detection bias) | Unclear risk | Comment: not reported |
| Incomplete outcome data (attrition bias) | High risk | Comment: Postrandomisation dropouts could have influenced effect estimates |
| Selective reporting (reporting bias) | Unclear risk | Comment: no study protocol available |
| Other bias | High risk | Comment: sample size calculation not reported |
| Methods | Method of randomisation: sealed envelopes (information from study author) | |
| Participants | Age, years: unknown | |
| Interventions | Anastomoses: retrocolic end‐to‐end pancreaticojejunostomy with a drain in the pancreatic duct, end‐to‐end hepaticojejunostomy, end‐to‐end duodenojejunostomy | |
| Outcomes | Description of outcome parameters: insufficient | |
| Notes | Country: Germany | |
| Risk of bias | ||
| Bias | Authors' judgement | Support for judgement |
| Random sequence generation (selection bias) | Unclear risk | Comment: not reported |
| Allocation concealment (selection bias) | Unclear risk | Comment: "Sealed envelopes" were used (information obtained from the study author upon request) |
| Blinding (performance bias and detection bias) | Unclear risk | Comment: not reported |
| Blinding of participants and personnel (performance bias) | Unclear risk | Comment: not reported |
| Blinding of outcome assessment (detection bias) | Unclear risk | Comment: not reported |
| Incomplete outcome data (attrition bias) | Low risk | Comment: no postrandomisation dropouts reported |
| Selective reporting (reporting bias) | Unclear risk | Comment: no study protocol available |
| Other bias | High risk | Comment: sample size calculation not reported |
| Methods | Method of randomisation: sealed envelopes | |
| Participants | Age, years: 64.8 (26 to 83) (median and range in the PPW group); 65 (33 to 86) (median and range in the CW group) | |
| Interventions | Reconstruction performed by means of an interrupted 2‐layer end‐to‐side pancreatojejunostomy, an end‐to side hepaticojejunostomy 10 to 15 cm distal to the pancreatic anastomosis and an end‐to‐side gastrojejunostomy/duodenojejunostomy approximately 40 cm distal to the biliodigestive anastomosis, followed by a Braun jejunojejunostomy | |
| Outcomes | Operation time (minutes): PPW: 382 (240 to 645); CW: 449 (240 to 780) | |
| Notes | Country: Germany | |
| Risk of bias | ||
| Bias | Authors' judgement | Support for judgement |
| Random sequence generation (selection bias) | Unclear risk | Comment: not reported |
| Allocation concealment (selection bias) | Unclear risk | Comment: envelopes used for randomisation but unclear whether envelopes were opaque |
| Blinding (performance bias and detection bias) | Unclear risk | Comment: not reported |
| Blinding of participants and personnel (performance bias) | Unclear risk | Comment: not reported |
| Blinding of outcome assessment (detection bias) | Unclear risk | Comment: not reported |
| Incomplete outcome data (attrition bias) | Low risk | Comment: no postrandomisation dropouts |
| Selective reporting (reporting bias) | Unclear risk | Comment: not reported |
| Other bias | Low risk | — |
| Methods | Method of randomisation: sealed envelopes | |
| Participants | Age, years: 64 (43 to 78) (median and range in the PPW group); 62 (27 to 78) (median and range in the CW group) | |
| Interventions | End‐to‐side invaginated pancreaticojejunostomy, end‐to‐side hepaticojejunostomy, side‐to‐side gastroenterostomy or end‐to‐side pylorus‐jejunostomy | |
| Outcomes | Operation time (minutes): PPW: 300 (130 to 600); CW: 300 (160 to 480) | |
| Notes | Country: Germany | |
| Risk of bias | ||
| Bias | Authors' judgement | Support for judgement |
| Random sequence generation (selection bias) | Unclear risk | Comment: not reported |
| Allocation concealment (selection bias) | Low risk | Quote: "An equal number of blind envelopes with protocols for the SW and the PPPD resection was prepared. The envelopes were used sequentially as patients were enrolled in the study. Therefore, there was strict randomization in both arms. Randomization was carried out in the operation room: a sealed envelope was opened only after it was ascertained that both operation techniques were feasible in the patient concerned" |
| Blinding (performance bias and detection bias) | Unclear risk | Comment: not reported |
| Blinding of participants and personnel (performance bias) | Unclear risk | Comment: not reported |
| Blinding of outcome assessment (detection bias) | Unclear risk | Comment: not reported |
| Incomplete outcome data (attrition bias) | Low risk | Comment: Reasons for exclusion from long‐term survival analysis are given (e.g. non‐malignant disease) |
| Selective reporting (reporting bias) | Unclear risk | Comment: not reported |
| Other bias | Low risk | |
| Methods | Method of randomisation: unknown | |
| Participants | Age, years: 61.2 ± 7.2 (mean and SD in the PPW group); 61.6 ± 8.9 (mean and SD in the CW group) | |
| Interventions | PPW and CW (no description of procedures) | |
| Outcomes | Operation time (minutes): PPW: 206 ± 48; CW: 306 ± 54 | |
| Notes | Country: Germany | |
| Risk of bias | ||
| Bias | Authors' judgement | Support for judgement |
| Random sequence generation (selection bias) | Unclear risk | Comment: not reported |
| Allocation concealment (selection bias) | Unclear risk | Comment: not reported |
| Blinding (performance bias and detection bias) | Unclear risk | Comment: not reported |
| Blinding of participants and personnel (performance bias) | Unclear risk | Comment: not reported |
| Blinding of outcome assessment (detection bias) | Unclear risk | Comment: not reported |
| Incomplete outcome data (attrition bias) | Low risk | Comment: no postrandomisation dropouts |
| Selective reporting (reporting bias) | Unclear risk | Comment: not reported |
| Other bias | High risk | Comment: sample size calculation not reported |
CW: Classic Whipple.
DGE: Delayed gastric emptying.
LNs: Lymph nodes.
μg: Micrograms.
mL: Millilitres.
PPW: Pylorus‐preserving Whipple.
SD: Standard deviation.
Characteristics of excluded studies [ordered by study ID]
Ir a:
| Study | Reason for exclusion |
| Non‐randomised study design; no comparison of PPW versus CW | |
| No comparison of PPW versus CW | |
| Narrative review of 1 included RCT | |
| No comparison of PPW versus CW | |
| No comparison of PPW versus CW | |
| No comparison of PPW versus CW | |
| No comparison of PPW versus CW | |
| No comparison of PPW versus CW | |
| No comparison of PPW versus CW | |
| No comparison of PPW versus CW | |
| No comparison of PPW versus CW | |
| Additional publication on the same trial (Seiler 2005). No additional information | |
| No comparison of PPW versus CW | |
| Non‐randomised study design; insufficient quantitative outcome parameters | |
| Non‐randomised study design | |
| Study randomised not for the comparison of PPW versus CW |
CW: Classic Whipple.
PPW: Pylorus‐preserving Whipple.
RCT: Randomised controlled trial.
Data and analyses
| Outcome or subgroup title | No. of studies | No. of participants | Statistical method | Effect size |
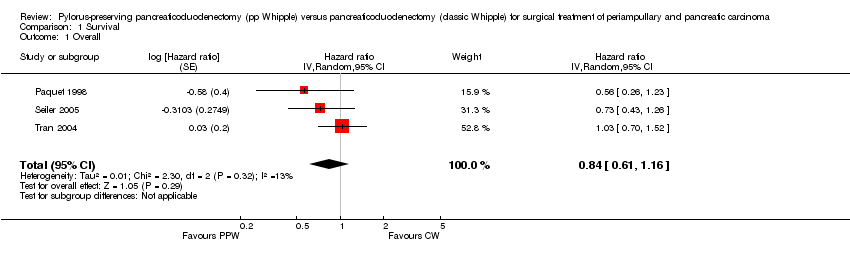
| 1 Overall Show forest plot | 3 | Hazard ratio (Random, 95% CI) | 0.84 [0.61, 1.16] | |
| Analysis 1.1  Comparison 1 Survival, Outcome 1 Overall. | ||||
| 2 Pancreatic head carcinoma Show forest plot | 3 | Hazard ratio (Random, 95% CI) | 0.73 [0.43, 1.22] | |
| Analysis 1.2  Comparison 1 Survival, Outcome 2 Pancreatic head carcinoma. | ||||
| 3 Periampullary cancer Show forest plot | 2 | Hazard ratio (Random, 95% CI) | 0.83 [0.39, 1.76] | |
| Analysis 1.3  Comparison 1 Survival, Outcome 3 Periampullary cancer. | ||||
| Outcome or subgroup title | No. of studies | No. of participants | Statistical method | Effect size |
| 1 Postoperative mortality Show forest plot | 5 | 417 | Odds Ratio (M‐H, Random, 95% CI) | 0.49 [0.17, 1.40] |
| Analysis 2.1  Comparison 2 Mortality, Outcome 1 Postoperative mortality. | ||||
| Outcome or subgroup title | No. of studies | No. of participants | Statistical method | Effect size |
| 1 Pancreatic fistula Show forest plot | 5 | 421 | Odds Ratio (M‐H, Random, 95% CI) | 0.86 [0.41, 1.81] |
| Analysis 3.1  Comparison 3 Pancreatic fistula, Outcome 1 Pancreatic fistula. | ||||
| Outcome or subgroup title | No. of studies | No. of participants | Statistical method | Effect size |
| 1 All studies Show forest plot | 5 | 412 | Odds Ratio (M‐H, Random, 95% CI) | 2.35 [0.72, 7.61] |
| Analysis 4.1  Comparison 4 Delayed gastric emptying (with sensitivity analysis), Outcome 1 All studies. | ||||
| 2 Studies in which DGE was defined (includes different definitions) Show forest plot | 3 | 328 | Odds Ratio (M‐H, Random, 95% CI) | 1.14 [0.35, 3.68] |
| Analysis 4.2  Comparison 4 Delayed gastric emptying (with sensitivity analysis), Outcome 2 Studies in which DGE was defined (includes different definitions). | ||||
| 3 Studies with the same definitions of DGE Show forest plot | 2 | 198 | Odds Ratio (M‐H, Random, 95% CI) | 4.02 [0.14, 119.16] |
| Analysis 4.3  Comparison 4 Delayed gastric emptying (with sensitivity analysis), Outcome 3 Studies with the same definitions of DGE. | ||||
| Outcome or subgroup title | No. of studies | No. of participants | Statistical method | Effect size |
| 1 Biliary leakage Show forest plot | 3 | 333 | Odds Ratio (M‐H, Random, 95% CI) | 1.35 [0.10, 18.55] |
| Analysis 5.1  Comparison 5 Biliary leakage, Outcome 1 Biliary leakage. | ||||
| Outcome or subgroup title | No. of studies | No. of participants | Statistical method | Effect size |
| 1 Intraoperative blood loss (litres) Show forest plot | 1 | 33 | Mean Difference (IV, Random, 95% CI) | ‐0.76 [‐0.96, ‐0.56] |
| Analysis 6.1  Comparison 6 Intraoperative blood loss, Outcome 1 Intraoperative blood loss (litres). | ||||
| Outcome or subgroup title | No. of studies | No. of participants | Statistical method | Effect size |
| 1 Red blood cell transfusion Show forest plot | 2 | 79 | Mean Difference (IV, Random, 95% CI) | ‐0.65 [‐1.92, 0.61] |
| Analysis 7.1  Comparison 7 Red blood cell transfusion, Outcome 1 Red blood cell transfusion. | ||||
| Outcome or subgroup title | No. of studies | No. of participants | Statistical method | Effect size |
| 1 Operating time (minutes) Show forest plot | 3 | 125 | Mean Difference (IV, Random, 95% CI) | ‐68.26 [‐105.70, ‐30.83] |
| Analysis 8.1  Comparison 8 Operating time, Outcome 1 Operating time (minutes). | ||||
| Outcome or subgroup title | No. of studies | No. of participants | Statistical method | Effect size |
| 1 Postoperative bleeding Show forest plot | 3 | 333 | Odds Ratio (M‐H, Random, 95% CI) | 0.74 [0.29, 1.88] |
| Analysis 9.1  Comparison 9 Postoperative bleeding, Outcome 1 Postoperative bleeding. | ||||
| Outcome or subgroup title | No. of studies | No. of participants | Statistical method | Effect size |
| 1 Wound infection Show forest plot | 4 | 251 | Odds Ratio (M‐H, Random, 95% CI) | 0.85 [0.35, 2.05] |
| Analysis 10.1  Comparison 10 Wound infection, Outcome 1 Wound infection. | ||||
| Outcome or subgroup title | No. of studies | No. of participants | Statistical method | Effect size |
| 1 Pulmonary complications Show forest plot | 3 | 218 | Odds Ratio (M‐H, Random, 95% CI) | 0.67 [0.29, 1.58] |
| Analysis 11.1  Comparison 11 Pulmonary complications, Outcome 1 Pulmonary complications. | ||||
| Outcome or subgroup title | No. of studies | No. of participants | Statistical method | Effect size |
| 1 Necessity for reoperation Show forest plot | 2 | 300 | Odds Ratio (M‐H, Random, 95% CI) | 0.82 [0.38, 1.75] |
| Analysis 12.1  Comparison 12 Necessity for reoperation, Outcome 1 Necessity for reoperation. | ||||
| Outcome or subgroup title | No. of studies | No. of participants | Statistical method | Effect size |
| 1 Hospital stay (days) Show forest plot | 1 | 48 | Mean Difference (IV, Random, 95% CI) | ‐1.80 [‐8.94, 5.34] |
| Analysis 13.1  Comparison 13 Hospital stay, Outcome 1 Hospital stay (days). | ||||

Risk of bias graph: review authors' judgements about each risk of bias item presented as percentages across all included studies.
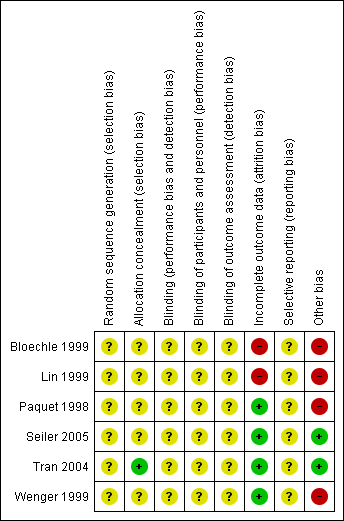
Risk of bias summary: review authors' judgements about each risk of bias item for each included study.
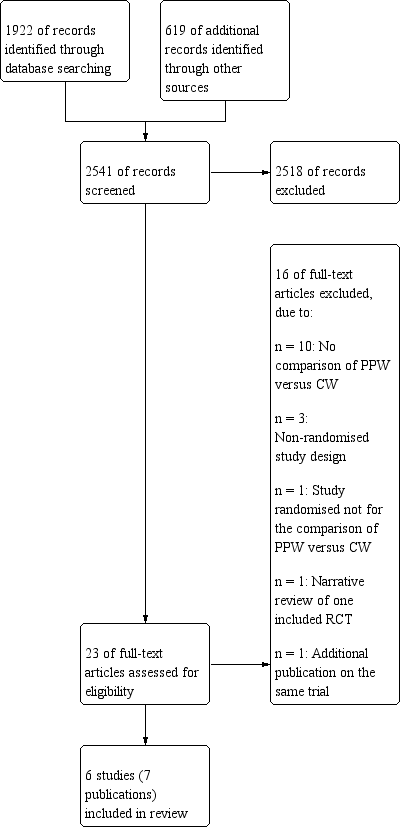
Study flow diagram.
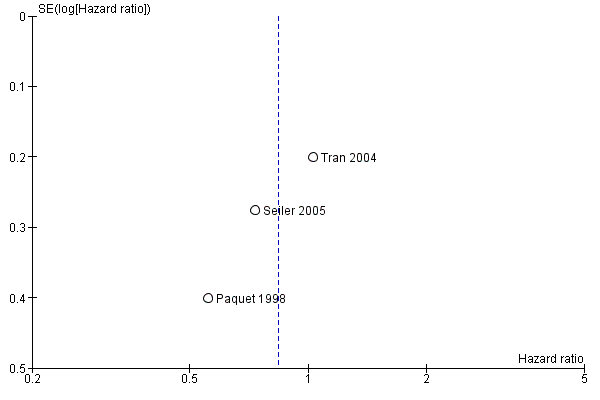
Funnel plot of comparison: 1 Survival, outcome: 1.1 Overall.

Funnel plot of comparison: 2 Mortality, outcome: 2.1 Postoperative mortality.

Funnel plot of comparison: 3 Pancreatic fistula, outcome: 3.1 Pancreatic fistula.
Comparison 1 Survival, Outcome 1 Overall.

Comparison 1 Survival, Outcome 2 Pancreatic head carcinoma.

Comparison 1 Survival, Outcome 3 Periampullary cancer.
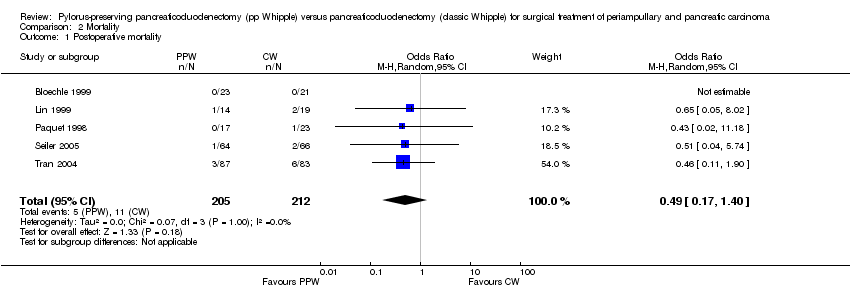
Comparison 2 Mortality, Outcome 1 Postoperative mortality.
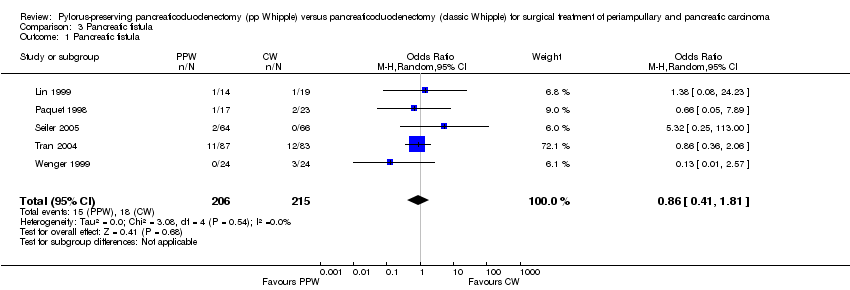
Comparison 3 Pancreatic fistula, Outcome 1 Pancreatic fistula.

Comparison 4 Delayed gastric emptying (with sensitivity analysis), Outcome 1 All studies.
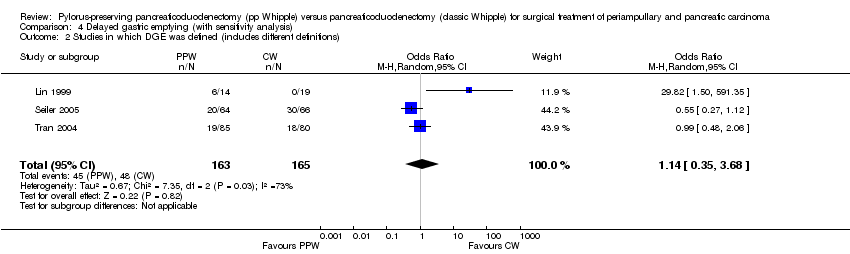
Comparison 4 Delayed gastric emptying (with sensitivity analysis), Outcome 2 Studies in which DGE was defined (includes different definitions).

Comparison 4 Delayed gastric emptying (with sensitivity analysis), Outcome 3 Studies with the same definitions of DGE.
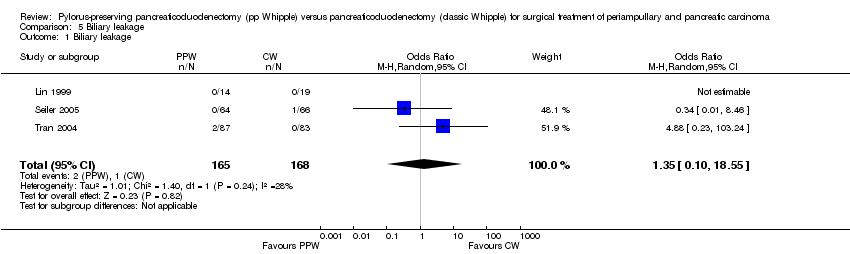
Comparison 5 Biliary leakage, Outcome 1 Biliary leakage.
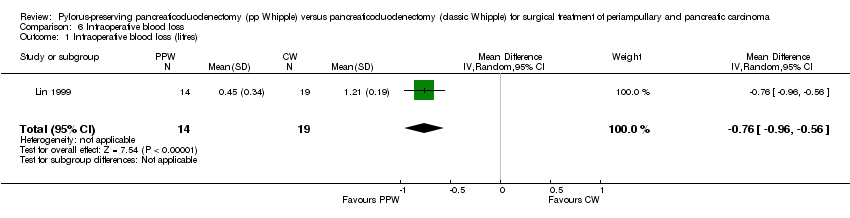
Comparison 6 Intraoperative blood loss, Outcome 1 Intraoperative blood loss (litres).

Comparison 7 Red blood cell transfusion, Outcome 1 Red blood cell transfusion.
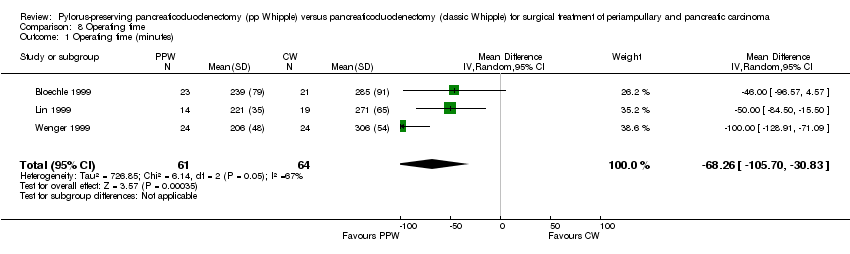
Comparison 8 Operating time, Outcome 1 Operating time (minutes).
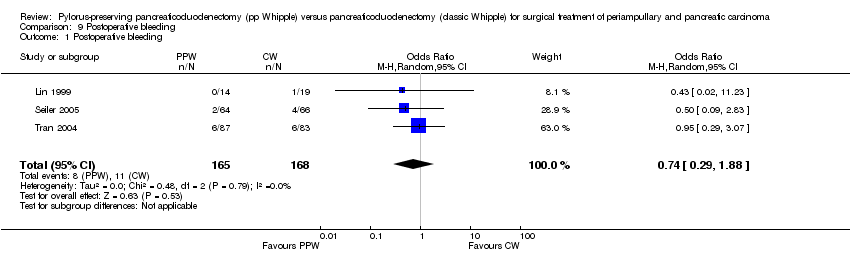
Comparison 9 Postoperative bleeding, Outcome 1 Postoperative bleeding.
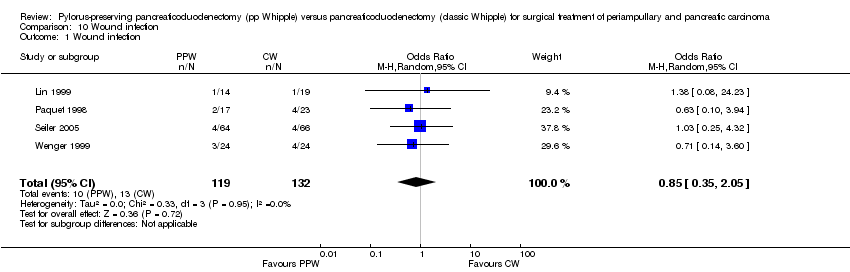
Comparison 10 Wound infection, Outcome 1 Wound infection.
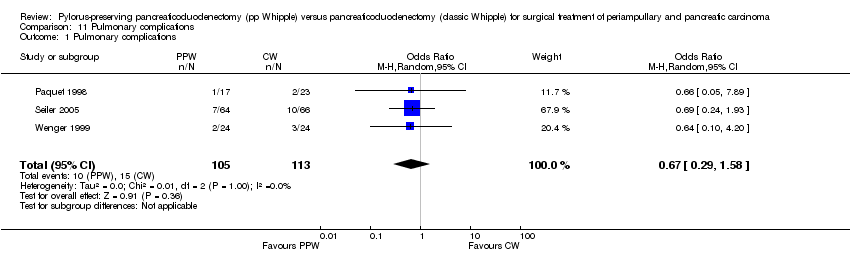
Comparison 11 Pulmonary complications, Outcome 1 Pulmonary complications.

Comparison 12 Necessity for reoperation, Outcome 1 Necessity for reoperation.

Comparison 13 Hospital stay, Outcome 1 Hospital stay (days).
| Survival after surgical treatment for periampullary or pancreatic carcinoma | ||||||
| Patient or population: patients with surgical treatment of periampullary or pancreatic carcinoma | ||||||
| Outcomes | Illustrative comparative risks* (95% CI) | Relative effect | Number of participants | Quality of the evidence | Comments | |
| Assumed risk | Corresponding risk | |||||
| Control | Survival | |||||
| Overall survival | Medium‐risk population | HR 0.84 | 0 | ⊕⊕⊝⊝ | ||
| *The basis for the assumed risk (e.g. median control group risk across studies) is provided in footnotes. The corresponding risk (and its 95% confidence interval) is based on the assumed risk in the comparison group and the relative effect of the intervention (and its 95% CI). | ||||||
| GRADE Working Group grades of evidence. | ||||||
| aInadequate information about sequence generation and allocation concealment. No intention‐to‐treat analysis. | ||||||
| Mortality after surgical treatment for periampullary or pancreatic carcinoma | ||||||
| Patient or population: patients with surgical treatment for periampullary and pancreatic carcinoma | ||||||
| Outcomes | Illustrative comparative risks* (95% CI) | Relative effect | Number of participants | Quality of the evidence | Comments | |
| Assumed risk | Corresponding risk | |||||
| Control | Mortality | |||||
| Postoperative mortality | Study population | OR 0.49 | 417 | ⊕⊕⊝⊝ | ||
| 52 per 1000 | 26 per 1000 | |||||
| Medium‐risk population | ||||||
| 44 per 1000 | 22 per 1000 | |||||
| *The basis for the assumed risk (e.g. median control group risk across studies) is provided in footnotes. The corresponding risk (and its 95% confidence interval) is based on the assumed risk in the comparison group and the relative effect of the intervention (and its 95% CI). | ||||||
| GRADE Working Group grades of evidence. | ||||||
| aConfidence intervals are wide because of small number of events. No sample size calculation was reported for trials except for Seiler and Tran. | ||||||
| Intraoperative blood loss in surgical treatment of patients with periampullary or pancreatic carcinoma | ||||||
| Patient or population: patients with surgical treatment for periampullary or pancreatic carcinoma | ||||||
| Outcomes | Illustrative comparative risks* (95% CI) | Relative effect | Number of participants | Quality of the evidence | Comments | |
| Assumed risk | Corresponding risk | |||||
| Control | Intraoperative blood loss | |||||
| Intraoperative blood loss (litres) | Mean intraoperative blood loss (litres) in the intervention groups was | 33 | ⊕⊕⊝⊝ | |||
| *The basis for the assumed risk (e.g. median control group risk across studies) is provided in footnotes. The corresponding risk (and its 95% confidence interval) is based on the assumed risk in the comparison group and the relative effect of the intervention (and its 95% CI). | ||||||
| GRADE Working Group grades of evidence. | ||||||
| aSmall number of participants. | ||||||
| Operating time in surgical treatment for periampullary or pancreatic carcinoma | ||||||
| Patient or population: patients with surgical treatment for periampullary and pancreatic carcinoma | ||||||
| Outcomes | Illustrative comparative risks* (95% CI) | Relative effect | Number of participants | Quality of the evidence | Comments | |
| Assumed risk | Corresponding risk | |||||
| Control | Operating time | |||||
| Operating time (minutes) | Mean operating time (minutes) in the intervention groups was | 125 | ⊕⊕⊝⊝ | |||
| *The basis for the assumed risk (e.g. median control group risk across studies) is provided in footnotes. The corresponding risk (and its 95% confidence interval) is based on the assumed risk in the comparison group and the relative effect of the intervention (and its 95% CI). | ||||||
| GRADE Working Group grades of evidence. | ||||||
| aSerious limitations in the study design in the trials of Bloechle, Lin and Wenger are a potential source of bias. All are characterised by small sample sizes, lack of blinding and incomplete outcome reporting. | ||||||
| Outcome or subgroup title | No. of studies | No. of participants | Statistical method | Effect size |
| 1 Overall Show forest plot | 3 | Hazard ratio (Random, 95% CI) | 0.84 [0.61, 1.16] | |
| 2 Pancreatic head carcinoma Show forest plot | 3 | Hazard ratio (Random, 95% CI) | 0.73 [0.43, 1.22] | |
| 3 Periampullary cancer Show forest plot | 2 | Hazard ratio (Random, 95% CI) | 0.83 [0.39, 1.76] | |
| Outcome or subgroup title | No. of studies | No. of participants | Statistical method | Effect size |
| 1 Postoperative mortality Show forest plot | 5 | 417 | Odds Ratio (M‐H, Random, 95% CI) | 0.49 [0.17, 1.40] |
| Outcome or subgroup title | No. of studies | No. of participants | Statistical method | Effect size |
| 1 Pancreatic fistula Show forest plot | 5 | 421 | Odds Ratio (M‐H, Random, 95% CI) | 0.86 [0.41, 1.81] |
| Outcome or subgroup title | No. of studies | No. of participants | Statistical method | Effect size |
| 1 All studies Show forest plot | 5 | 412 | Odds Ratio (M‐H, Random, 95% CI) | 2.35 [0.72, 7.61] |
| 2 Studies in which DGE was defined (includes different definitions) Show forest plot | 3 | 328 | Odds Ratio (M‐H, Random, 95% CI) | 1.14 [0.35, 3.68] |
| 3 Studies with the same definitions of DGE Show forest plot | 2 | 198 | Odds Ratio (M‐H, Random, 95% CI) | 4.02 [0.14, 119.16] |
| Outcome or subgroup title | No. of studies | No. of participants | Statistical method | Effect size |
| 1 Biliary leakage Show forest plot | 3 | 333 | Odds Ratio (M‐H, Random, 95% CI) | 1.35 [0.10, 18.55] |
| Outcome or subgroup title | No. of studies | No. of participants | Statistical method | Effect size |
| 1 Intraoperative blood loss (litres) Show forest plot | 1 | 33 | Mean Difference (IV, Random, 95% CI) | ‐0.76 [‐0.96, ‐0.56] |
| Outcome or subgroup title | No. of studies | No. of participants | Statistical method | Effect size |
| 1 Red blood cell transfusion Show forest plot | 2 | 79 | Mean Difference (IV, Random, 95% CI) | ‐0.65 [‐1.92, 0.61] |
| Outcome or subgroup title | No. of studies | No. of participants | Statistical method | Effect size |
| 1 Operating time (minutes) Show forest plot | 3 | 125 | Mean Difference (IV, Random, 95% CI) | ‐68.26 [‐105.70, ‐30.83] |
| Outcome or subgroup title | No. of studies | No. of participants | Statistical method | Effect size |
| 1 Postoperative bleeding Show forest plot | 3 | 333 | Odds Ratio (M‐H, Random, 95% CI) | 0.74 [0.29, 1.88] |
| Outcome or subgroup title | No. of studies | No. of participants | Statistical method | Effect size |
| 1 Wound infection Show forest plot | 4 | 251 | Odds Ratio (M‐H, Random, 95% CI) | 0.85 [0.35, 2.05] |
| Outcome or subgroup title | No. of studies | No. of participants | Statistical method | Effect size |
| 1 Pulmonary complications Show forest plot | 3 | 218 | Odds Ratio (M‐H, Random, 95% CI) | 0.67 [0.29, 1.58] |
| Outcome or subgroup title | No. of studies | No. of participants | Statistical method | Effect size |
| 1 Necessity for reoperation Show forest plot | 2 | 300 | Odds Ratio (M‐H, Random, 95% CI) | 0.82 [0.38, 1.75] |
| Outcome or subgroup title | No. of studies | No. of participants | Statistical method | Effect size |
| 1 Hospital stay (days) Show forest plot | 1 | 48 | Mean Difference (IV, Random, 95% CI) | ‐1.80 [‐8.94, 5.34] |