Pylorus‐preserving pancreaticoduodenectomy (pp Whipple) versus pancreaticoduodenectomy (classic Whipple) for surgical treatment of periampullary and pancreatic carcinoma
Información
- DOI:
- https://doi.org/10.1002/14651858.CD006053.pub5Copiar DOI

- Base de datos:
-
- Cochrane Database of Systematic Reviews
- Versión publicada:
-
- 11 noviembre 2014see what's new
- Tipo:
-
- Intervention
- Etapa:
-
- Review
- Grupo Editorial Cochrane:
-
Grupo Cochrane de Salud digestiva
- Copyright:
-
- Copyright © 2015 The Cochrane Collaboration. Published by John Wiley & Sons, Ltd.
Cifras del artículo
Altmetric:
Citado por:
Autores
Contributions of authors
Markus Diener and Christina Fitzmaurice contributed equally to this work.
MKD
Designing the review.
Collecting data for the review.
Undertaking searches.
Screening search results.
Organising retrieval of papers.
Screening retrieved papers against inclusion criteria.
Appraising quality of papers.
Extracting data from papers.
Writing to authors of papers to ask for additional information.
Providing additional data about papers.
Obtaining and screening data on unpublished studies.
Managing data for the review.
Entering data into RevMan.
Analysing data.
Interpreting data.
Providing a methodological perspective.
Providing a clinical perspective.
Providing a consumer perspective.
Writing the review.
Performing previous work that served as the foundation of the current study.
CF
Collecting data for the review.
Designing search strategies.
Undertaking searches.
Screening search results.
Organising retrieval of papers.
Screening retrieved papers against inclusion criteria.
Appraising quality of papers.
Extracting data from papers.
Writing to authors of papers to ask for additional information.
Providing additional data about papers.
Obtaining and screening data on unpublished studies.
Managing data for the review.
Entering data into RevMan.
Analysing data.
Interpreting data.
Writing the review.
Revising the review after peer review.
GS
Extracting data from papers.
Analysing data.
Interpreting data.
CMS
Providing a methodological perspective.
Providing general advice on the review.
Interpreting the data.
Providing a clinical perspective.
Providing a policy perspective.
FH
Screening search results.
Organising retrieval of papers.
Screening retrieved papers against inclusion criteria.
Providing a clinical perspective.
Updating the review.
GA
Providing a methodological perspective.
Providing general advice on the review.
MWB
Providing a clinical perspective.
Providing a policy perspective.
Providing general advice on the review.
HPK
Conceiving of the review.
Co‐ordinating the review.
Interpreting the data.
Providing general advice on the review.
Providing a clinical perspective.
Providing a policy perspective.
Declarations of interest
MKD: none known.
CF: holds a T32 NIH training grant (United States of America).
GS: none known.
CS: none known.
FH: none known.
GA: none known.
HPK: After the publication of the first version of this review, Hanns‐Peter Knaebel became the Chief Executive Officer of Aesculap AG (a medical device company which produces surgical instruments) and as such is now in breach of Cochrane's commercial sponsorship policy. As the conclusions of the review have not changed since it was first conducted, the review has not been withdrawn. Hanns‐Peter Knaebel will not be an author of future versions of this review while he is employed by Aesculap AG.
MB: none known.
Acknowledgements
This review was carried out on the basis of a systematic review and meta‐analysis published elsewhere (Diener 2007).
Christina Fitzmaurice holds a T32 NIH training grant (United States of America).
Version history
| Published | Title | Stage | Authors | Version |
| 2016 Feb 16 | Pylorus‐preserving pancreaticoduodenectomy (pp Whipple) versus pancreaticoduodenectomy (classic Whipple) for surgical treatment of periampullary and pancreatic carcinoma | Review | Felix J Hüttner, Christina Fitzmaurice, Guido Schwarzer, Christoph M Seiler, Gerd Antes, Markus W Büchler, Markus K Diener | |
| 2014 Nov 11 | Pylorus‐preserving pancreaticoduodenectomy (pp Whipple) versus pancreaticoduodenectomy (classic Whipple) for surgical treatment of periampullary and pancreatic carcinoma | Review | Markus K Diener, Christina Fitzmaurice, Guido Schwarzer, Christoph M Seiler, Felix J Hüttner, Gerd Antes, Hanns‐Peter Knaebel, Markus W Büchler | |
| 2011 May 11 | Pylorus‐preserving pancreaticoduodenectomy (pp Whipple) versus pancreaticoduodenectomy (classic Whipple) for surgical treatment of periampullary and pancreatic carcinoma | Review | Markus K Diener, Christina Fitzmaurice, Guido Schwarzer, Christoph M Seiler, Gerd Antes, Hanns‐Peter Knaebel, Markus W Büchler | |
| 2011 Feb 16 | Pancreaticoduodenectomy (classic Whipple) versus pylorus‐preserving pancreaticoduodenectomy (pp Whipple) for surgical treatment of periampullary and pancreatic carcinoma | Review | Markus K Diener, Christina Heukaeufer, Guido Schwarzer, Christoph M Seiler, Gerd Antes, Hanns‐Peter Knaebel, Markus W Büchler | |
| 2008 Apr 23 | Pancreaticoduodenectomy (classic Whipple) versus pylorus‐preserving pancreaticoduodenectomy (pp Whipple) for surgical treatment of periampullary and pancreatic carcinoma | Review | Markus K Diener, Christina Heukaeufer, Guido Schwarzer, Christoph M Seiler, Gerd Antes, Hanns‐Peter Knaebel, Markus W Büchler | |
| 2006 Apr 19 | Pancreaticoduodenectomy (classical Whipple) versus pylorus‐preserving pancreaticoduodenectomy (pp Whipple) for surgical treatment of periampullary and pancreatic carcinoma | Protocol | Markus Diener, C Heukaufer, Christoph M Seiler, Gerd Antes, Markus W Büchler, Hanns‐Peter Knaebel, C Heukaeufer | |
Differences between protocol and review
The review differs in five points from the previously published protocol.
-
We summarised the outcomes of postoperative bleeding and postoperative gastrointestinal bleeding into a single outcome.
-
We discarded the outcomes of intra‐abdominal fluid collection/abscess, duration of intensive care unit stay, early and late dumping, postoperative reflux, number and status of removed lymph nodes, shock, sepsis, renal failure, weight loss and endocrine and exocrine insufficiency because no usable data were available.
-
We performed an additional quality assessment on the basis of a checklist developed by Downs et al (Downs 1998).
-
We performed a subgroup analysis for pancreatic head cancer and periampullary cancer for survival.
-
We performed a sensitivity analysis for DGE by using different definitions.
Notes
Christina Fitzmaurice and Markus Diener are joint first review authors and have contributed equally to this work.
Keywords
MeSH
Medical Subject Headings (MeSH) Keywords
- *Pylorus;
- Ampulla of Vater [*surgery];
- Blood Loss, Surgical;
- Common Bile Duct Neoplasms [mortality, *surgery];
- Gastric Emptying;
- Operative Time;
- Organ Sparing Treatments [*methods];
- Pancreatic Fistula [etiology];
- Pancreatic Neoplasms [mortality, *surgery];
- Pancreaticoduodenectomy [adverse effects, *methods, mortality];
- Quality of Life;
- Randomized Controlled Trials as Topic;
Medical Subject Headings Check Words
Female; Humans; Male;
PICO

Risk of bias graph: review authors' judgements about each risk of bias item presented as percentages across all included studies.
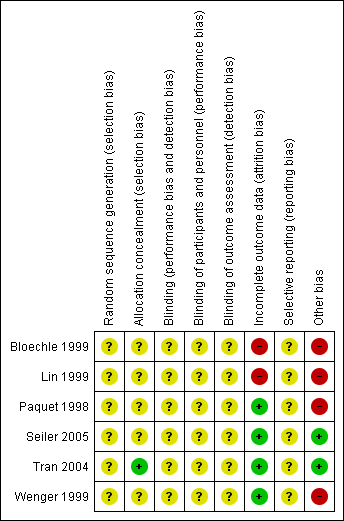
Risk of bias summary: review authors' judgements about each risk of bias item for each included study.
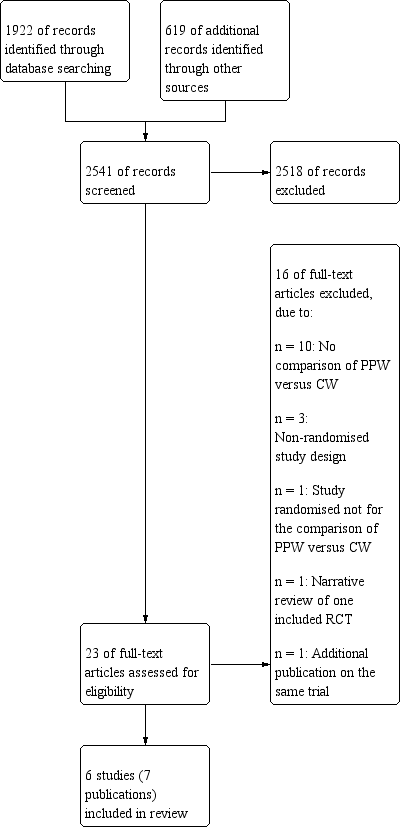
Study flow diagram.
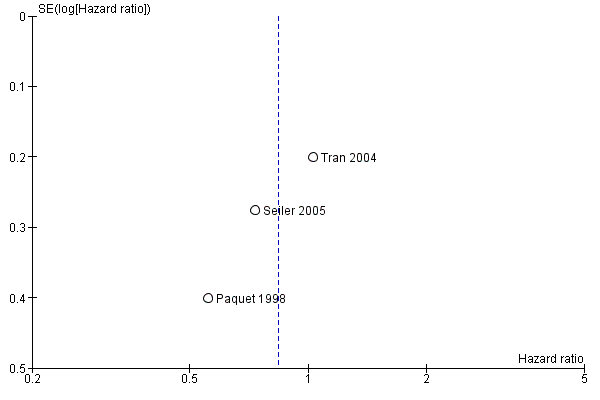
Funnel plot of comparison: 1 Survival, outcome: 1.1 Overall.

Funnel plot of comparison: 2 Mortality, outcome: 2.1 Postoperative mortality.

Funnel plot of comparison: 3 Pancreatic fistula, outcome: 3.1 Pancreatic fistula.
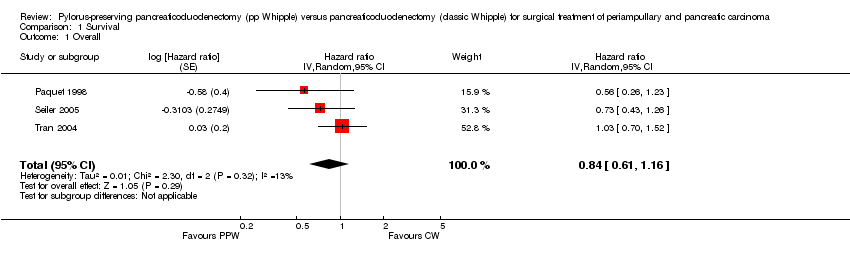
Comparison 1 Survival, Outcome 1 Overall.

Comparison 1 Survival, Outcome 2 Pancreatic head carcinoma.

Comparison 1 Survival, Outcome 3 Periampullary cancer.
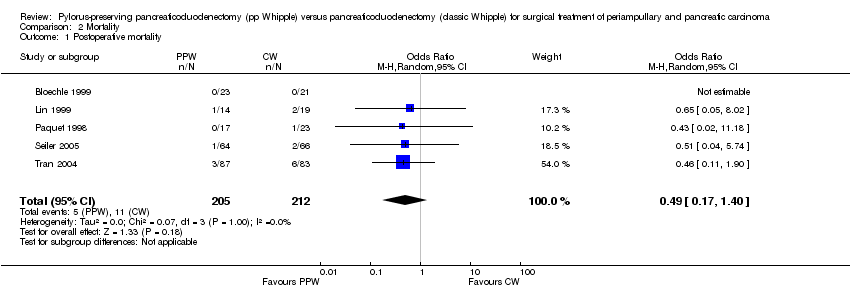
Comparison 2 Mortality, Outcome 1 Postoperative mortality.
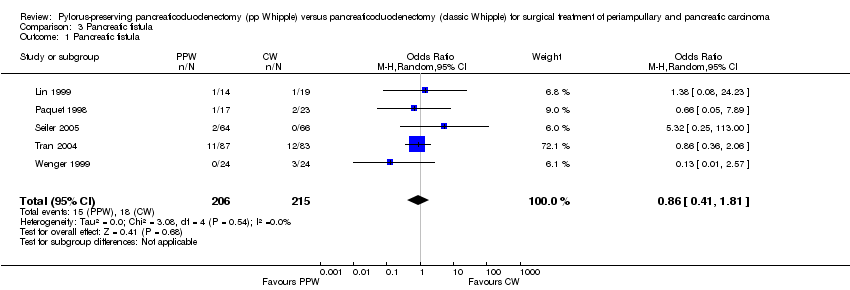
Comparison 3 Pancreatic fistula, Outcome 1 Pancreatic fistula.

Comparison 4 Delayed gastric emptying (with sensitivity analysis), Outcome 1 All studies.
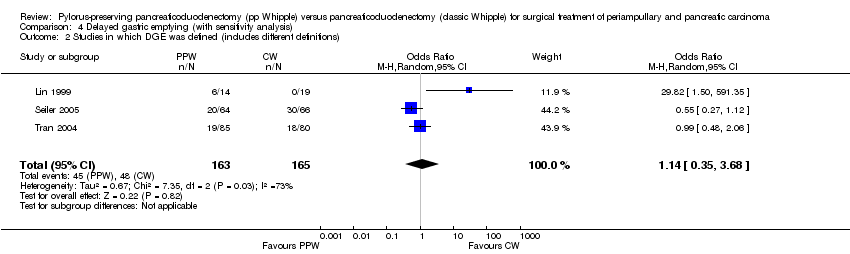
Comparison 4 Delayed gastric emptying (with sensitivity analysis), Outcome 2 Studies in which DGE was defined (includes different definitions).

Comparison 4 Delayed gastric emptying (with sensitivity analysis), Outcome 3 Studies with the same definitions of DGE.
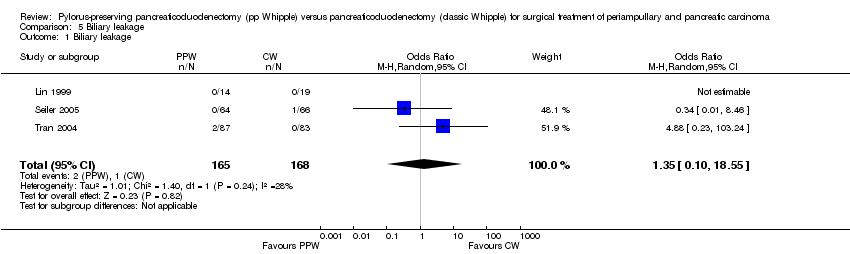
Comparison 5 Biliary leakage, Outcome 1 Biliary leakage.
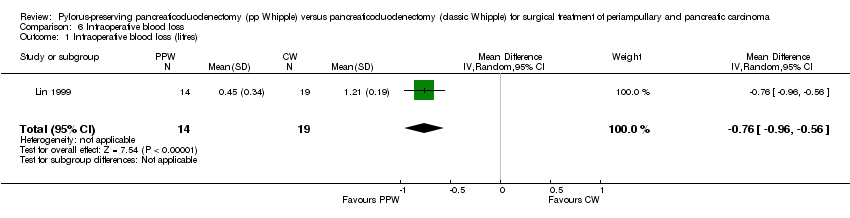
Comparison 6 Intraoperative blood loss, Outcome 1 Intraoperative blood loss (litres).

Comparison 7 Red blood cell transfusion, Outcome 1 Red blood cell transfusion.
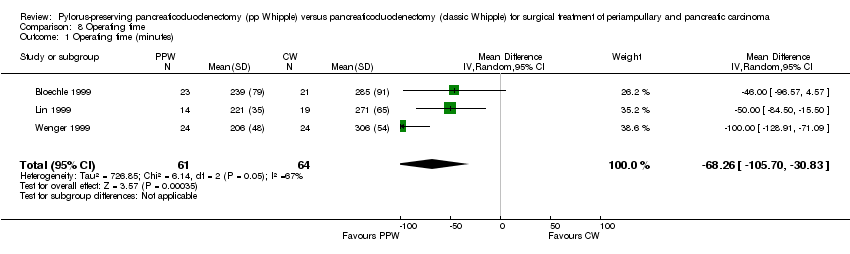
Comparison 8 Operating time, Outcome 1 Operating time (minutes).
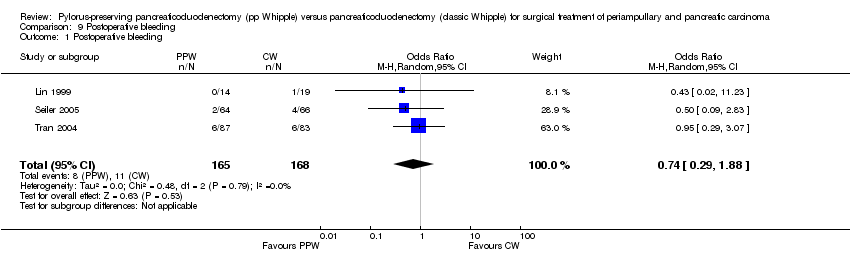
Comparison 9 Postoperative bleeding, Outcome 1 Postoperative bleeding.
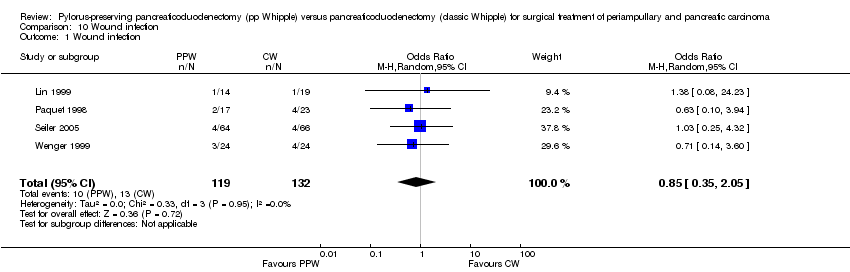
Comparison 10 Wound infection, Outcome 1 Wound infection.
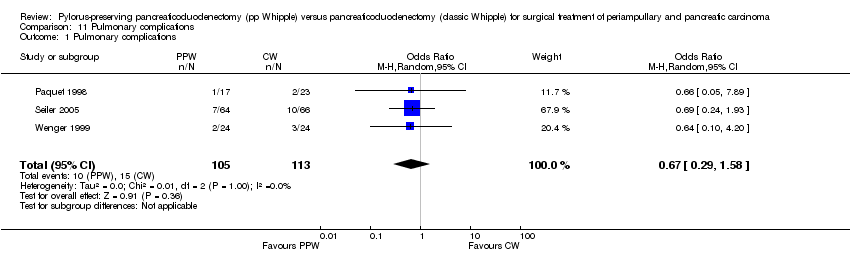
Comparison 11 Pulmonary complications, Outcome 1 Pulmonary complications.

Comparison 12 Necessity for reoperation, Outcome 1 Necessity for reoperation.

Comparison 13 Hospital stay, Outcome 1 Hospital stay (days).
| Survival after surgical treatment for periampullary or pancreatic carcinoma | ||||||
| Patient or population: patients with surgical treatment of periampullary or pancreatic carcinoma | ||||||
| Outcomes | Illustrative comparative risks* (95% CI) | Relative effect | Number of participants | Quality of the evidence | Comments | |
| Assumed risk | Corresponding risk | |||||
| Control | Survival | |||||
| Overall survival | Medium‐risk population | HR 0.84 | 0 | ⊕⊕⊝⊝ | ||
| *The basis for the assumed risk (e.g. median control group risk across studies) is provided in footnotes. The corresponding risk (and its 95% confidence interval) is based on the assumed risk in the comparison group and the relative effect of the intervention (and its 95% CI). | ||||||
| GRADE Working Group grades of evidence. | ||||||
| aInadequate information about sequence generation and allocation concealment. No intention‐to‐treat analysis. | ||||||
| Mortality after surgical treatment for periampullary or pancreatic carcinoma | ||||||
| Patient or population: patients with surgical treatment for periampullary and pancreatic carcinoma | ||||||
| Outcomes | Illustrative comparative risks* (95% CI) | Relative effect | Number of participants | Quality of the evidence | Comments | |
| Assumed risk | Corresponding risk | |||||
| Control | Mortality | |||||
| Postoperative mortality | Study population | OR 0.49 | 417 | ⊕⊕⊝⊝ | ||
| 52 per 1000 | 26 per 1000 | |||||
| Medium‐risk population | ||||||
| 44 per 1000 | 22 per 1000 | |||||
| *The basis for the assumed risk (e.g. median control group risk across studies) is provided in footnotes. The corresponding risk (and its 95% confidence interval) is based on the assumed risk in the comparison group and the relative effect of the intervention (and its 95% CI). | ||||||
| GRADE Working Group grades of evidence. | ||||||
| aConfidence intervals are wide because of small number of events. No sample size calculation was reported for trials except for Seiler and Tran. | ||||||
| Intraoperative blood loss in surgical treatment of patients with periampullary or pancreatic carcinoma | ||||||
| Patient or population: patients with surgical treatment for periampullary or pancreatic carcinoma | ||||||
| Outcomes | Illustrative comparative risks* (95% CI) | Relative effect | Number of participants | Quality of the evidence | Comments | |
| Assumed risk | Corresponding risk | |||||
| Control | Intraoperative blood loss | |||||
| Intraoperative blood loss (litres) | Mean intraoperative blood loss (litres) in the intervention groups was | 33 | ⊕⊕⊝⊝ | |||
| *The basis for the assumed risk (e.g. median control group risk across studies) is provided in footnotes. The corresponding risk (and its 95% confidence interval) is based on the assumed risk in the comparison group and the relative effect of the intervention (and its 95% CI). | ||||||
| GRADE Working Group grades of evidence. | ||||||
| aSmall number of participants. | ||||||
| Operating time in surgical treatment for periampullary or pancreatic carcinoma | ||||||
| Patient or population: patients with surgical treatment for periampullary and pancreatic carcinoma | ||||||
| Outcomes | Illustrative comparative risks* (95% CI) | Relative effect | Number of participants | Quality of the evidence | Comments | |
| Assumed risk | Corresponding risk | |||||
| Control | Operating time | |||||
| Operating time (minutes) | Mean operating time (minutes) in the intervention groups was | 125 | ⊕⊕⊝⊝ | |||
| *The basis for the assumed risk (e.g. median control group risk across studies) is provided in footnotes. The corresponding risk (and its 95% confidence interval) is based on the assumed risk in the comparison group and the relative effect of the intervention (and its 95% CI). | ||||||
| GRADE Working Group grades of evidence. | ||||||
| aSerious limitations in the study design in the trials of Bloechle, Lin and Wenger are a potential source of bias. All are characterised by small sample sizes, lack of blinding and incomplete outcome reporting. | ||||||
| Outcome or subgroup title | No. of studies | No. of participants | Statistical method | Effect size |
| 1 Overall Show forest plot | 3 | Hazard ratio (Random, 95% CI) | 0.84 [0.61, 1.16] | |
| 2 Pancreatic head carcinoma Show forest plot | 3 | Hazard ratio (Random, 95% CI) | 0.73 [0.43, 1.22] | |
| 3 Periampullary cancer Show forest plot | 2 | Hazard ratio (Random, 95% CI) | 0.83 [0.39, 1.76] | |
| Outcome or subgroup title | No. of studies | No. of participants | Statistical method | Effect size |
| 1 Postoperative mortality Show forest plot | 5 | 417 | Odds Ratio (M‐H, Random, 95% CI) | 0.49 [0.17, 1.40] |
| Outcome or subgroup title | No. of studies | No. of participants | Statistical method | Effect size |
| 1 Pancreatic fistula Show forest plot | 5 | 421 | Odds Ratio (M‐H, Random, 95% CI) | 0.86 [0.41, 1.81] |
| Outcome or subgroup title | No. of studies | No. of participants | Statistical method | Effect size |
| 1 All studies Show forest plot | 5 | 412 | Odds Ratio (M‐H, Random, 95% CI) | 2.35 [0.72, 7.61] |
| 2 Studies in which DGE was defined (includes different definitions) Show forest plot | 3 | 328 | Odds Ratio (M‐H, Random, 95% CI) | 1.14 [0.35, 3.68] |
| 3 Studies with the same definitions of DGE Show forest plot | 2 | 198 | Odds Ratio (M‐H, Random, 95% CI) | 4.02 [0.14, 119.16] |
| Outcome or subgroup title | No. of studies | No. of participants | Statistical method | Effect size |
| 1 Biliary leakage Show forest plot | 3 | 333 | Odds Ratio (M‐H, Random, 95% CI) | 1.35 [0.10, 18.55] |
| Outcome or subgroup title | No. of studies | No. of participants | Statistical method | Effect size |
| 1 Intraoperative blood loss (litres) Show forest plot | 1 | 33 | Mean Difference (IV, Random, 95% CI) | ‐0.76 [‐0.96, ‐0.56] |
| Outcome or subgroup title | No. of studies | No. of participants | Statistical method | Effect size |
| 1 Red blood cell transfusion Show forest plot | 2 | 79 | Mean Difference (IV, Random, 95% CI) | ‐0.65 [‐1.92, 0.61] |
| Outcome or subgroup title | No. of studies | No. of participants | Statistical method | Effect size |
| 1 Operating time (minutes) Show forest plot | 3 | 125 | Mean Difference (IV, Random, 95% CI) | ‐68.26 [‐105.70, ‐30.83] |
| Outcome or subgroup title | No. of studies | No. of participants | Statistical method | Effect size |
| 1 Postoperative bleeding Show forest plot | 3 | 333 | Odds Ratio (M‐H, Random, 95% CI) | 0.74 [0.29, 1.88] |
| Outcome or subgroup title | No. of studies | No. of participants | Statistical method | Effect size |
| 1 Wound infection Show forest plot | 4 | 251 | Odds Ratio (M‐H, Random, 95% CI) | 0.85 [0.35, 2.05] |
| Outcome or subgroup title | No. of studies | No. of participants | Statistical method | Effect size |
| 1 Pulmonary complications Show forest plot | 3 | 218 | Odds Ratio (M‐H, Random, 95% CI) | 0.67 [0.29, 1.58] |
| Outcome or subgroup title | No. of studies | No. of participants | Statistical method | Effect size |
| 1 Necessity for reoperation Show forest plot | 2 | 300 | Odds Ratio (M‐H, Random, 95% CI) | 0.82 [0.38, 1.75] |
| Outcome or subgroup title | No. of studies | No. of participants | Statistical method | Effect size |
| 1 Hospital stay (days) Show forest plot | 1 | 48 | Mean Difference (IV, Random, 95% CI) | ‐1.80 [‐8.94, 5.34] |